![Advanced Currency Strength Indicator for MetaTrader 4 Download - [TradingFinder]](https://cdn.tradingfinder.com/image/521999/2-131-en-advanced-currency-strength-mt4-1.webp)
![Advanced Currency Strength Indicator for MetaTrader 4 Download - [TradingFinder] 0](https://cdn.tradingfinder.com/image/521999/2-131-en-advanced-currency-strength-mt4-1.webp)
![Advanced Currency Strength Indicator for MetaTrader 4 Download - [TradingFinder] 1](https://cdn.tradingfinder.com/image/522000/2-131-en-advanced-currency-strength-mt4-2.webp)
![Advanced Currency Strength Indicator for MetaTrader 4 Download - [TradingFinder] 2](https://cdn.tradingfinder.com/image/522002/2-131-en-advanced-currency-strength-mt4-3.webp)
![Advanced Currency Strength Indicator for MetaTrader 4 Download - [TradingFinder] 3](https://cdn.tradingfinder.com/image/522001/2-131-en-advanced-currency-strength-mt4-4.webp)
The Advanced Currency Strength Indicator is a technical analysis tool used in the Forex market to simultaneously identify the relative strength of currencies compared to one another.
In this indicator, each line represents a different currency; for example, the blue line shows USD, and the red line represents EUR.
Additionally, an upward movement of a line indicates increasing currency strength and demand pressure, while a downward movement reflects weakening of the currency.
Advanced Currency Strength Indicator Table
The general features of the Advanced Currency Strength Indicator are presented in the table below.
Indicator Categories: | Oscillators MT4 Indicators Currency Strength MT4 Indicators Trading Assist MT4 Indicators |
Platforms: | MetaTrader 4 Indicators |
Trading Skills: | Intermediate |
Indicator Types: | Breakout MT4 Indicators Reversal MT4 Indicators |
Timeframe: | Multi-Timeframe MT4 Indicators |
Trading Style: | Intraday MT4 Indicators |
Trading Instruments: | Forex MT4 Indicators |
Advanced Currency Strength Indicator at a Glance
The Advanced Currency Strength Indicator compares the simultaneous performance of multiple currency pairs and displays the relative strength of each currency as colored lines.
An upward line movement indicates growing demand and buying pressure. A downward line movement reflects increasing supply and selling pressure.
This trading tool, Line crossovers indicate a shift in the balance of power between currencies and are interpreted as signals of a potential new trend.
Indicator in an Uptrend
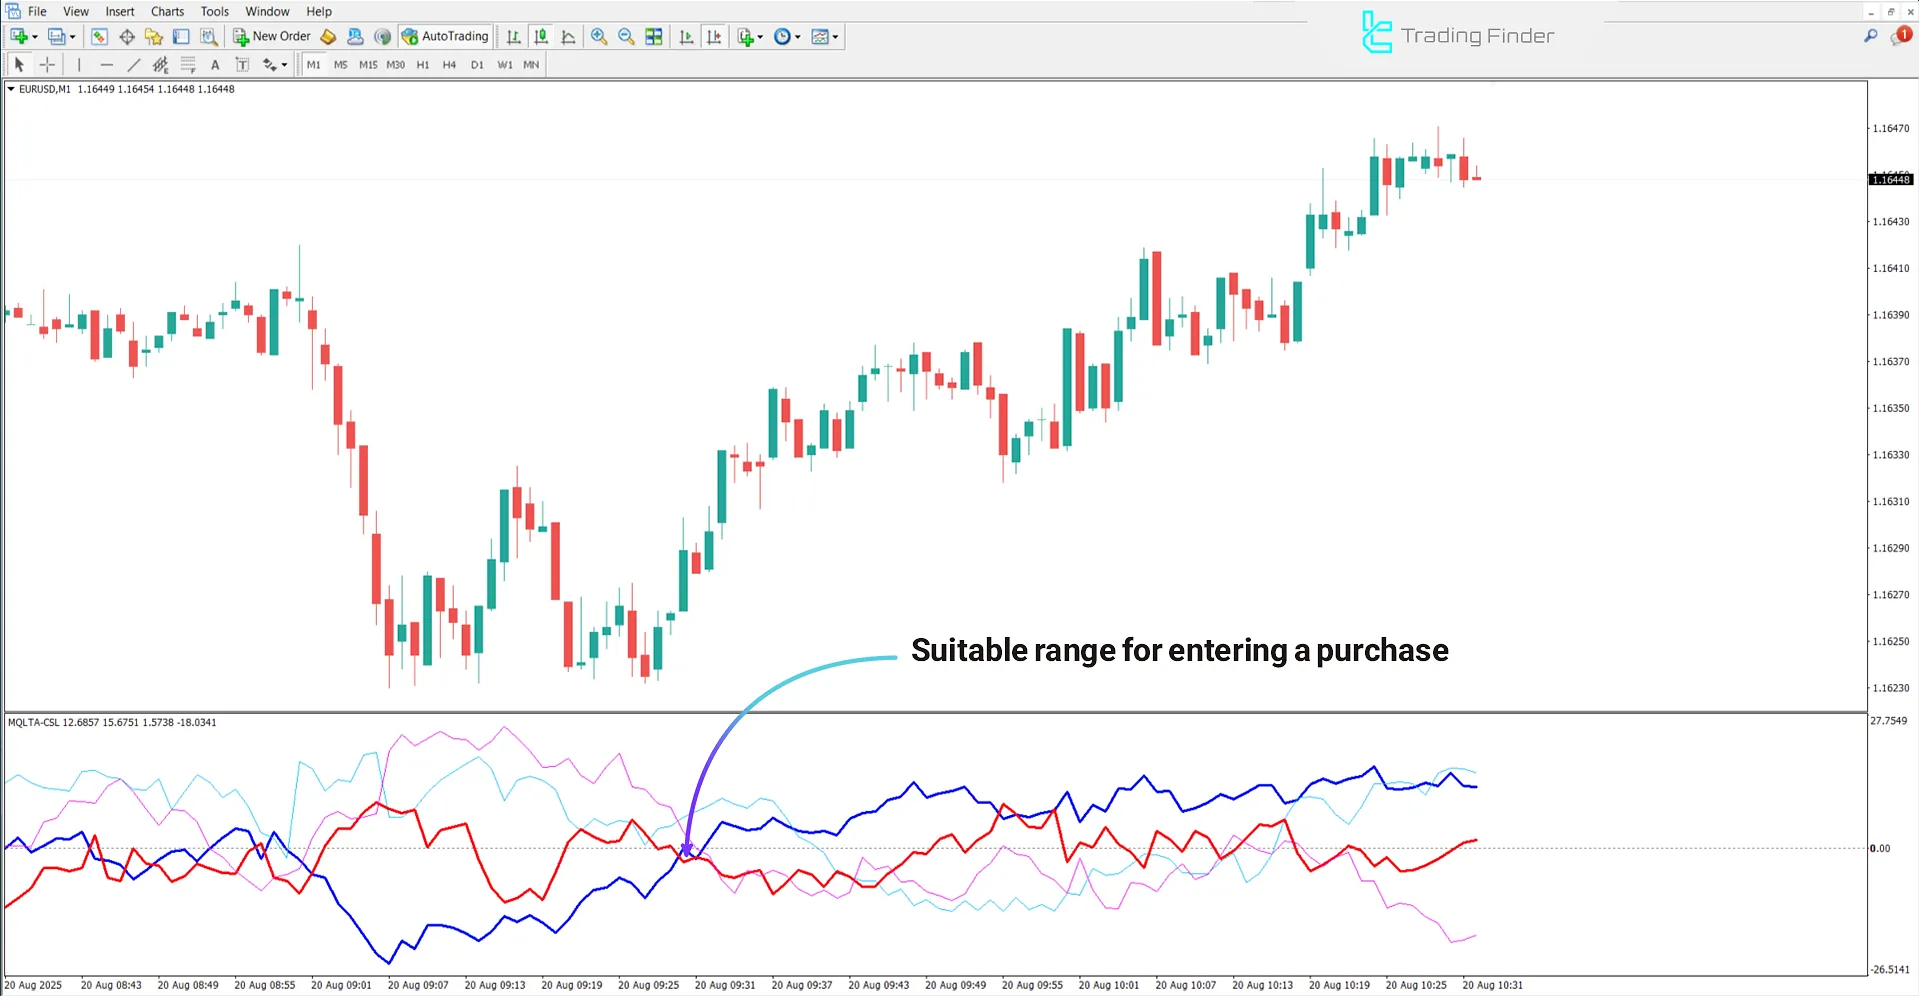
The chart below shows the EUR/USD pair in the 1-minute timeframe. With the strengthening of the Euro against the Dollar in this pair, the indicator displays the EUR line above the USD line, signaling the beginning of an uptrend.
This situation means buying pressure on the Euro and relative weakening of the Dollar. Under such conditions, a buy signal is generated, increasing the probability of continued price growth.

Indicator in a Downtrend
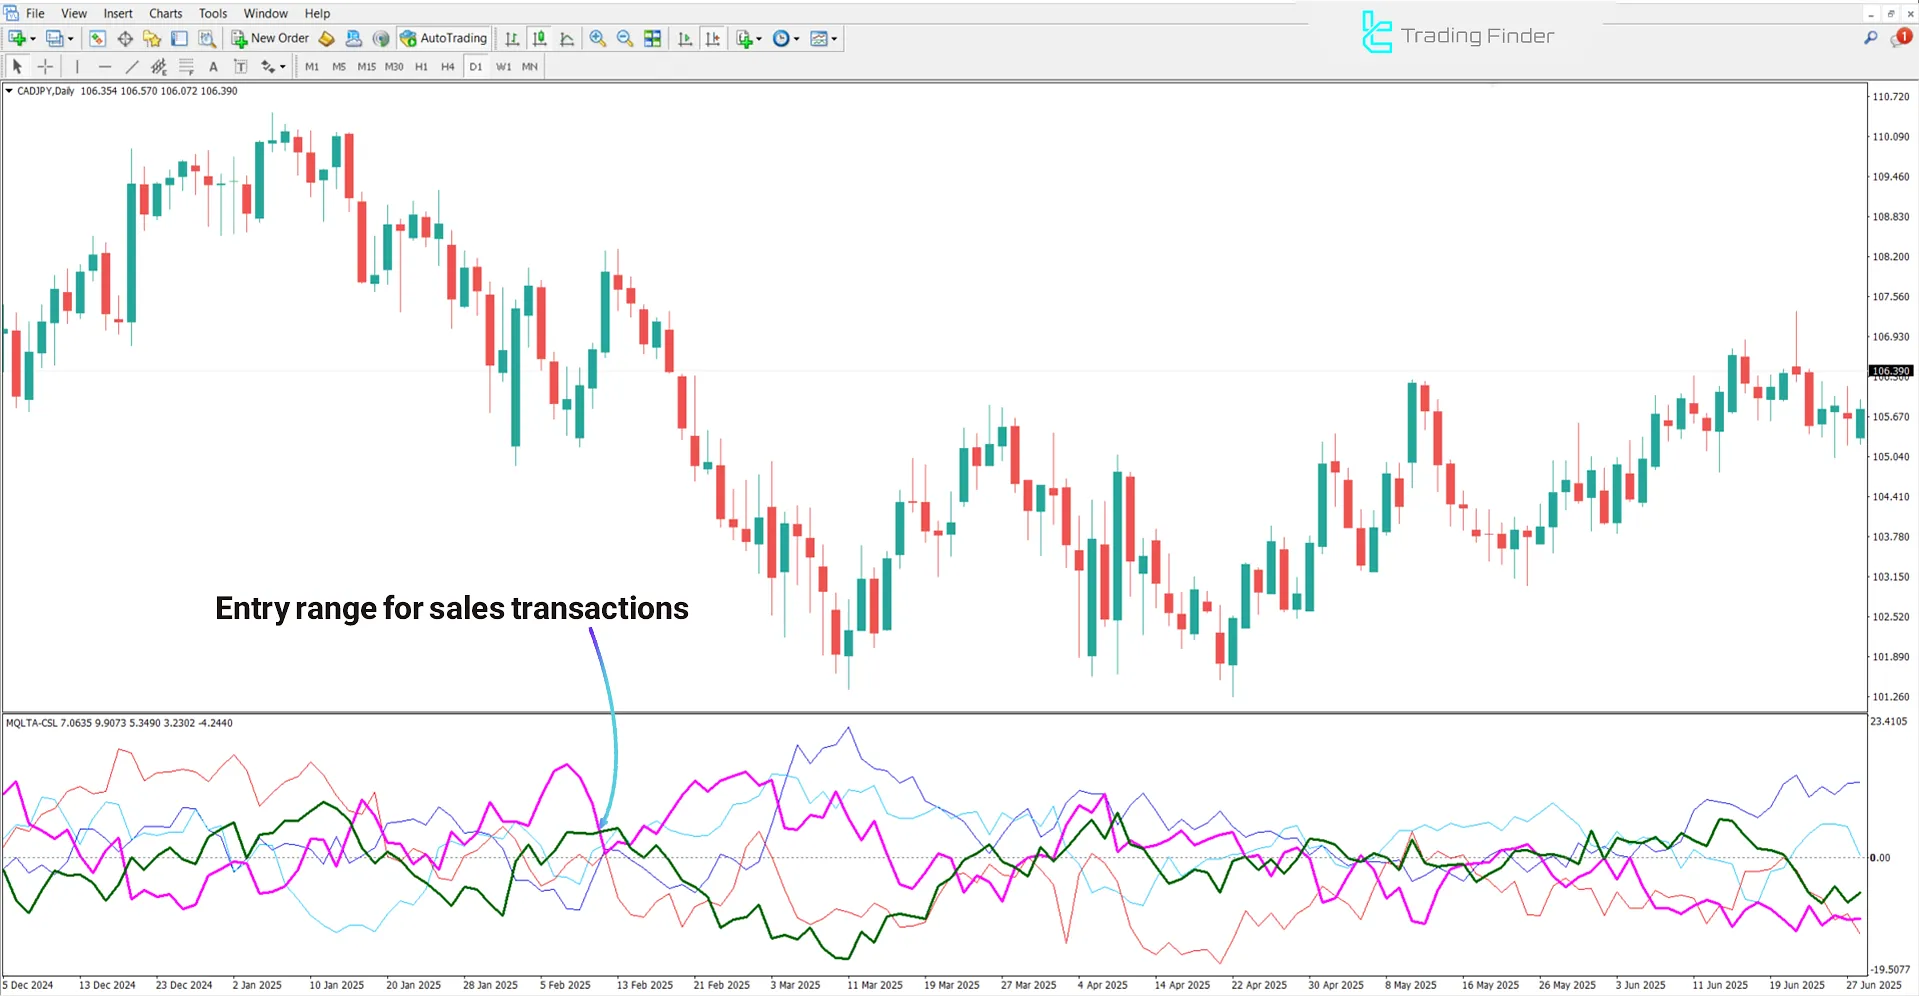
In the CAD/JPY pair on the daily timeframe, when the indicator highlights the weakening of CAD and the strengthening of JPY, a downtrend is formed.
This indicates increased selling pressure on CAD and relative strengthening of JPY. Under these conditions, a sell signal is issued, increasing the likelihood of a further price decline in the following days.

Advanced Currency Strength Indicator Settings
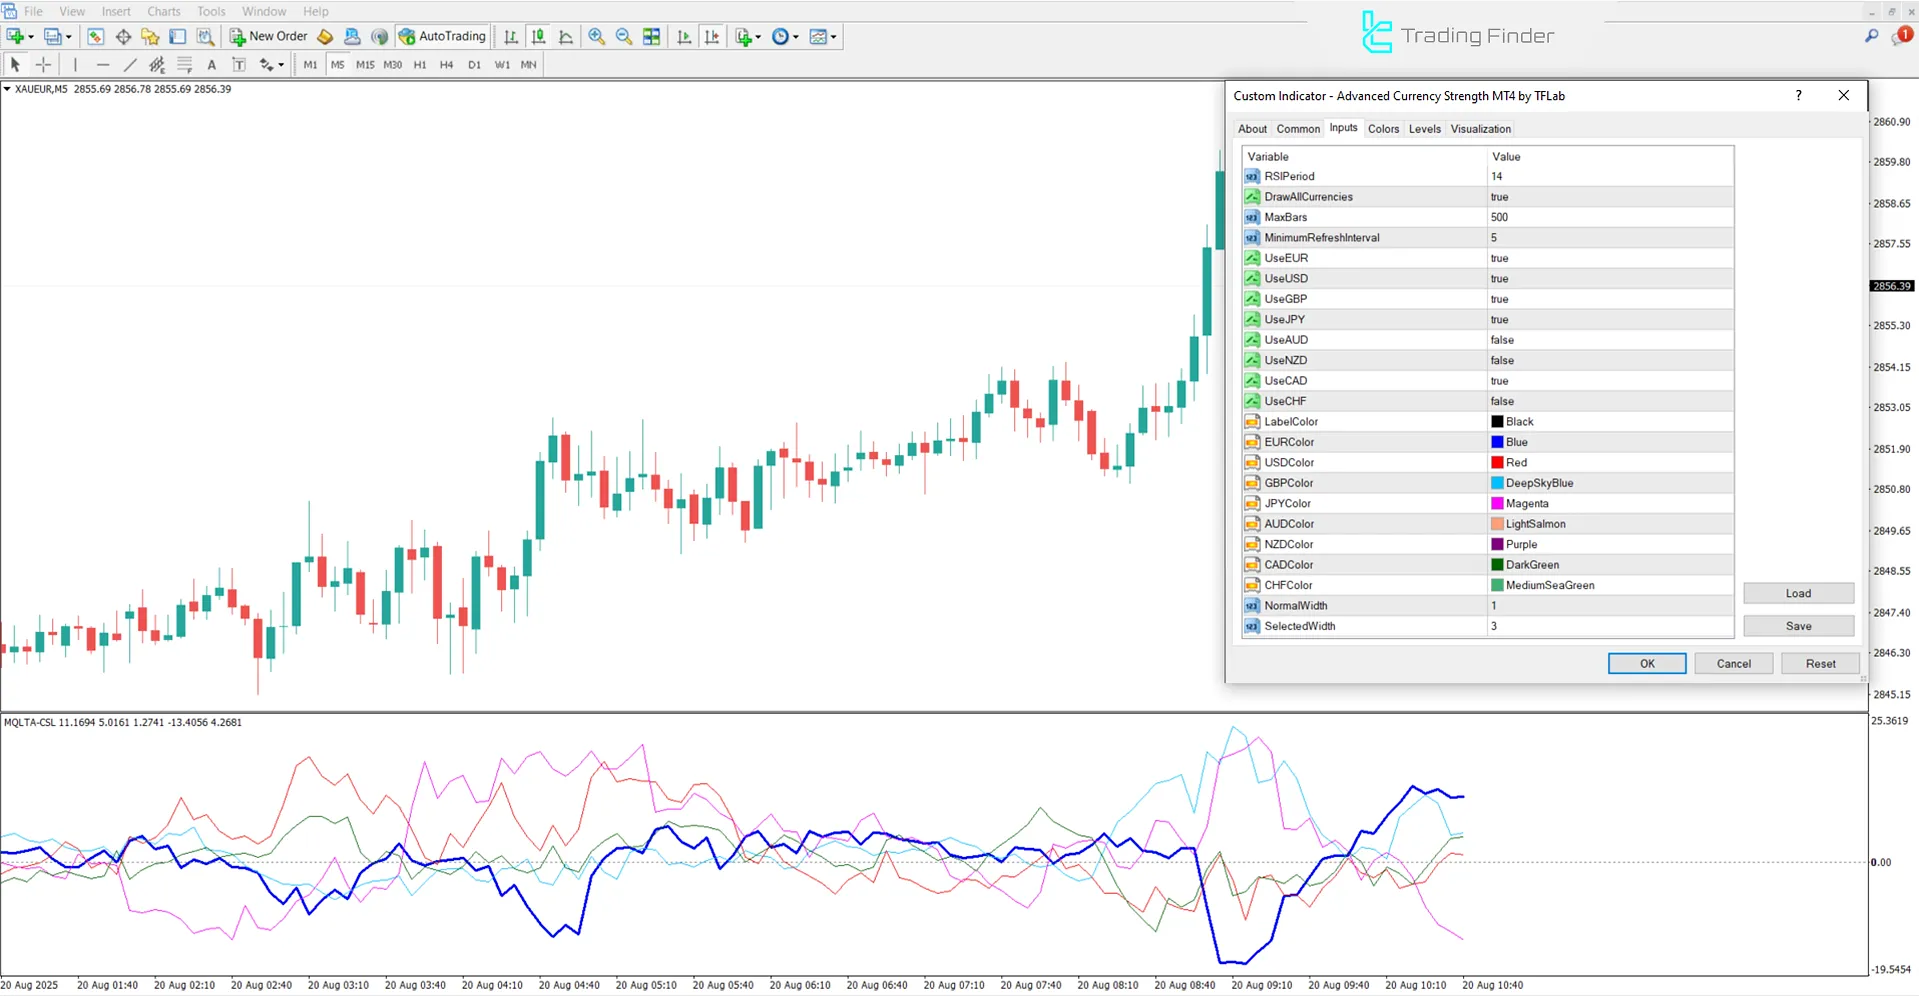
The image below shows the settings panel of the Advanced Currency Strength Indicator:

- RSIPeriod: Relative Strength Index period
- DrawAllCurrencies: Display all currencies
- MaxBars: Maximum number of candles
- MinimumRefreshInterval: Minimum refresh interval
- UseEUR: Enable Euro
- UseUSD: Enable US Dollar
- UseGBP: Enable British Pound
- UseJPY: Enable Japanese Yen
- UseAUD: Enable Australian Dollar
- UseNZD: Enable New Zealand Dollar
- UseCAD: Enable Canadian Dollar
- UseCHF: Enable Swiss Franc
- LabelColor: Label color
- EURColor: Euro line color
- USDColor: US Dollar line color
- GBPColor: British Pound line color
- JPYColor: Japanese Yen line color
- AUDColor: Australian Dollar line color
- NZDColor: New Zealand Dollar line color
- CADColor: Canadian Dollar line color
- CHFColor: Swiss Franc line color
- NormalWidth: Normal line thickness
- SelectedWidth: Selected line thickness
Conclusion
The Advanced Currency Strength Indicator is a suitable tool for measuring the relative strength and weakness of currencies, visually displaying market conditions using colored lines.
Upward line movement indicates increasing demand and buying pressure. Downward line movement signals weakening and selling pressure.
Line crossovers demonstrate shifts in currency power balance and highlight potential entry and exit points.
Advanced Currency Strength Indicator for MT4 PDF
Advanced Currency Strength Indicator for MT4 PDF
Click to download Advanced Currency Strength Indicator for MT4 PDFCan the Advanced Currency Strength Indicator be used for crypto and stocks as well?
To properly use this trading tool, only currency pairs pre-defined in the indicator settings should be selected. Otherwise, using this indicator in markets like cryptocurrencies or stocks will not provide reliable data and signals.
Is it possible to disable or remove some currencies in the Advanced Currency Strength Indicator?
Yes. In this trading tool, to avoid chart clutter, you can deactivate the display of selected currencies.


