![ADX Color Indicator for MetaTrader 4 – Download - [TradingFinder]](https://cdn.tradingfinder.com/image/428928/2-88-en-adx-color-mt4-1.webp)
![ADX Color Indicator for MetaTrader 4 – Download - [TradingFinder] 0](https://cdn.tradingfinder.com/image/428928/2-88-en-adx-color-mt4-1.webp)
![ADX Color Indicator for MetaTrader 4 – Download - [TradingFinder] 1](https://cdn.tradingfinder.com/image/428930/2-88-en-adx-color-mt4-2.webp)
![ADX Color Indicator for MetaTrader 4 – Download - [TradingFinder] 2](https://cdn.tradingfinder.com/image/428927/2-88-en-adx-color-mt4-3.webp)
![ADX Color Indicator for MetaTrader 4 – Download - [TradingFinder] 3](https://cdn.tradingfinder.com/image/428929/2-88-en-adx-color-mt4-4.webp)
The ADX Color Indicator is an enhanced version of the classic ADX (Average Directional Index) used in technical analysis to evaluate trend strength across financial markets, including Forex and cryptocurrencies.
This trading tool uses colored histogram bars to visually display market conditions in terms of trend strength and direction, providing suitable entry and exit zones for trades.
ADX Color Indicator Table
The general specifications of the ADX Color Indicator are shown in the table below:
Indicator Categories: | Oscillators MT4 Indicators Currency Strength MT4 Indicators Trading Assist MT4 Indicators |
Platforms: | MetaTrader 4 Indicators |
Trading Skills: | Elementary |
Indicator Types: | Reversal MT4 Indicators |
Timeframe: | Multi-Timeframe MT4 Indicators |
Trading Style: | Intraday MT4 Indicators |
Trading Instruments: | Share Stocks MT4 Indicators Indices Market MT4 Indicators Commodity Market MT4 Indicators Stock Market MT4 Indicators Cryptocurrency MT4 Indicators Forex MT4 Indicators |
Indicator Overview
The ADX Color Indicator calculates trend strength, regardless of trend direction.
This trading tool is presents data via histogram bars and colors as follows:
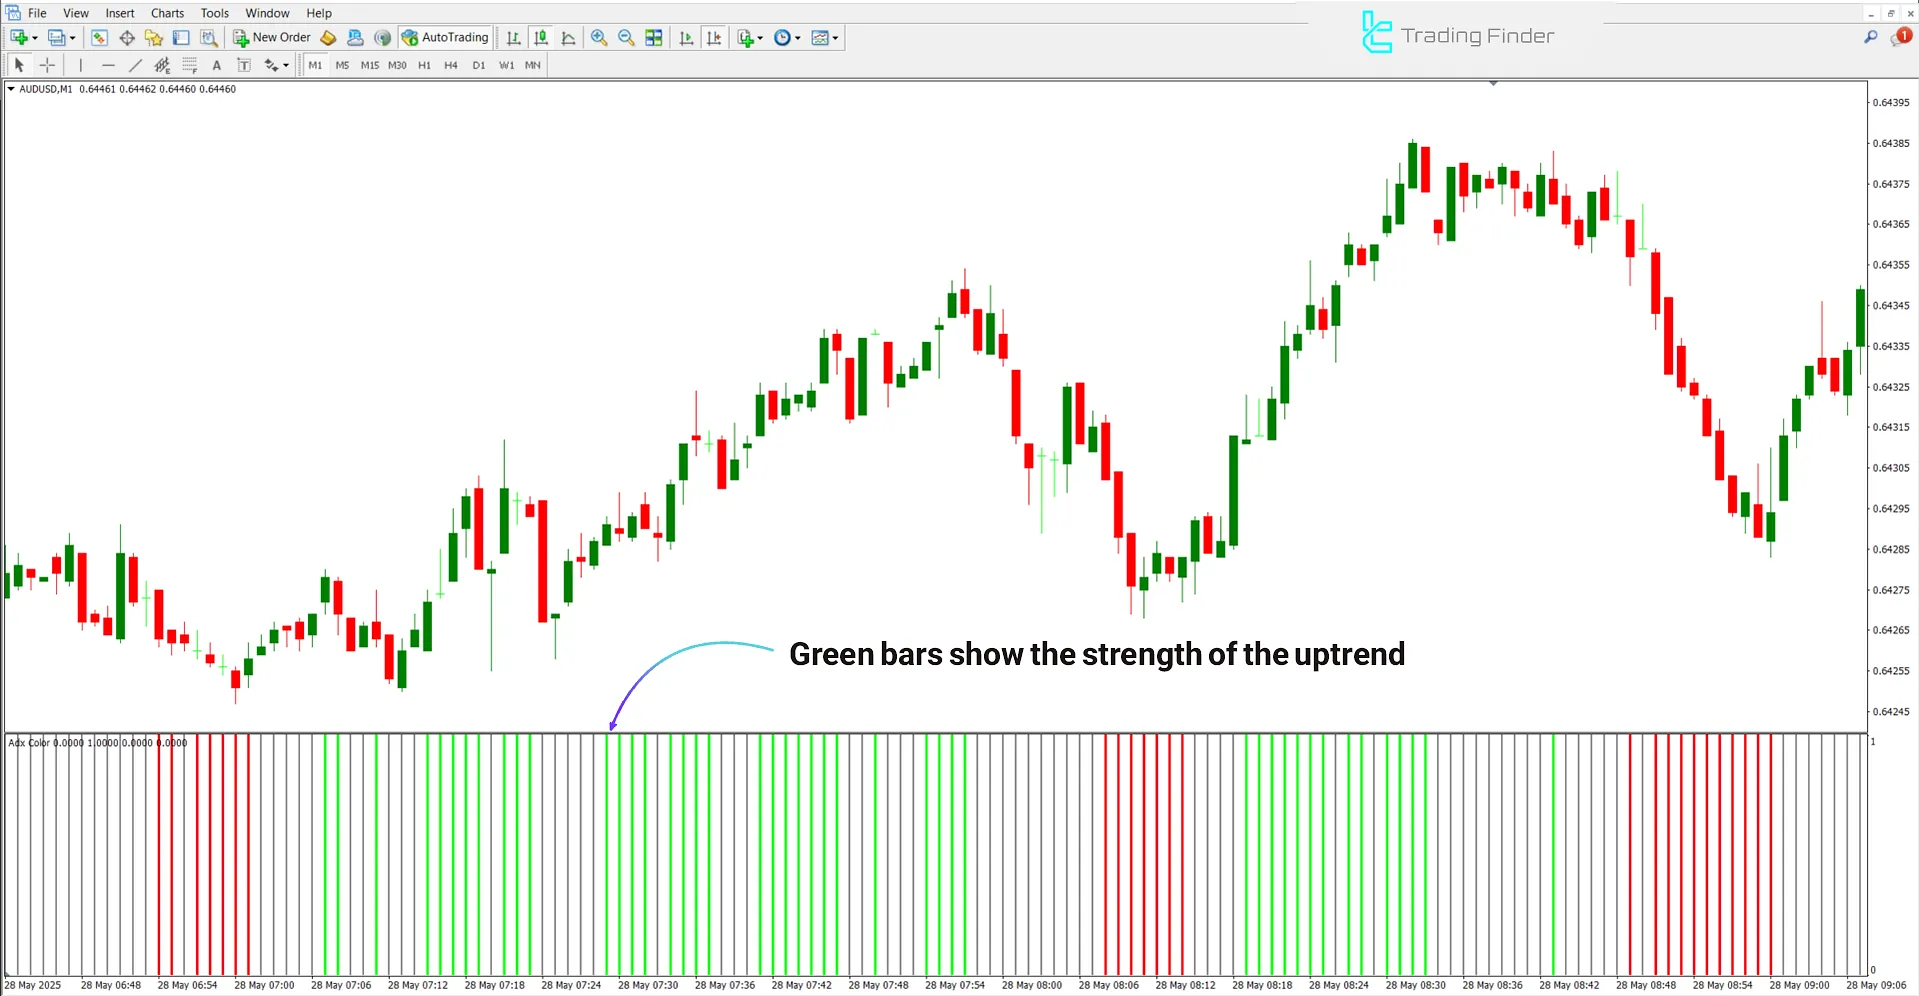
- Green bars: Indicate bullish trend strength
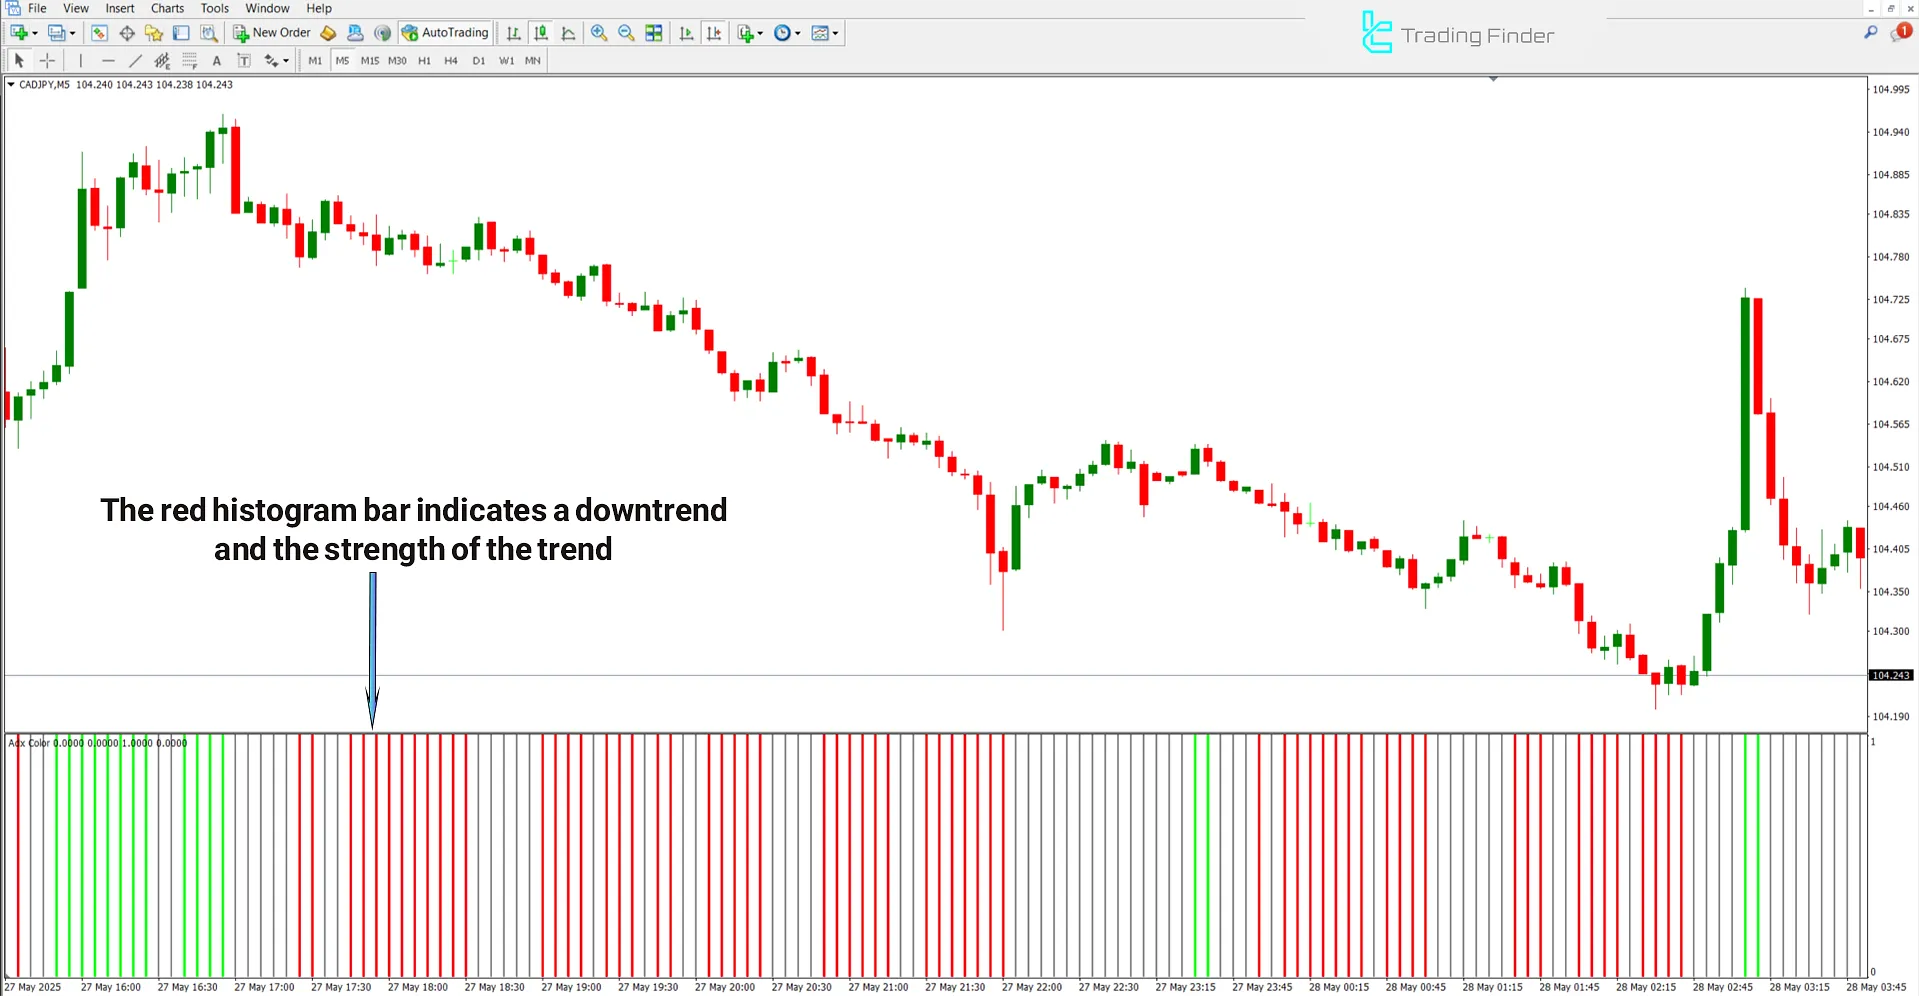
- Red bars: Indicate bearish trend strength
- Gray bars: Indicate a sideways or non-trending market
Uptrend Conditions
On the chart of the AUD/USD currency pair, green histogram bars begin to appear and grow in length, signaling a strengthening bullish trend.
This condition is often accompanied by the formation of higher highs and higher lows in the price chart, reflecting buying pressure.

Downtrend Conditions
The chart below displays the CAD/JPY currency pair on a 5-minute timeframe.
The emergence of red histogram bars with increasing length shows a strengthening bearish trend, providing a valid zone for Sell trades.

ADX Color Indicator Settings
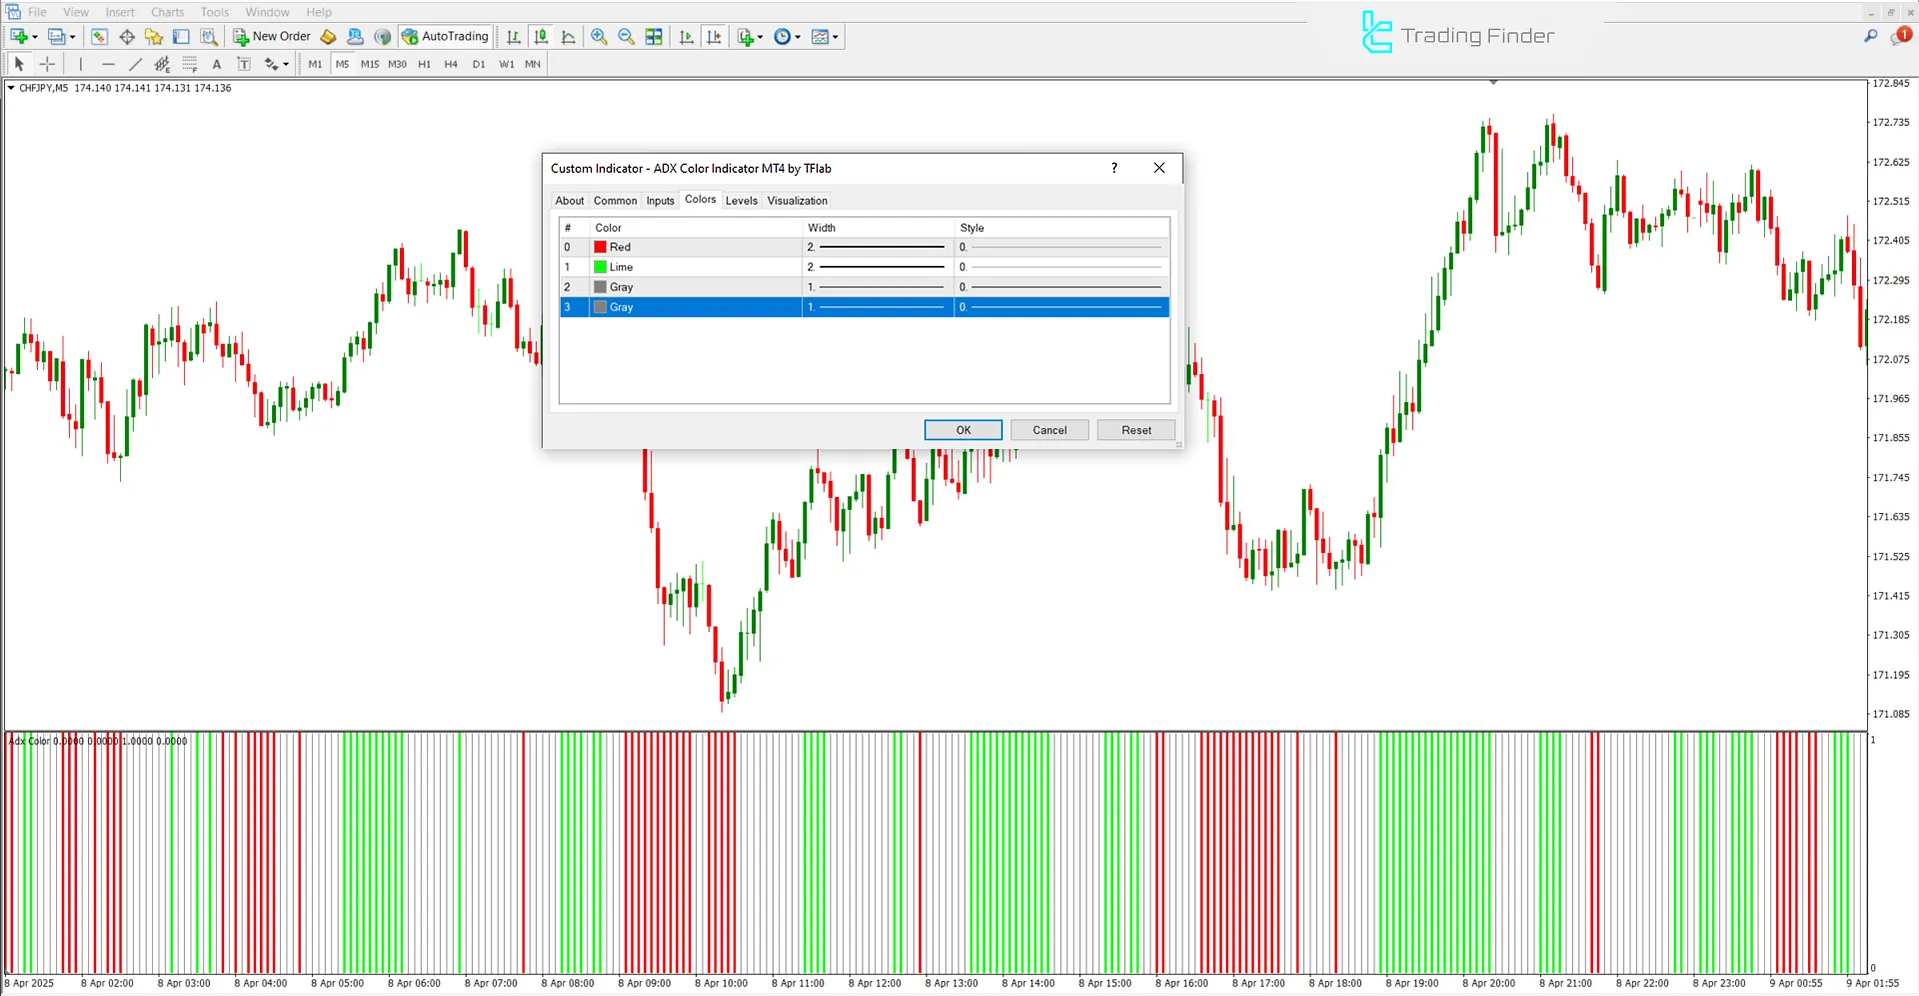
The settings panel of the ADX Color Indicator is shown in the image below:

- Red: Red color;
- Lime: Light green color;
- Gray: Gray color;
- Gray: Gray color (repeated for neutral state).
Conclusion
The ADX Color Indicator is an updated version of the classic ADX, simplifying technical analysis by displaying trend strength through colored bars.
By identifying bullish, bearish, and sideways trends, it helps traders pinpoint entry and exit zones more clearly.
ADX Color MT4 PDF
ADX Color MT4 PDF
Click to download ADX Color MT4 PDFWhat is the best timeframe to use the ADX Color Indicator?
This indicator is compatible with all timeframes.
Does the ADX Color Indicator generate entry or exit signals?
No. It does not provide direct buy/sell signals, but by showing trend strength and direction, it defines potential entry and exit zones.


