![AI Breakout Bands Indicator for MetaTrader 4 - Free Download [TradingFinder]](https://cdn.tradingfinder.com/image/632182/2-174-en-ai-breakout-bands-mt4-1.webp)
![AI Breakout Bands Indicator for MetaTrader 4 - Free Download [TradingFinder] 0](https://cdn.tradingfinder.com/image/632182/2-174-en-ai-breakout-bands-mt4-1.webp)
![AI Breakout Bands Indicator for MetaTrader 4 - Free Download [TradingFinder] 1](https://cdn.tradingfinder.com/image/632185/2-174-en-ai-breakout-bands-mt4-2.webp)
![AI Breakout Bands Indicator for MetaTrader 4 - Free Download [TradingFinder] 2](https://cdn.tradingfinder.com/image/632178/2-174-en-ai-breakout-bands-mt4-3.webp)
![AI Breakout Bands Indicator for MetaTrader 4 - Free Download [TradingFinder] 3](https://cdn.tradingfinder.com/image/632188/2-174-en-ai-breakout-bands-mt4-4.webp)
The AI Breakout Bands Indicator in technical analysis is drawn on the price chart as upper and lower bands around a midline, displaying turquoise and purple areas as a dynamic channel.
The computational core is formed from the Kalman Filter with position and velocity states, and its output is nonlinearly smoothed by the K-Nearest Neighbor (KNN) smoother.
AI Breakout Bands Indicator Table
The general specifications of the AI Breakout Bands Indicator are presented in the table below:
Indicator Categories: | Trading Assist MT4 Indicators Bands & Channels MT4 Indicators |
Platforms: | MetaTrader 4 Indicators |
Trading Skills: | Intermediate |
Indicator Types: | Reversal MT4 Indicators |
Timeframe: | Multi-Timeframe MT4 Indicators |
Trading Style: | Intraday MT4 Indicators |
Trading Instruments: | Share Stocks MT4 Indicators Indices Market MT4 Indicators Commodity Market MT4 Indicators Stock Market MT4 Indicators Cryptocurrency MT4 Indicators Forex MT4 Indicators |
AI Breakout Bands Indicator at a Glance
The AI Breakout Bands Indicator algorithm first estimates the price’s center of gravity using a two-dimensional Kalman state model and adjusts the measurement noise “R” for the level of confidence in the real-time price.
Then the KNN smoother weights similar historical values based on inverse distance, keeping the midline stable but responsive.
As a result, a band is generated to display bullish and bearish waves, illustrating the path of price movement.
Indicator in an Uptrend
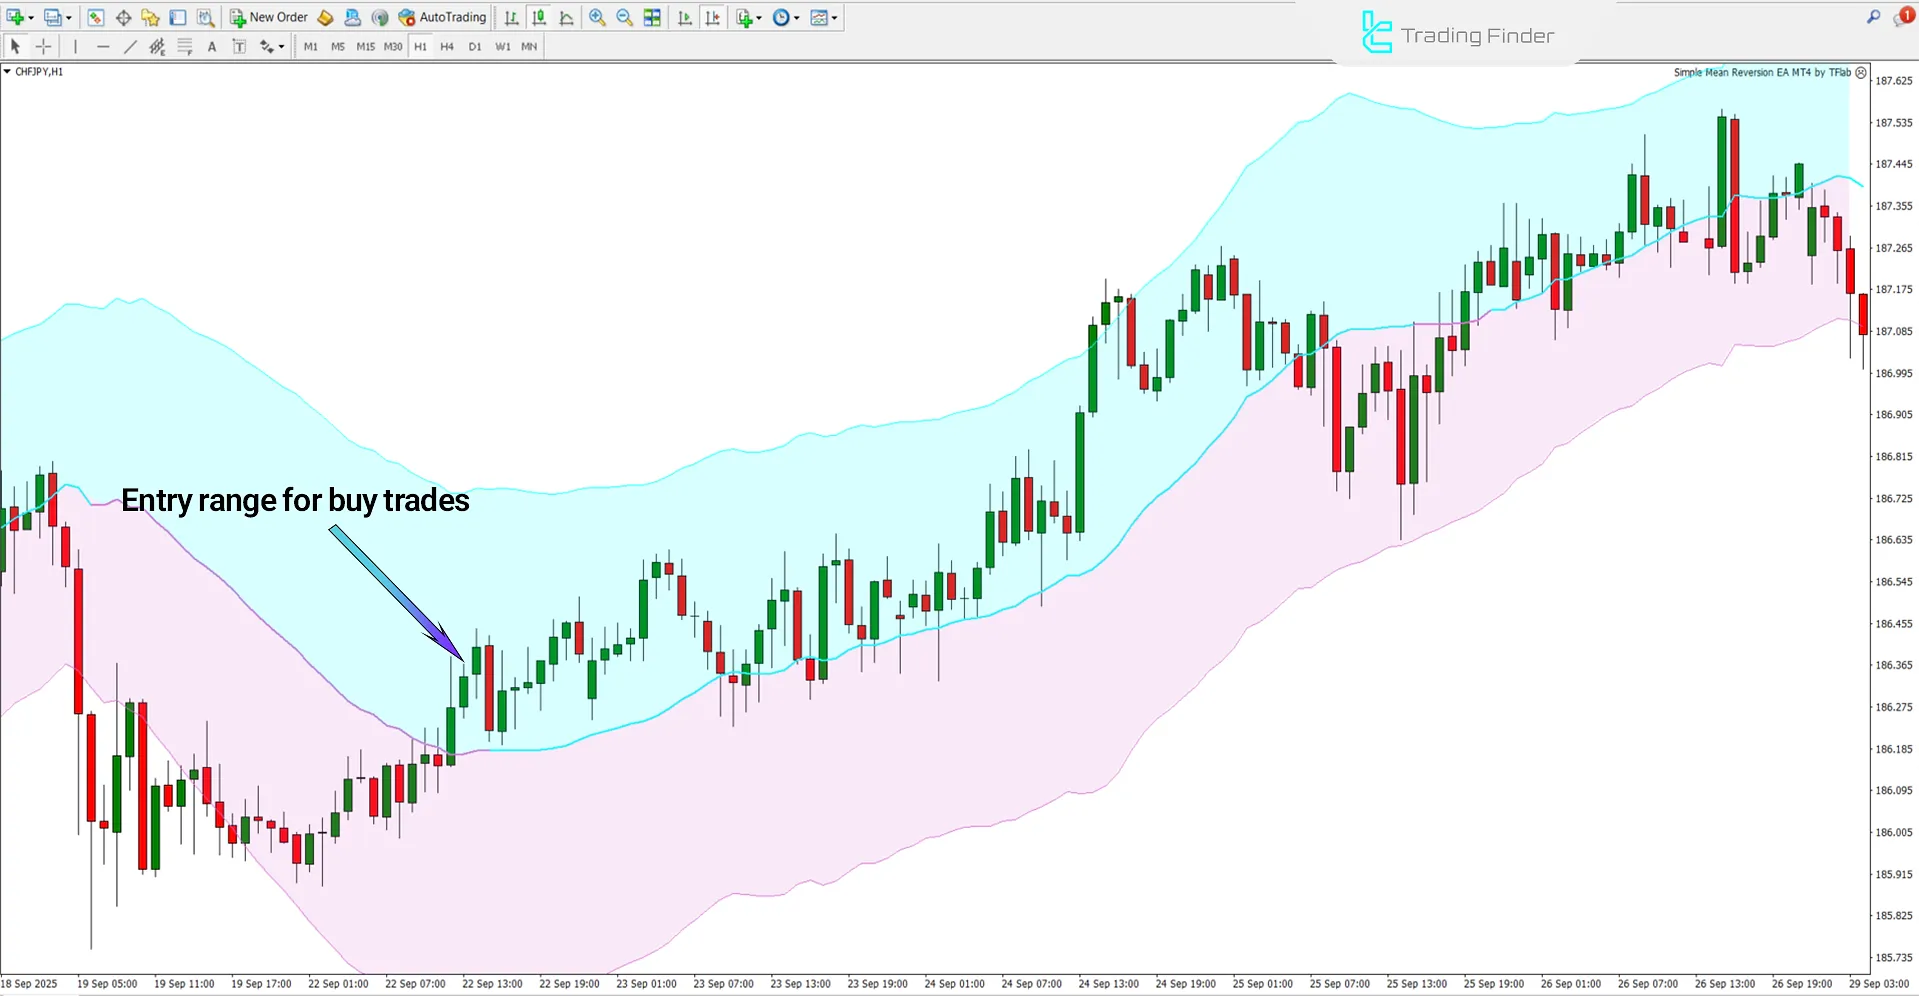
In the CHF/JPY price chart, the trend is confirmed bullish when price closes above the midline and the midline slope remains positive.
Additionally, when the body of the candlestick closes above the midline, a valid breakout occurs, providing a proper entry zone for buy trades.

Indicator in a Downtrend
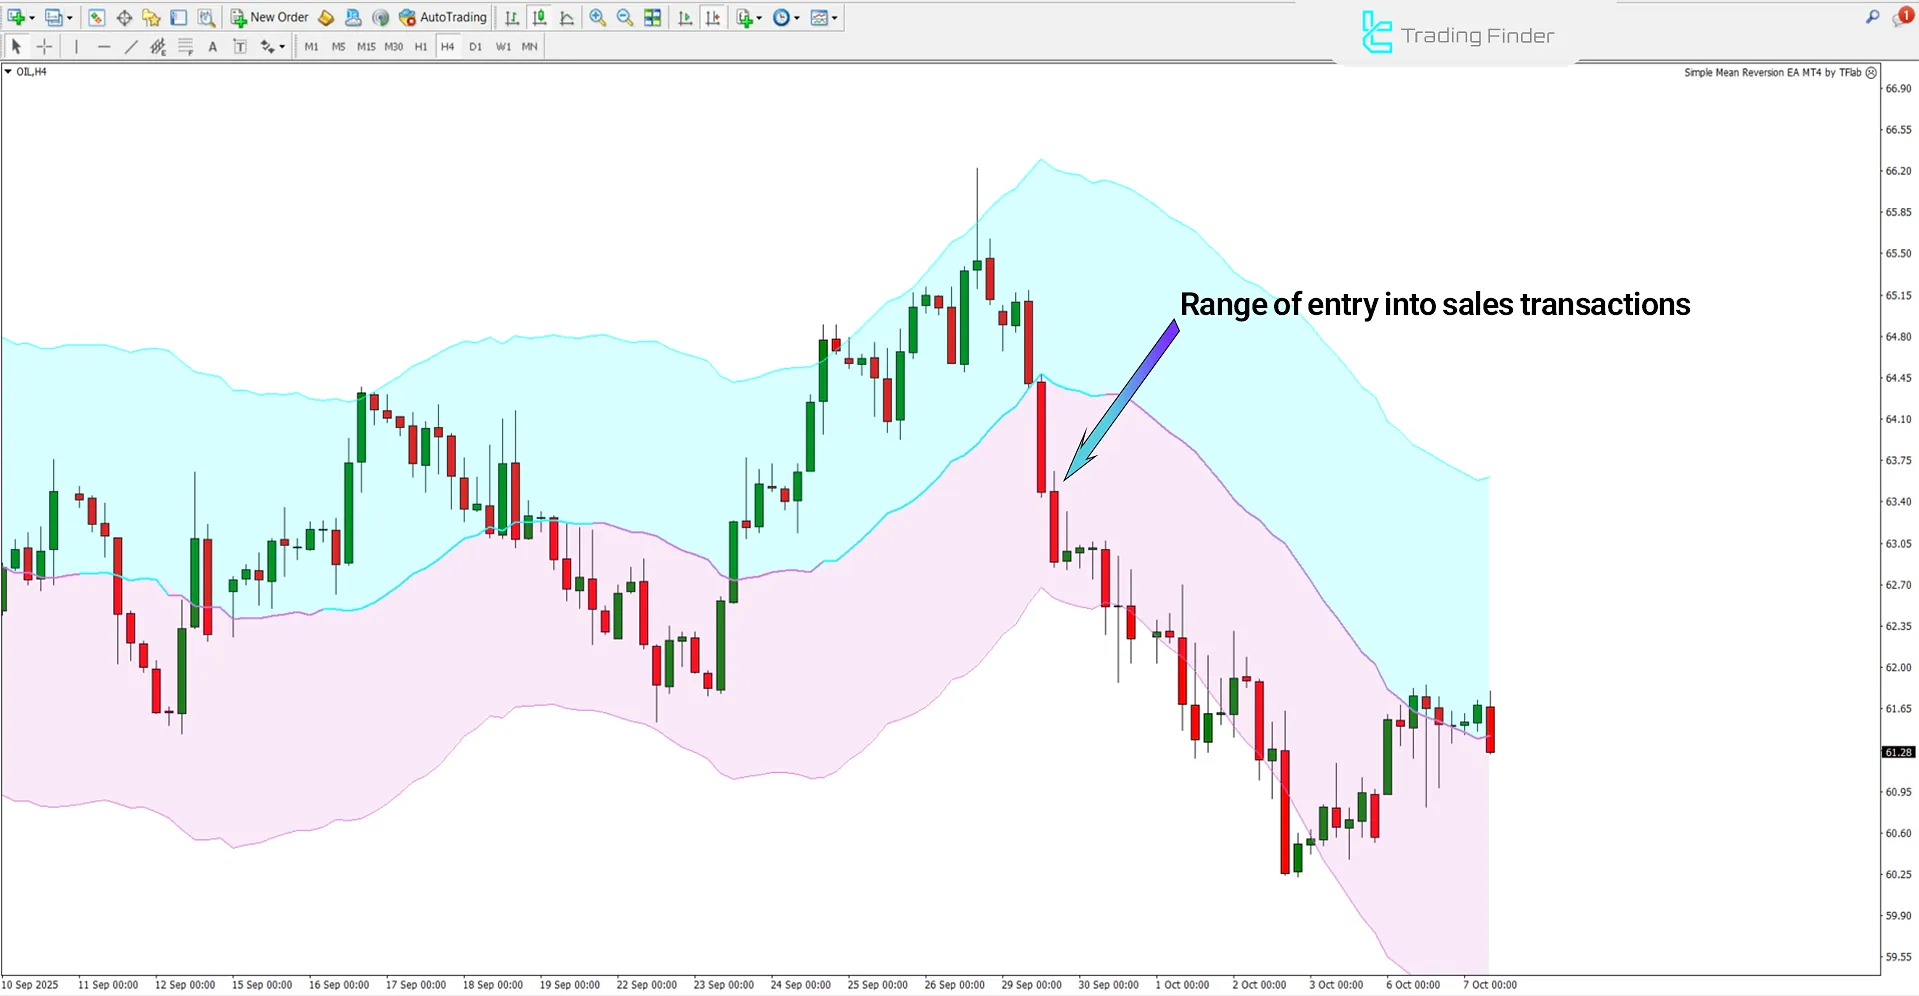
In the 4-hour timeframe of the Crude Oil index, the trend is confirmed bearish when the body of the candlestick closes below the midline and the midline slope remains negative.
This condition provides a suitable entry zone for sell trades.

AI Breakout Bands Indicator Settings
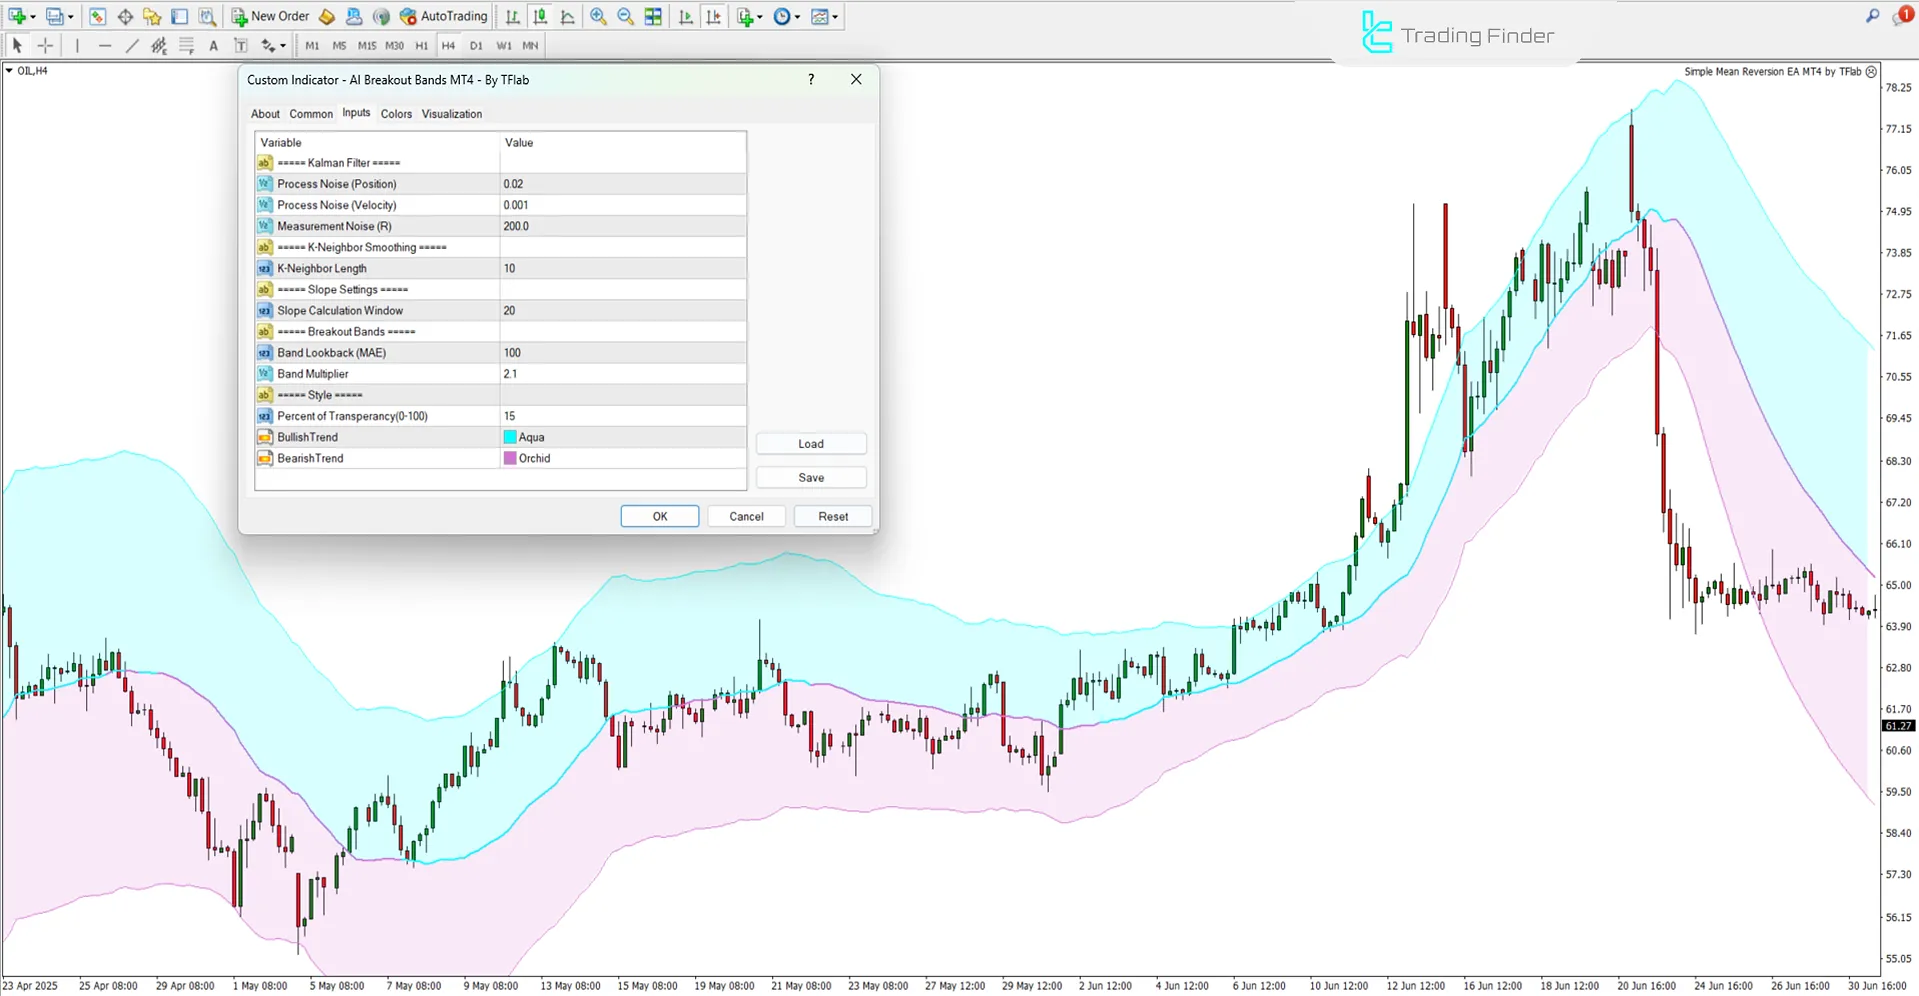
The image below shows the settings panel of the AI Breakout Bands Indicator:

- Process Noise (Position): Process noise filter (Position)
- Process Noise (Velocity): Velocity estimation using the Kalman Filter (Velocity)
- Measurement Noise (R): Measurement error level of data
- K-Neighbor Length: Length of K-neighborhood
- Slope Calculation Window: Window for slope calculation
- Band Lookback (MAE): Number of candles for calculating breakout bands with Mean Absolute Error criterion
- Band Multiplier: Band multiplier display
- Percent of Transparency (0-100): Level of graphical transparency (0 to 100)
- Bullish Trend: Color assigned for the bullish phase
- Bearish Trend: Color assigned for the bearish phase
Conclusion
The AI Breakout Bands Indicator is an analytical tool based on dynamic bands that reconstructs market structure in real time using the combination of the Kalman Filter and KNN smoothing.
This trading tool adaptively tracks price behavior and identifies valid breakout zones with high accuracy.
AI Breakout Bands Indicator for MetaTrader 4 PDF
AI Breakout Bands Indicator for MetaTrader 4 PDF
Click to download AI Breakout Bands Indicator for MetaTrader 4 PDFWhat is the AI Breakout Bands Indicator?
It is an adaptive analytical indicator that, using the combination of the Kalman Filter and KNN smoothing, identifies breakout conditions and market trends.
What is the main application of the AI Breakout Bands Indicator?
The main application of this trading tool is identifying valid breakout zones and trend continuation.


