![Accumulation, Manipulation and Distribution indicator Download MT4 - Free - [TFlab]](https://cdn.tradingfinder.com/image/156972/13-40-en-amd-ict-mt4-1.webp)
![Accumulation, Manipulation and Distribution indicator Download MT4 - Free - [TFlab] 0](https://cdn.tradingfinder.com/image/156972/13-40-en-amd-ict-mt4-1.webp)
![Accumulation, Manipulation and Distribution indicator Download MT4 - Free - [TFlab] 1](https://cdn.tradingfinder.com/image/156969/13-40-en-amd-ict-mt4-2.webp)
![Accumulation, Manipulation and Distribution indicator Download MT4 - Free - [TFlab] 2](https://cdn.tradingfinder.com/image/156971/13-40-en-amd-ict-mt4-3.webp)
![Accumulation, Manipulation and Distribution indicator Download MT4 - Free - [TFlab] 3](https://cdn.tradingfinder.com/image/156970/13-40-en-amd-ict-mt4-4.webp)
The Accumulation, Distribution, and Manipulation (AMD) indicator in MetaTrader 4 is one of the liquidity indicators for trend analysis.
This trading tool analyzes volume and price within specific sessions, dividing price action into three stages: Accumulation, Manipulation, and Distribution.
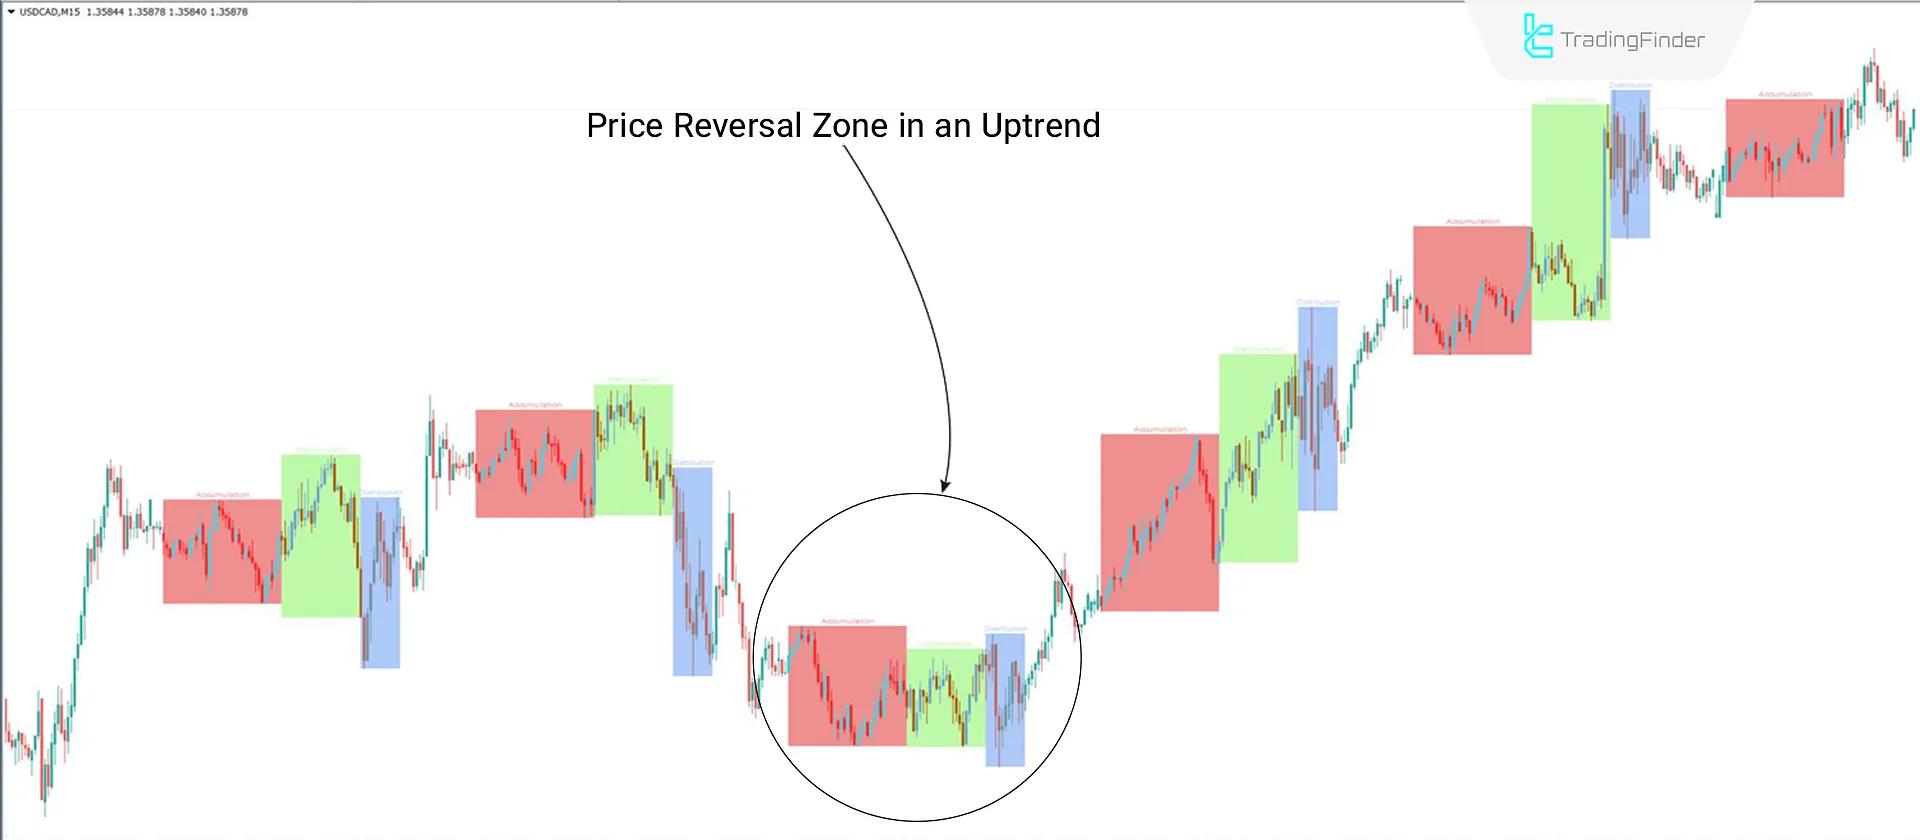
The indicator displays the accumulation stage in pink, distribution in blue, and manipulation in green.The "AMD" indicator can effectively identify potential price reversal points.
Indicator Specifications
Indicator Categories: | ICT MT4 Indicators Price Action MT4 Indicators Liquidity MT4 Indicators |
Platforms: | MetaTrader 4 Indicators |
Trading Skills: | Advanced |
Indicator Types: | Reversal MT4 Indicators |
Timeframe: | M1-M5 Time MT4 Indicators M15-M30 Time MT4 Indicators H4-H1 Time MT4 Indicators |
Trading Style: | Day Trading MT4 Indicators Swing Trading MT4 Indicators |
Trading Instruments: | Share Stocks MT4 Indicators Forward Market MT4 Indicators Commodity Market MT4 Indicators Stock Market MT4 Indicators Cryptocurrency MT4 Indicators Forex MT4 Indicators |
AMD Indicator at a Glance
The "AMD" indicator enables traders to focus on specific parts of the trading day by identifying and analyzing market behavior across different sessions. The Accumulation phase represents buyer entry and asset accumulation, with buying pressure outweighing selling pressure.
The Distribution phase indicates increased selling pressure and asset distribution. Naturally, the Manipulation phase reflects the shift from accumulation to distribution.
AMD Indicator in an Uptrend
According to the USD/CAD price chart in a 15-minute timeframe, a trend reversal favoring price growth is observable.The accumulation and distribution zones highlight the strength of a trend.
Entry and exit points for trades can be identified by observing trend weaknesses in these zones, which often precede significant movements.

AMD Indicator in a Downtrend
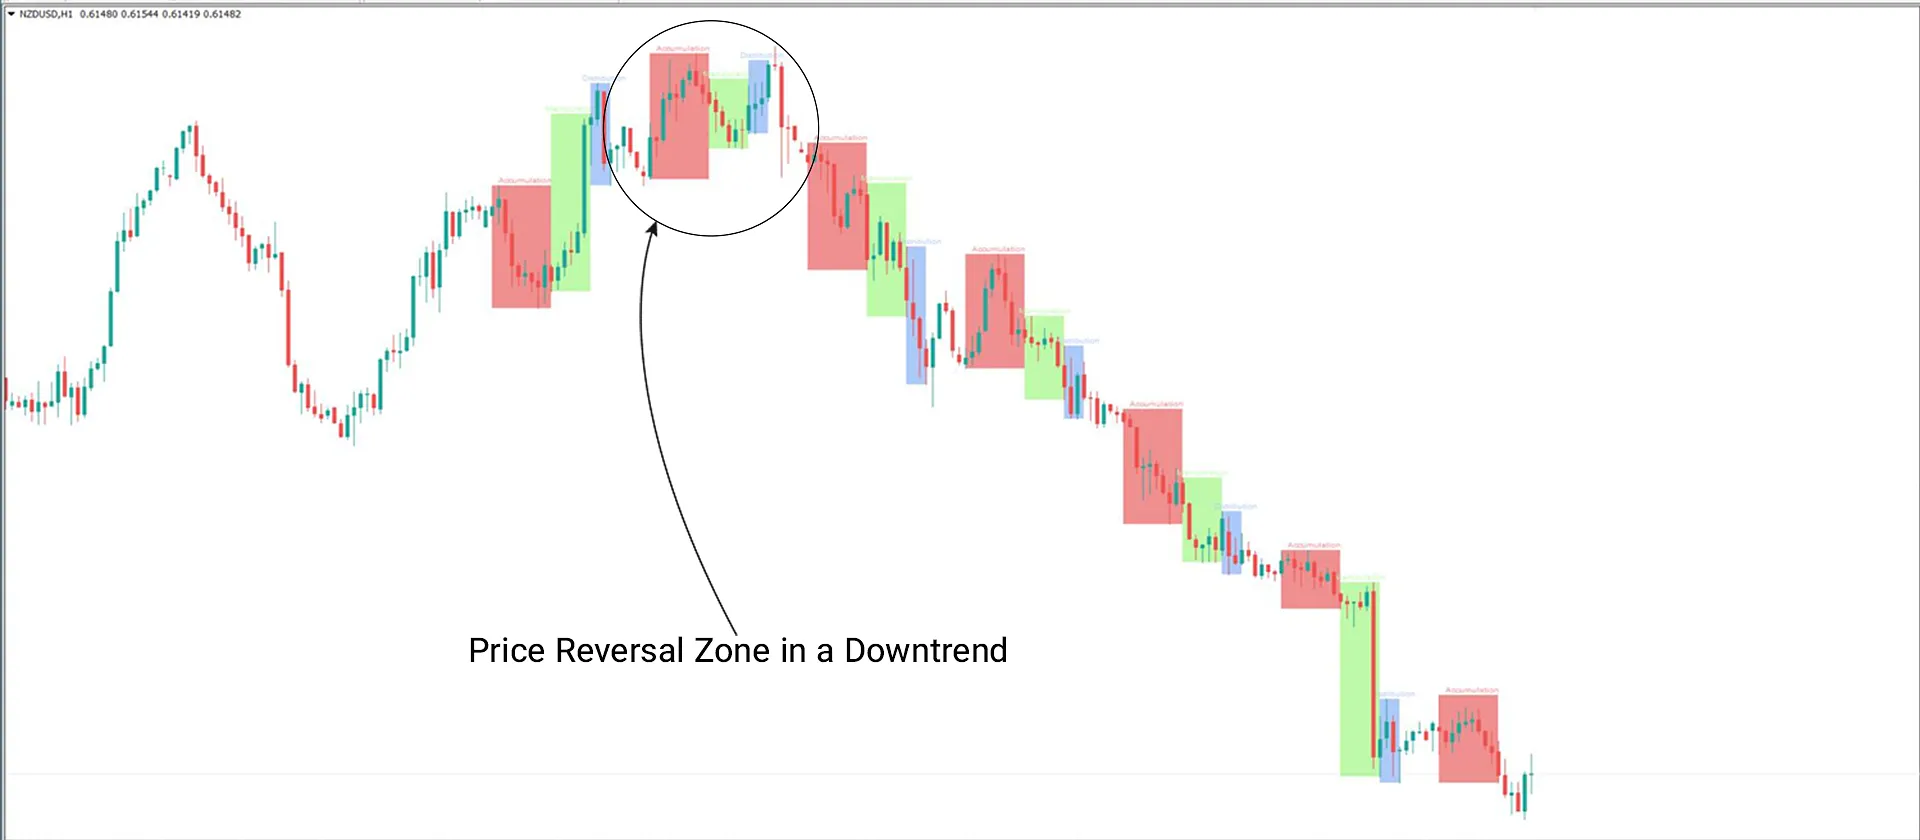
According to the NZD/USD chart on a 1-hour timeframe, weaknesses in the distribution and accumulation zones are visible.These weaknesses suggest a trend change after the distribution phase concludes.
Consequently, traders can identify appropriate short trade positions.The "AMD" indicator zones are defined based on session highs and lows.

Indicator Settings

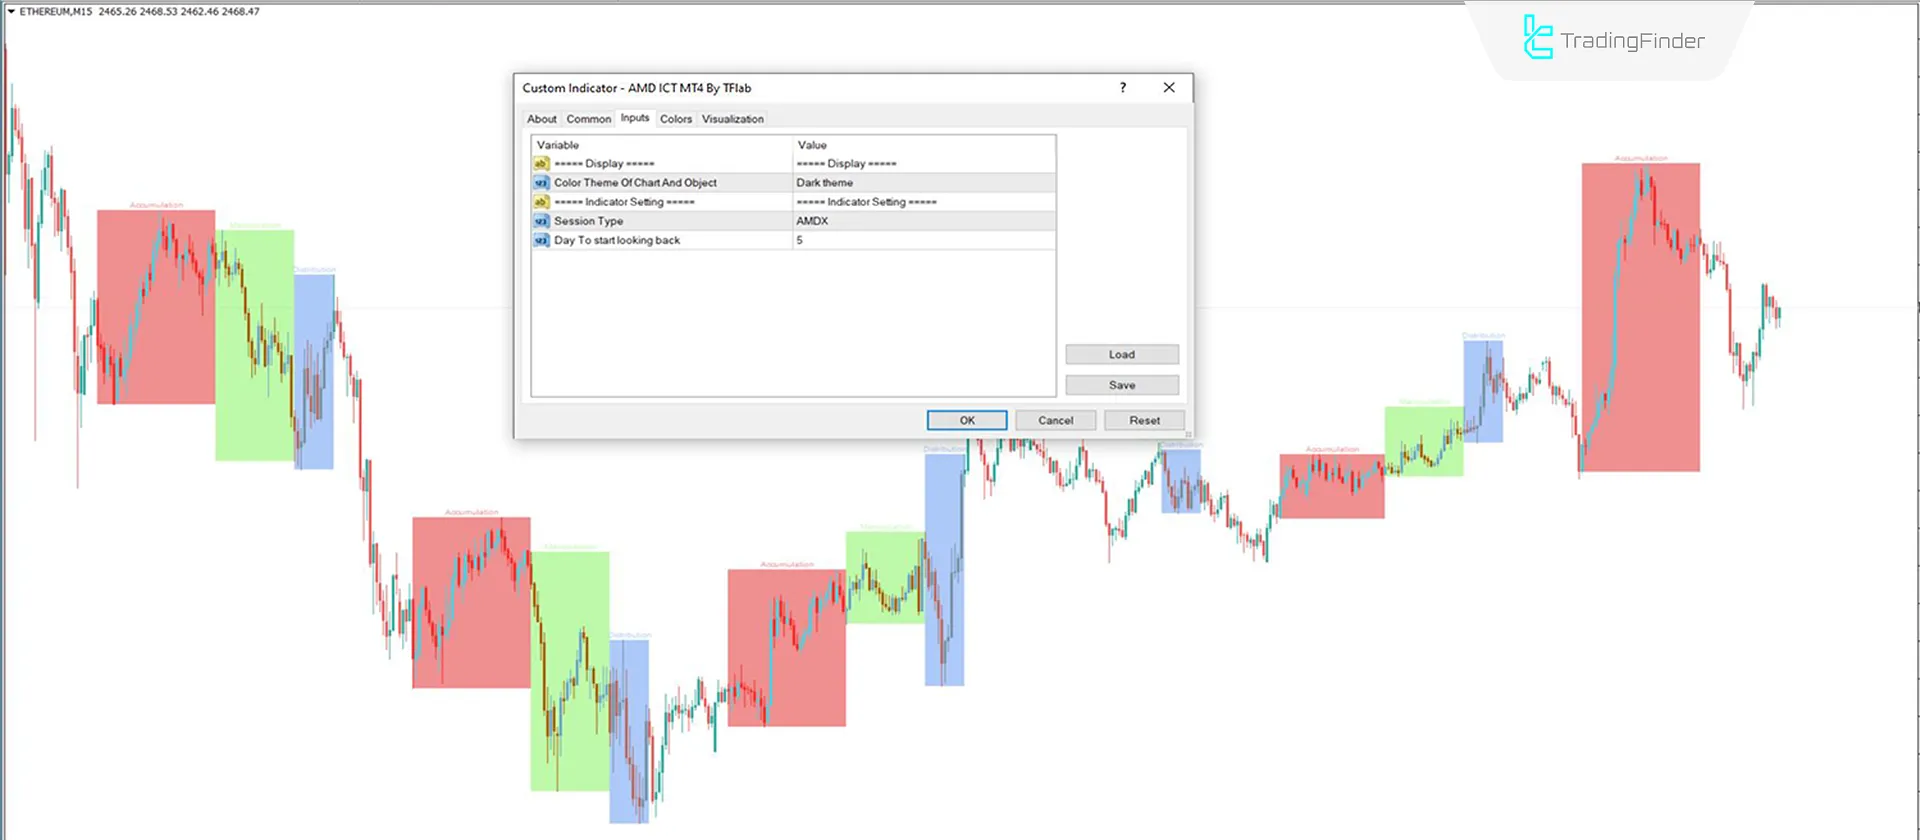
- Theme: Indicator Theme;
- Session Type: AMDX Session Type;
- Day to Start Looking Back: Desired number of days: 5.
Conclusion
The (AMD ICT) indicator is one of the ICT strategy indicators and determines the highs and lows of each trading session within the desired trading sessions. The indicator establishes accumulation, manipulation, and distribution zones by connecting these points.
By evaluating the strengths and weaknesses of hese zones, traders can identify trend reversal points and validate long and short trades.
the Accumulation Manipulation Distribution MT4 PDF
the Accumulation Manipulation Distribution MT4 PDF
Click to download the Accumulation Manipulation Distribution MT4 PDFDoes the (AMD ICT) indicator provide buy and sell signals?
No, this indicator does not provide entry signals for trades.
Does this indicator plot support and resistance zones on the chart?
No, the zones identified by this indicator represent sensitive points in price fluctuations that may trigger trend reversals.
Hi! I love your ICT Indicators, they are extremly helpful and clean. BUT: I hate it, when my own color options are overwritten with someone else's favorites. And I can't change this, I have to reset it in the options every time I use one of the indicators, even if I change the TF. (And yes: The color scheme "auto" does overwrite my options as well. Maybe "Custom" would help?) Thank you nevertheless for your great work and sorry for my complaint.
thank you. i will check it and forward it to our developer team,
Hello, thank you all for the lovely indicators!! I love this indicator just wondering if could add "custom" option to color theme of chart. Thank you all so much!!


