![Anti Butterfly Harmonic Pattern Indicator MT4 Download - [TFlab]](https://cdn.tradingfinder.com/image/362059/2-61-en-anti-butterfly-harmonic-pattern-mt4-1.webp)
![Anti Butterfly Harmonic Pattern Indicator MT4 Download - [TFlab] 0](https://cdn.tradingfinder.com/image/362059/2-61-en-anti-butterfly-harmonic-pattern-mt4-1.webp)
![Anti Butterfly Harmonic Pattern Indicator MT4 Download - [TFlab] 1](https://cdn.tradingfinder.com/image/362048/2-61-en-anti-butterfly-harmonic-pattern-mt4-2.webp)
![Anti Butterfly Harmonic Pattern Indicator MT4 Download - [TFlab] 2](https://cdn.tradingfinder.com/image/362062/2-61-en-anti-butterfly-harmonic-pattern-mt4-3.webp)
![Anti Butterfly Harmonic Pattern Indicator MT4 Download - [TFlab] 3](https://cdn.tradingfinder.com/image/362063/2-61-en-anti-butterfly-harmonic-pattern-mt4-4.webp)
On July 2, 2025, in version 2, alert/notification and signal functionality was added to this indicator
The Anti Butterfly Harmonic Pattern Indicator precisely identifies the pivotal points X, A, B, C, and D, automatically plotting the harmonic pattern structure on the chart.
The Anti Butterfly Harmonic Pattern Indicator highlights bullish patterns in red and bearish patterns in blue across different market trends.
Anti Butterfly Harmonic Pattern Specifications Table
The table below presents the key features of the Anti Butterfly Harmonic Pattern Indicator:
Indicator Categories: | Price Action MT4 Indicators Harmonic MT4 Indicators Candle Sticks MT4 Indicators |
Platforms: | MetaTrader 4 Indicators |
Trading Skills: | Intermediate |
Indicator Types: | Reversal MT4 Indicators |
Timeframe: | Multi-Timeframe MT4 Indicators |
Trading Style: | Intraday MT4 Indicators |
Trading Instruments: | Share Stocks MT4 Indicators Forward Market MT4 Indicators Indices Market MT4 Indicators Commodity Market MT4 Indicators Stock Market MT4 Indicators Cryptocurrency MT4 Indicators Forex MT4 Indicators |
Indicator Overview
The Anti Butterfly Harmonic Pattern Indicator consists of four primary waves: XA, AB, BC, and CD. Accurate detection of Fibonacci ratios for each wave is crucial. The structural features of the harmonic pattern waves are as follows:
- XA wave: The initial price movement;
- AB wave: A retracement of 38.2% to 61.8% of the XA wave;
- BC wave: A retracement of 38.2% to 88.6% of the AB wave;
- CD wave: An extension of the XA wave that typically exceeds 127.2% and may reach up to 161.8% or more.
The primary difference between the Anti Butterfly Harmonic Pattern and the classic Butterfly Pattern lies in the length of the CD wave and the associated Fibonacci ratios, which are visualized on the chart.
Uptrend Conditions
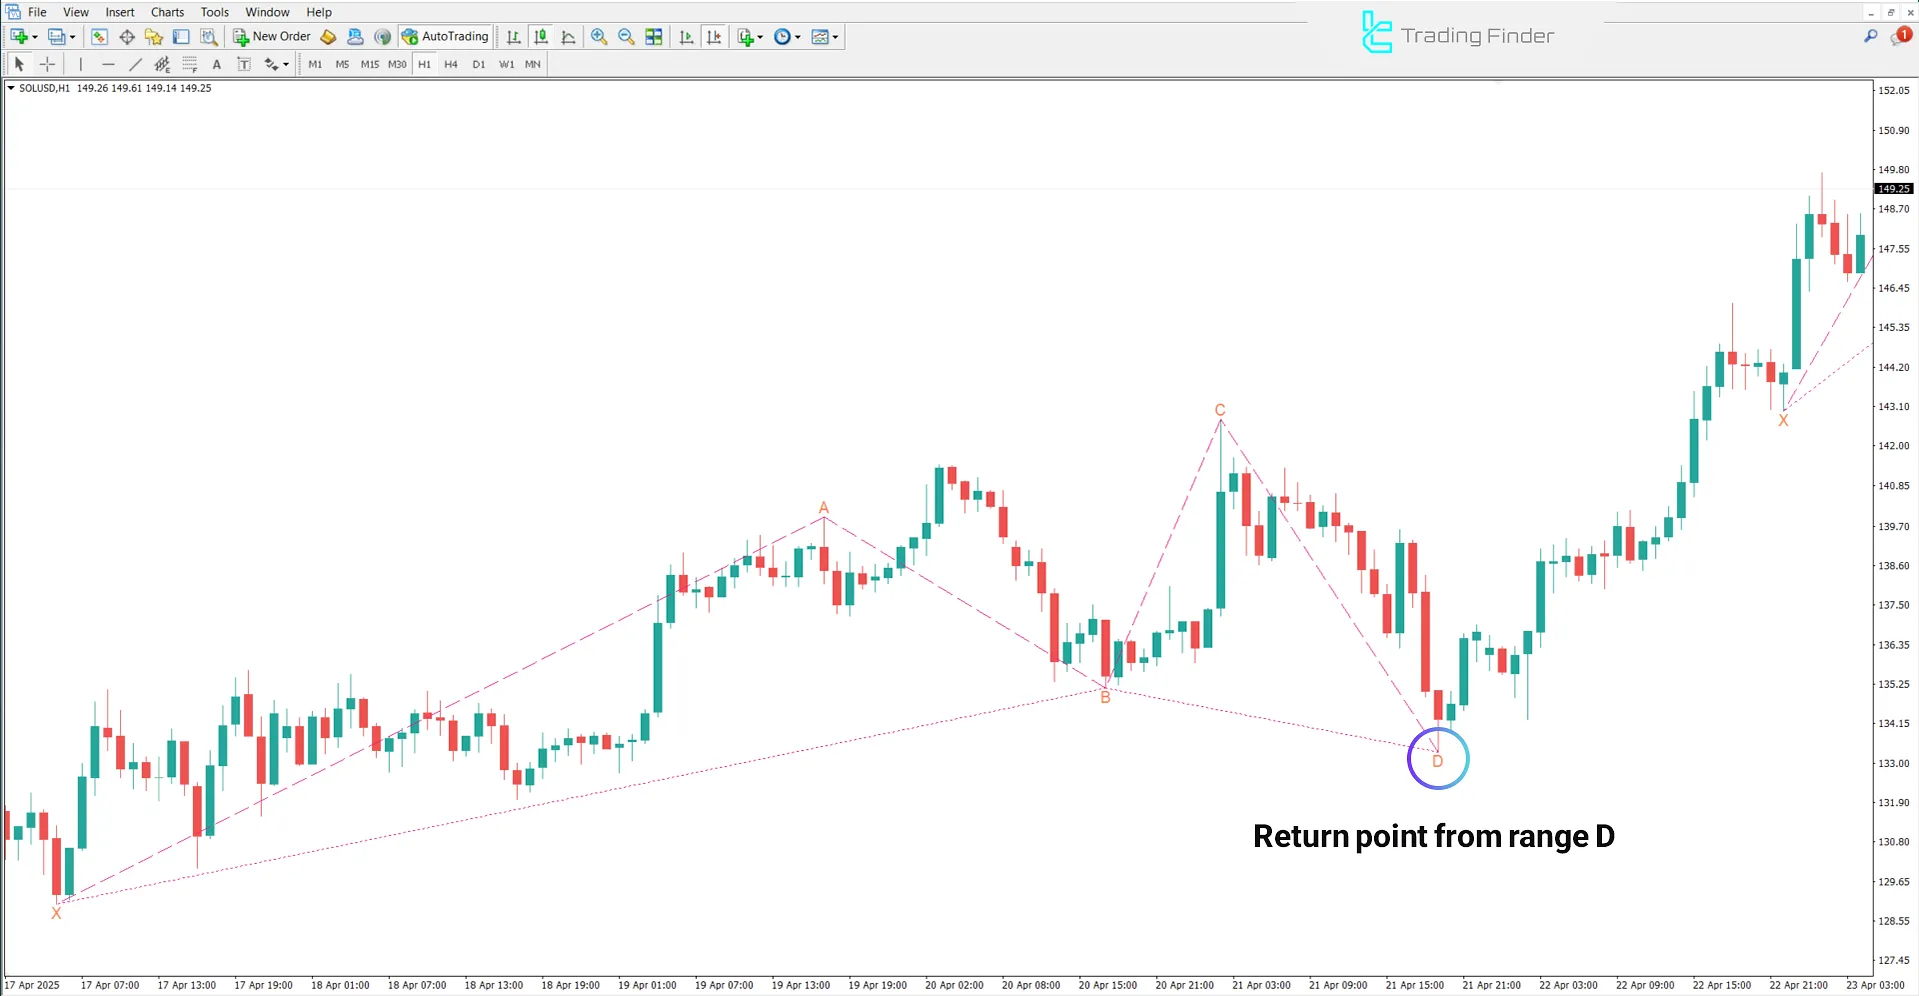
The chart below shows the SOL/USD (Solana) pair in the 1-hour timeframe. The indicator detects a bearish Anti-Butterfly pattern, identifies point D as the Potential Reversal Zone (PRZ), and generates a buy signal.

Downtrend Conditions
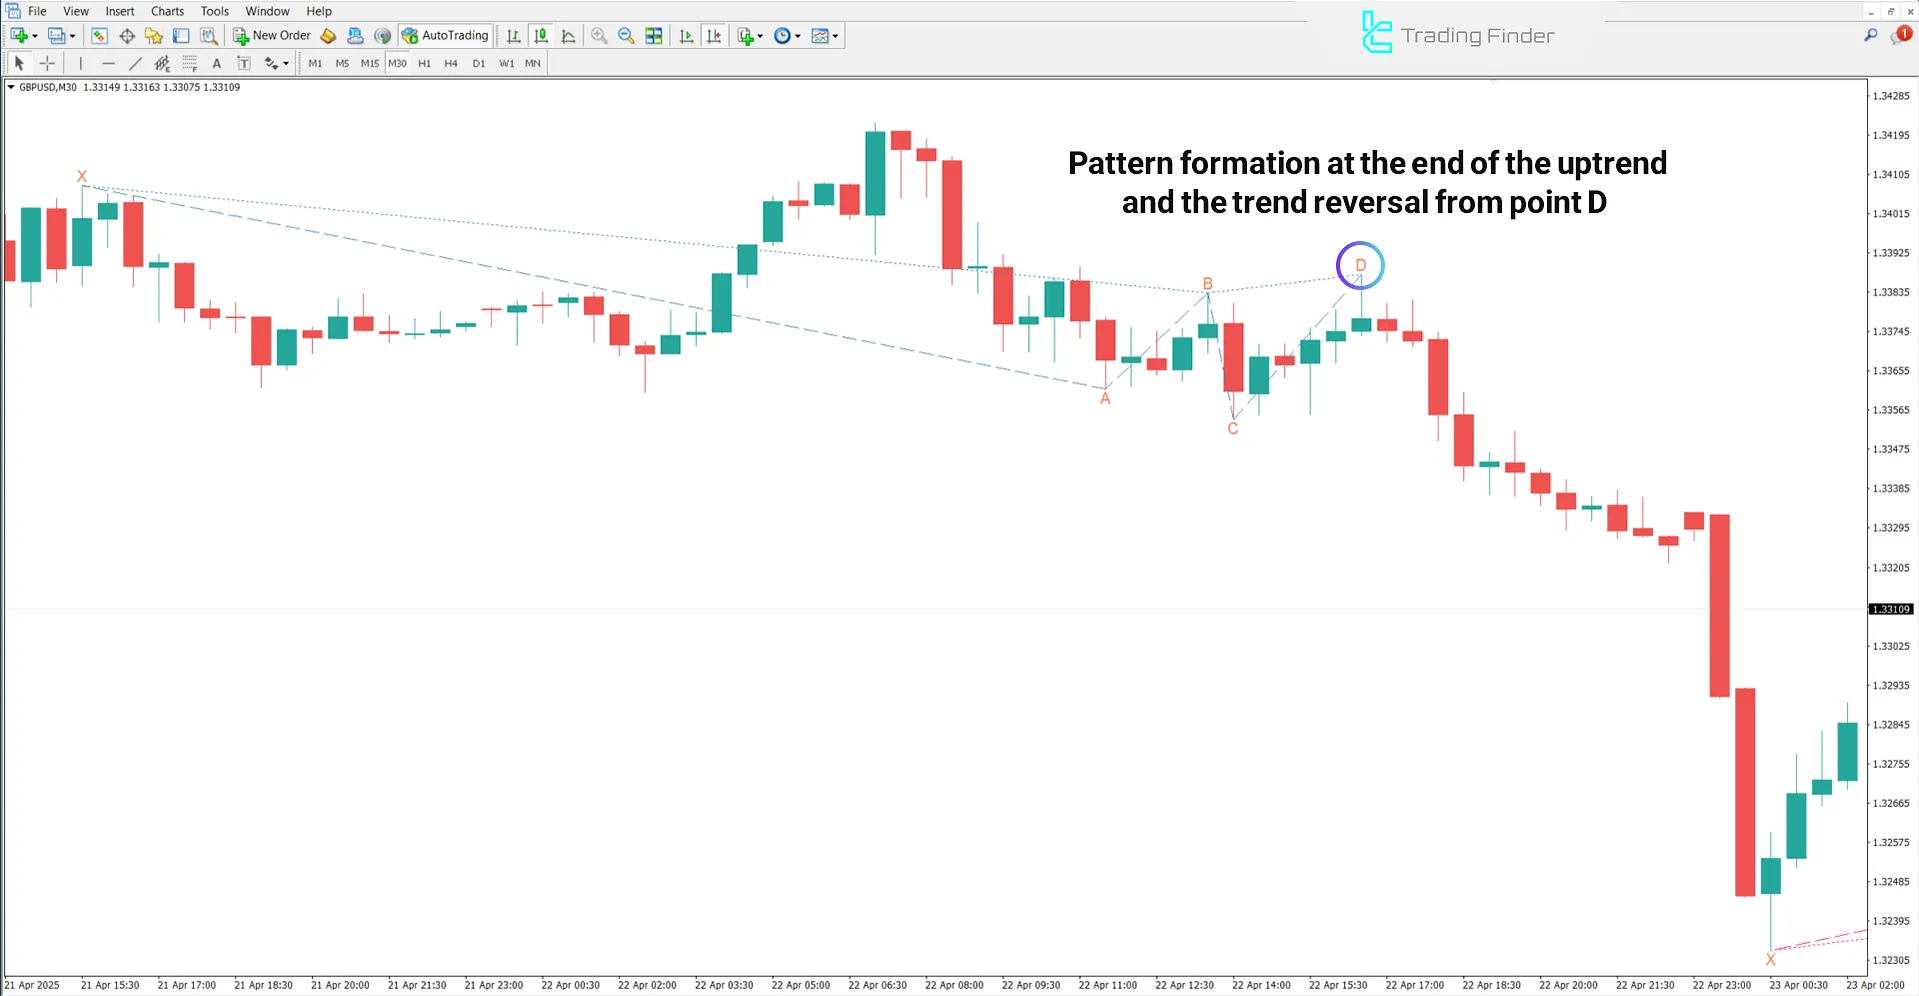
The following chart shows the GBP/USD pair in a 30-minute timeframe. In this case, the indicator identifies an Anti Butterfly Harmonic Pattern forming at the market top, with point D signaling an entry for sell positions.

Indicator Settings
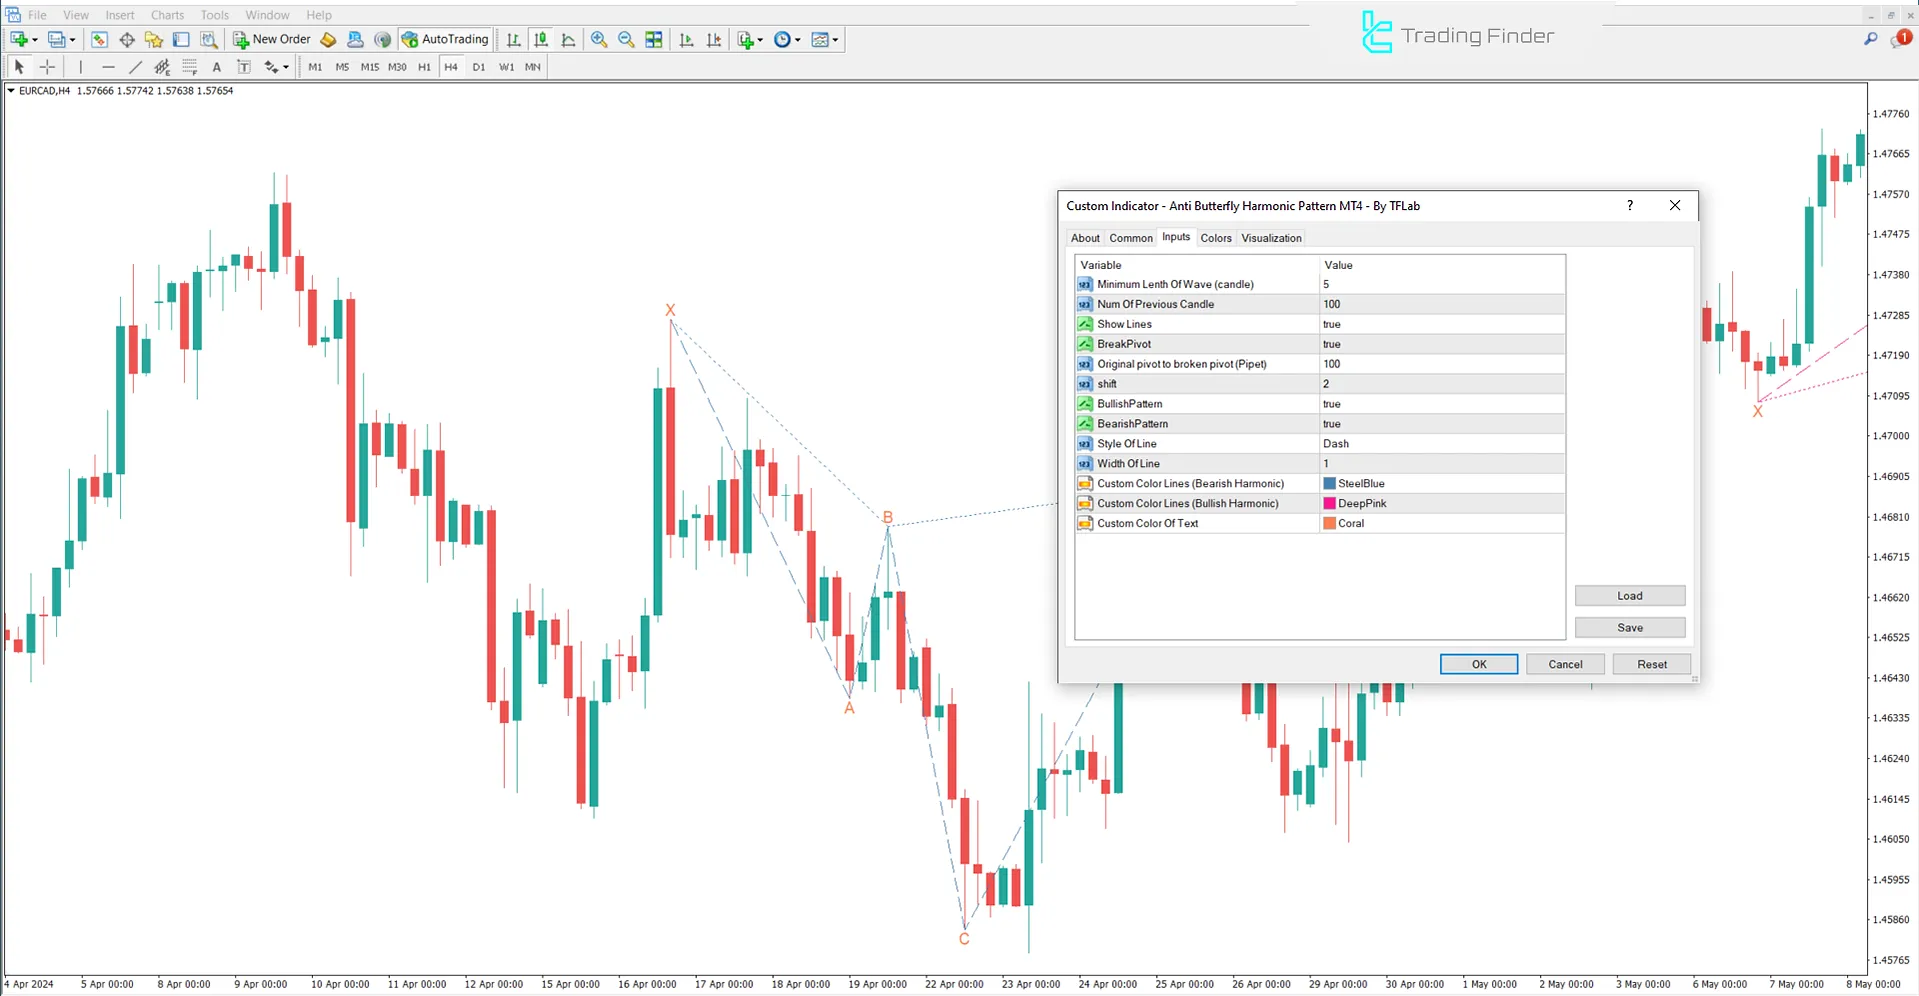
The image below displays the settings panel of the Anti Butterfly Harmonic Pattern Indicator:

- Minimum Length Of Wave (candle): Minimum wavelength (measured in candles)
- Num Of Previous Candle: Number of previous candles analyzed
- Show Lines: Display pattern lines
- BreakPivot: Display Break pivot
- Original pivot to broken pivot (Pipet): Distance from original pivot to broken pivot
- Shift: Amount of horizontal shift
- Bullish Pattern: Display bullish patterns
- Bearish Pattern: Display bearish patterns
- Style Of Line: Line style
- Width Of Line: Line thickness
- Custom Color Lines (Bearish Harmonic): Custom color for bearish harmonic pattern lines
- Custom Color Lines (Bullish Harmonic): Custom color for bullish harmonic pattern lines
- Custom Color Of Text: Text color for annotations
Conclusion
The Anti-Butterfly Harmonic Pattern Indicator is valuable for identifying harmonic patterns and price reversal points in financial markets such as cryptocurrencies, Forex, and commodities.
This indicator accurately identifies entry and exit points by utilizing Fibonacci ratios and distinct geometric structures.
Anti Butterfly Harmonic Pattern MT4 PDF
Anti Butterfly Harmonic Pattern MT4 PDF
Click to download Anti Butterfly Harmonic Pattern MT4 PDFIs the Anti Butterfly Harmonic Pattern Indicator usable across all timeframes?
The Anti-Butterfly Harmonic Pattern Indicator can be applied to various timeframes, from minutes to weekly charts.
How are entry signals generated?
Entry signals are generated when the price reaches point D, prompting the indicator to issue a buy or sell signal based on the identified pattern.


