


![Anti-Gartley Harmonic Pattern Indicator in MT4 – [TradingFinder]](https://cdn.tradingfinder.com/image/365307/11-83-en-anti-gartley-harmonic-pattern-mt4-01.webp)
![Anti-Gartley Harmonic Pattern Indicator in MT4 – [TradingFinder] 1](https://cdn.tradingfinder.com/image/365305/11-83-en-anti-gartley-harmonic-pattern-mt4-02.webp)
![Anti-Gartley Harmonic Pattern Indicator in MT4 – [TradingFinder] 2](https://cdn.tradingfinder.com/image/365306/11-83-en-anti-gartley-harmonic-pattern-mt4-03.webp)
![Anti-Gartley Harmonic Pattern Indicator in MT4 – [TradingFinder] 3](https://cdn.tradingfinder.com/image/365308/11-83-en-anti-gartley-harmonic-pattern-mt4-04.webp)
On July 2, 2025, in version 2, alert/notification and signal functionality was added to this indicator
The Anti-Gartley Harmonic Pattern indicator is considered a practical analytical tool in the MetaTrader 4 environment designed to identify the structure of harmonic patterns.
This indicator detects the Anti-Gartley harmonic pattern by determining five key points (pivots) on the chart and displays it by drawing specific lines.
Users can identify bullish and bearish patterns by combining this indicator with technical analysis, performing more specialized and professional analyses on the price chart.
Anti-Gartley Harmonic Pattern Indicator Table
The general specifications of the Anti-Gartley Harmonic Pattern indicator are listed in the section below.
Indicator Categories: | Price Action MT4 Indicators Chart & Classic MT4 Indicators Harmonic MT4 Indicators |
Platforms: | MetaTrader 4 Indicators |
Trading Skills: | Advanced |
Indicator Types: | Leading MT4 Indicators Reversal MT4 Indicators Non-Repainting MT4 Indicators |
Timeframe: | Multi-Timeframe MT4 Indicators |
Trading Style: | Day Trading MT4 Indicators Intraday MT4 Indicators Scalper MT4 Indicators |
Trading Instruments: | Share Stocks MT4 Indicators Indices Market MT4 Indicators Stock Market MT4 Indicators Forex MT4 Indicators |
Indicator at a Glance
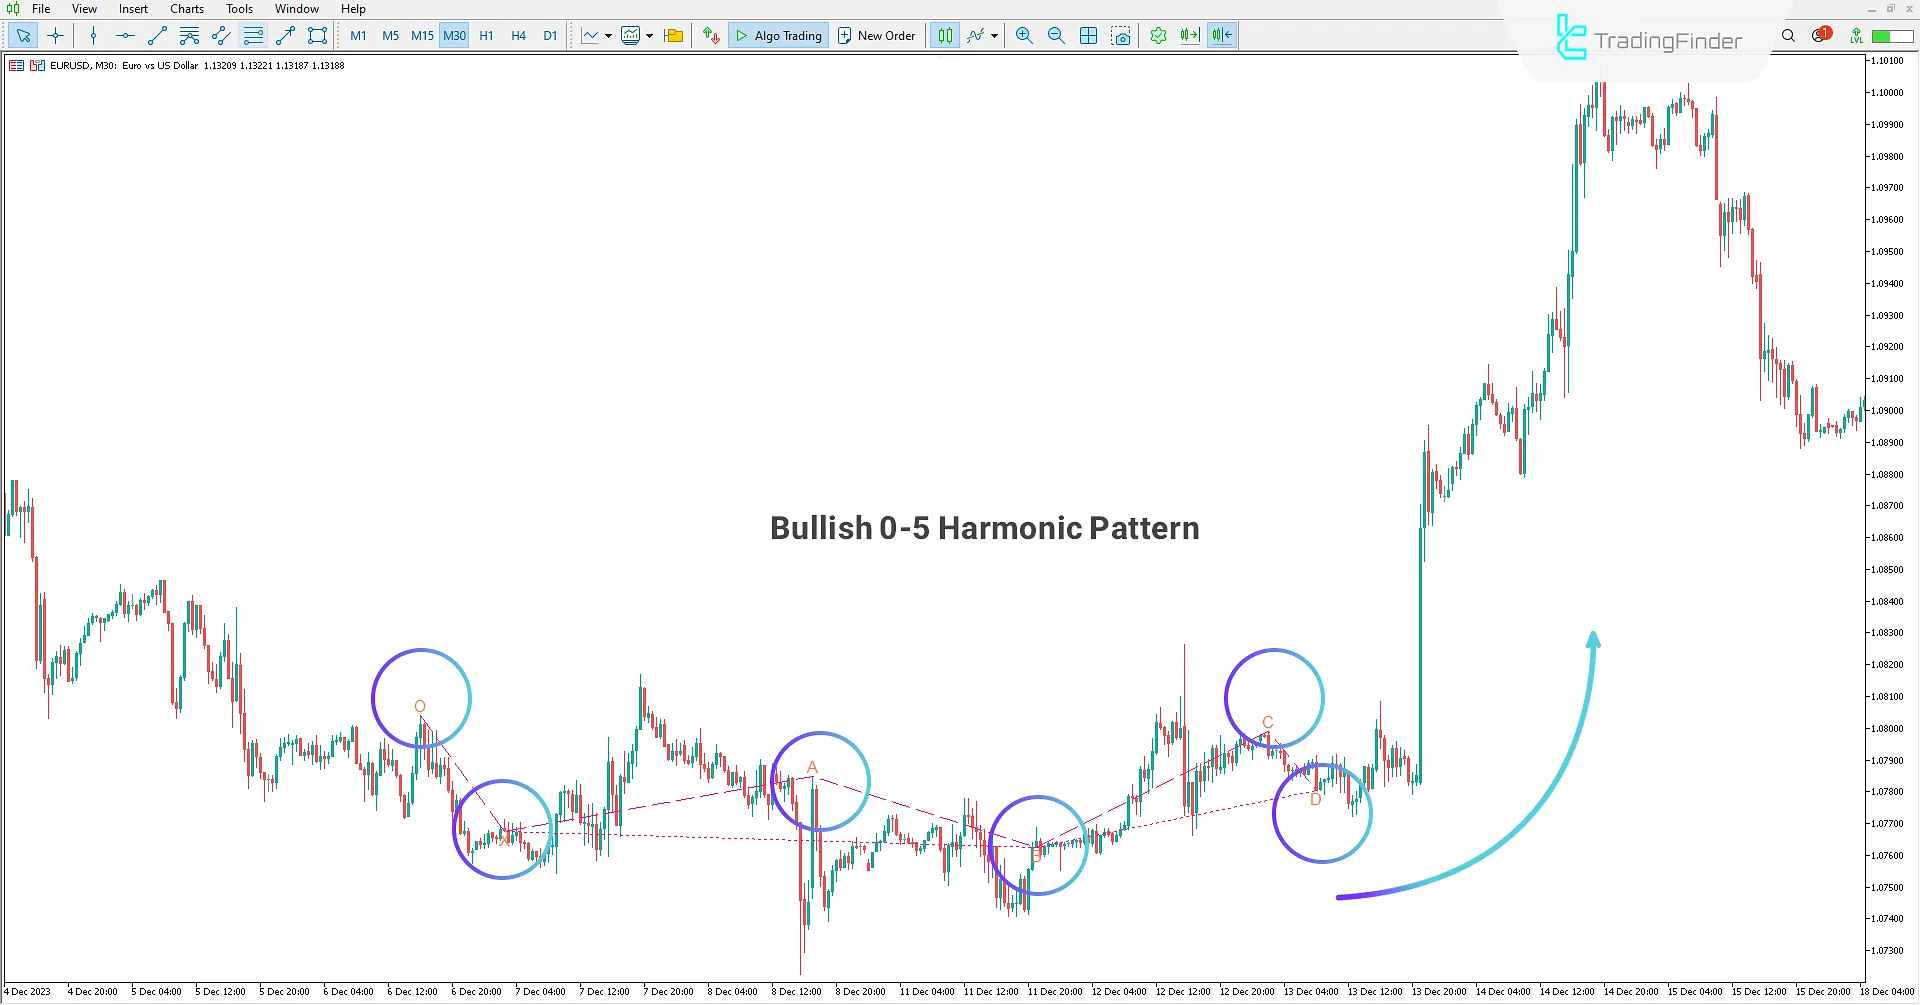
The Anti-Gartley Harmonic Pattern indicator accurately draws the Anti-Gartley harmonic pattern on the chart by precisely identifying points X, A, B, C, and D and connecting them through lines. This professional tool enables traders to correctly identify potential trading entry points, recognize price reversal areas (PRZ), and make more precise decisions in the market.
Bullish Pattern
On the 30-minute chart of the USDJPY currency pair, a bullish Anti-Gartley harmonic pattern has formed.
Traders looking to identify this type of pattern on the price chart can detect the formation of this pattern using the Anti-Gartley Harmonic Pattern indicator and enter a buy trade by observing point D as the potential price reversal area (PRZ).
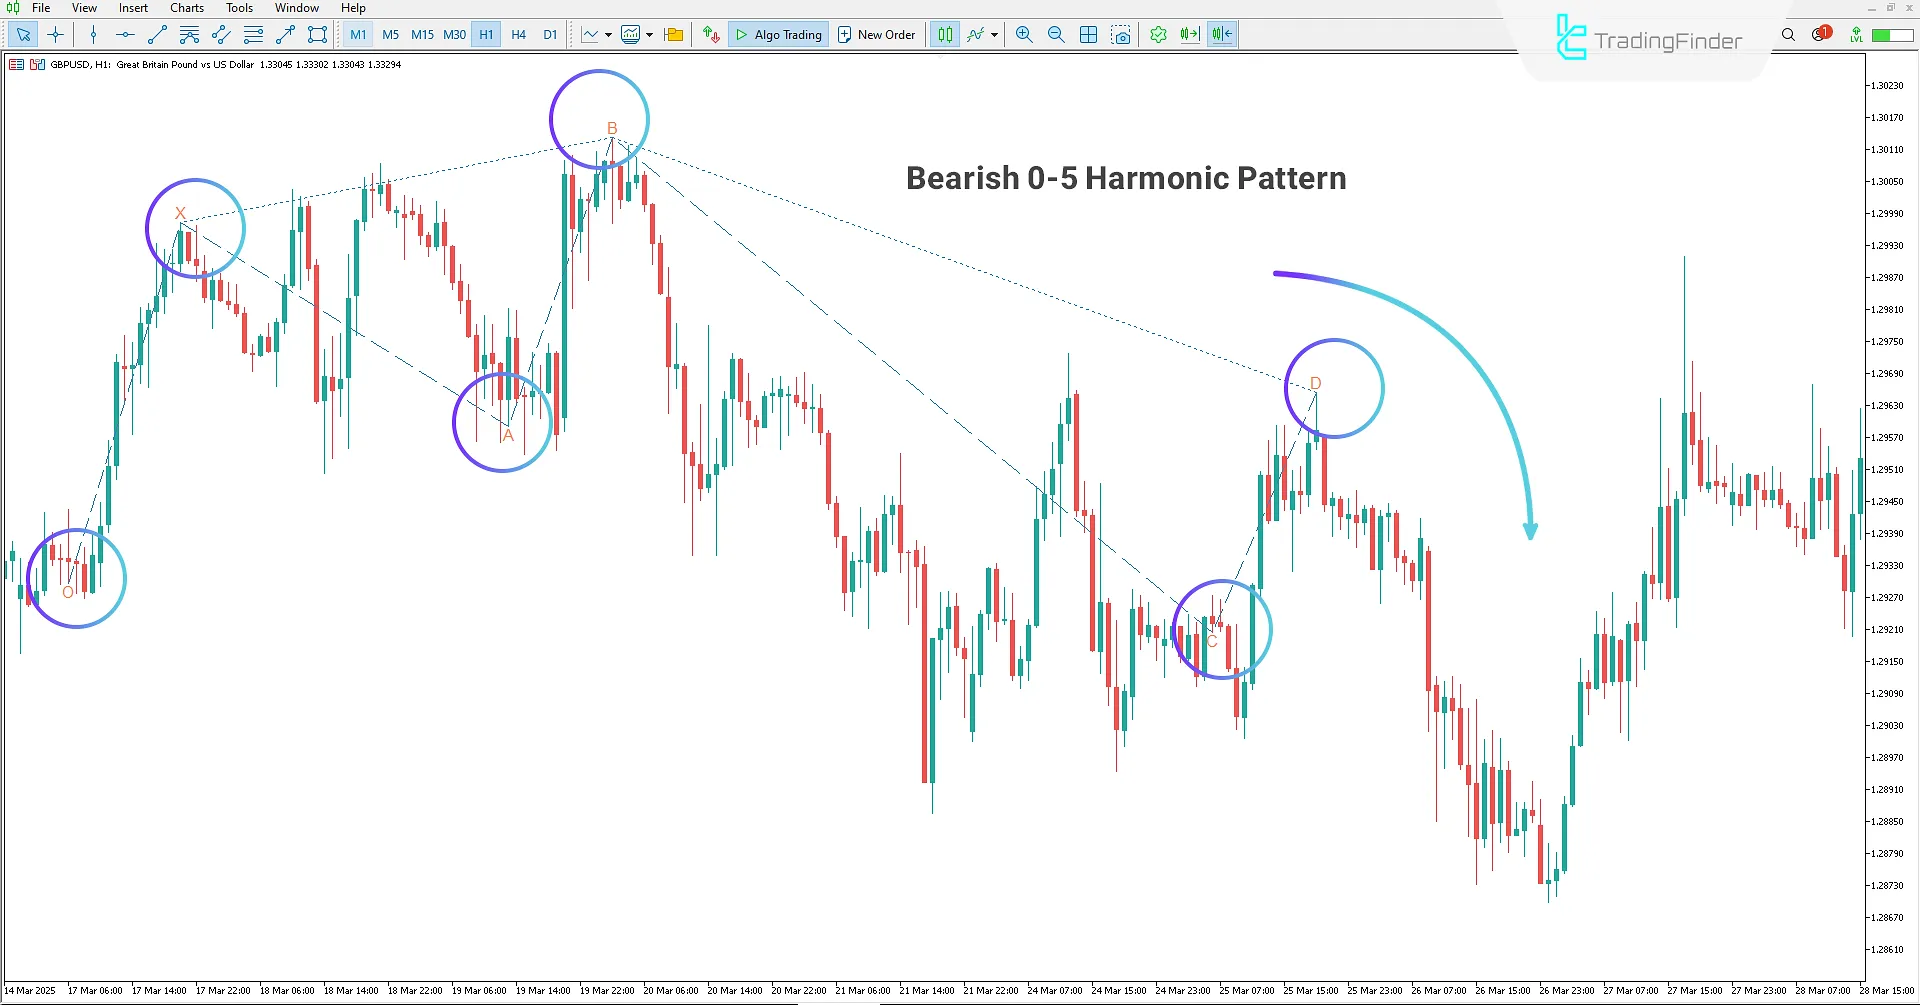
Bearish Pattern
On the 4-hour GBPUSD chart, the Anti-Gartley Harmonic Pattern indicator has displayed a sell trading position by identifying and drawing a bearish Anti-Gartley pattern on the chart.
Traders looking to identify this pattern on the price chart can use this indicator to identify a suitable entry point for selling and enter a trade.
Anti-Gartley Harmonic Pattern Indicator Settings
The settings for the Anti-Gartley Harmonic Pattern indicator are provided in the section below.
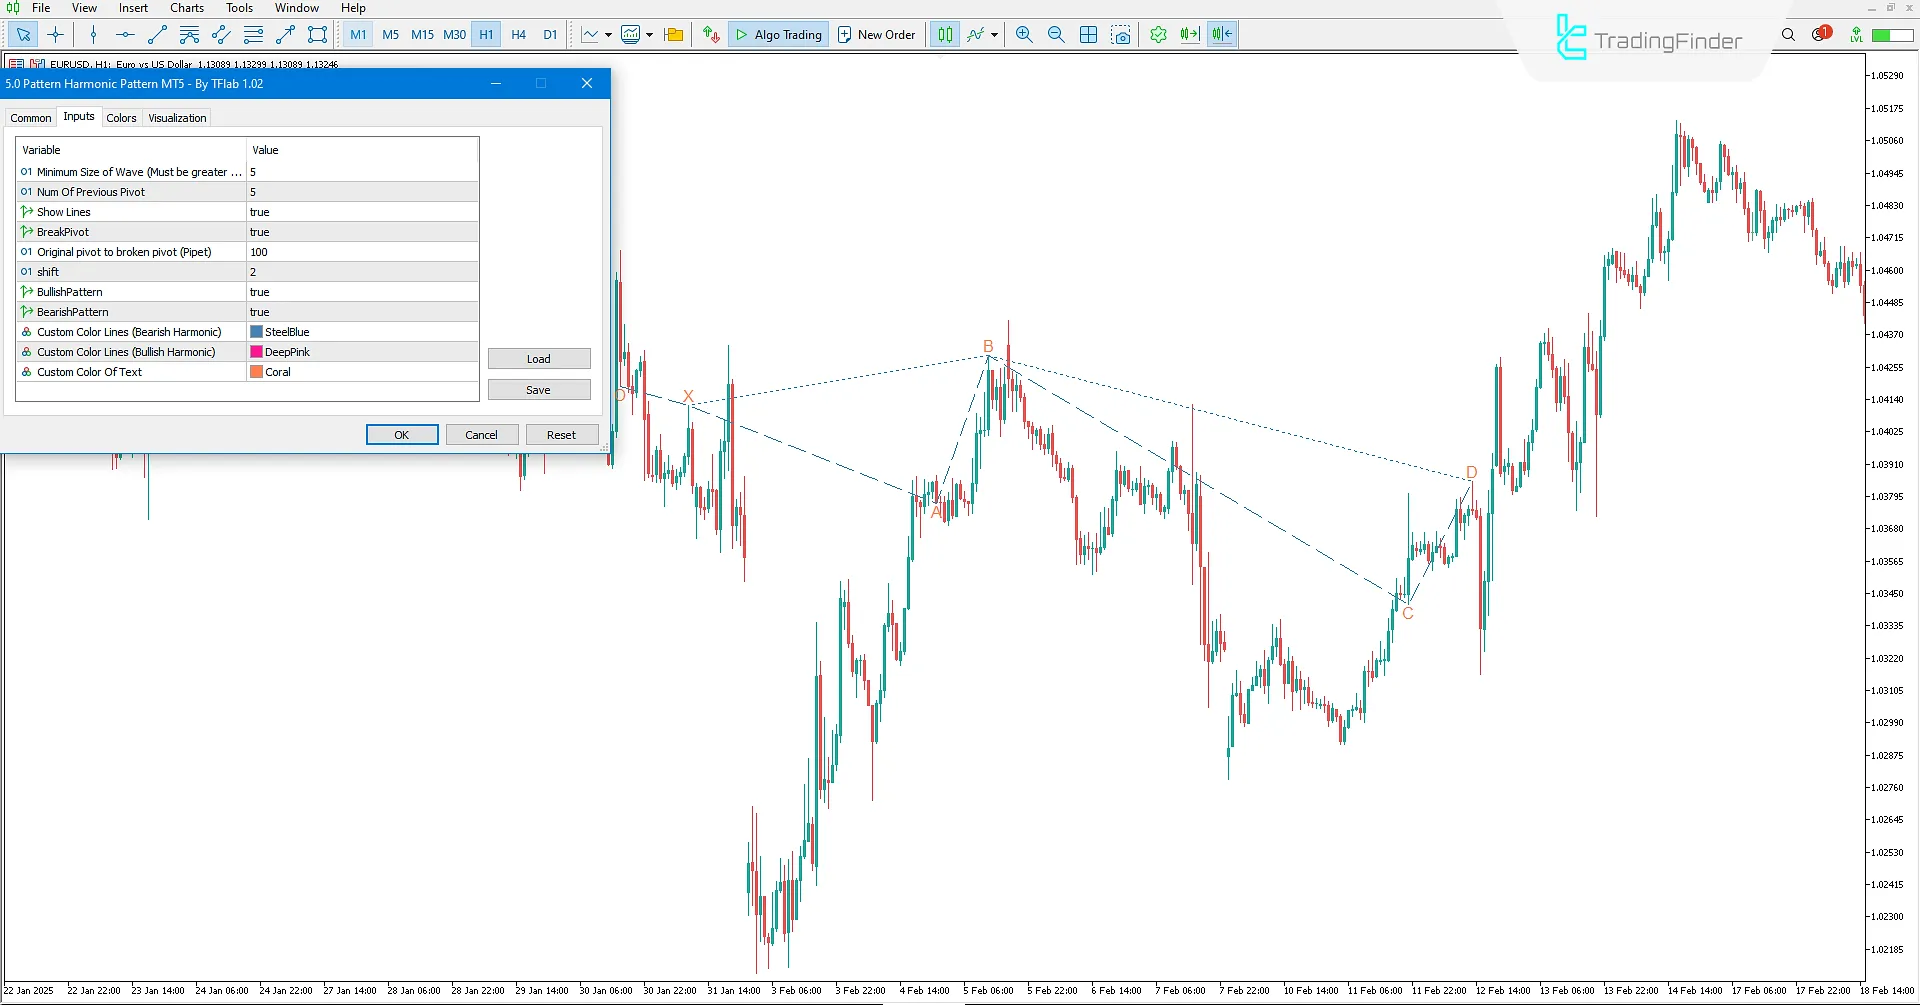
- Minimum Length Of Wave (candle): Select the minimum length of a wave (in terms of the number of candles);
- Num Of Previous Candle: Select the number of previous candles to examine the market;
- Show Lines: Select whether to display pattern lines;
- Break Pivot: Select whether to check for pivot breakouts;
- Original pivot to broken pivot (Pipet): Select the distance (in pipettes) between the original pivot and the broken pivot;
- Shift: Select the horizontal shift of the lines;
- Bullish Pattern: Select whether to display bullish patterns;
- Bearish Pattern: Select whether to display bearish patterns;
- Style Of Line: Select the line type;
- Width Of Line: Select the width of the lines;
- Custom Color Lines (Bearish Harmonic): Select the color for bearish harmonic pattern lines;
- Custom Color Lines (Bullish Harmonic): Select the color for bullish harmonic pattern lines;
- Custom Color Of Text: Select the color for the explanatory text on the chart.
Conclusion
The Anti-Gartley Harmonic Pattern indicator is known as an advanced trading strategy in the Forex market that is useful for traders to better understand the price market structure by drawing the Anti-Gartley harmonic pattern.
This tool provides ideal conditions for entering buy or sell positions by identifying the pattern and displaying potential price reversal areas (PRZ).
Using this indicator can improve trading performance and strengthen traders' analytical view regarding reversal points.
Anti-Gartley Harmonic Pattern MT4 PDF
Anti-Gartley Harmonic Pattern MT4 PDF
Click to download Anti-Gartley Harmonic Pattern MT4 PDFWhat is the Anti-Gartley Harmonic Pattern indicator?
This indicator is one of the specialized tools in technical analysis designed to identify the Anti-Gartley harmonic pattern on the price chart and can be used on the MetaTrader 4 platform.
How does the Anti-Gartley Harmonic Pattern indicator work?
It automatically draws the Anti-Gartley pattern on the chart by identifying five key points (X, A, B, C, D) and drawing the connecting lines between them. It also specifies the potential price reversal areas (PRZ), which are very suitable for entering or exiting trades.


