![ATR Filter Oscillator MT4 Download – Free – [TradingFinder]](https://cdn.tradingfinder.com/image/442351/13-161-en-atr-filter-mt4-01.webp)
![ATR Filter Oscillator MT4 Download – Free – [TradingFinder] 0](https://cdn.tradingfinder.com/image/442351/13-161-en-atr-filter-mt4-01.webp)
![ATR Filter Oscillator MT4 Download – Free – [TradingFinder] 1](https://cdn.tradingfinder.com/image/442350/13-161-en-atr-filter-mt4-02.webp)
![ATR Filter Oscillator MT4 Download – Free – [TradingFinder] 2](https://cdn.tradingfinder.com/image/442349/13-161-en-atr-filter-mt4-03.webp)
![ATR Filter Oscillator MT4 Download – Free – [TradingFinder] 3](https://cdn.tradingfinder.com/image/442382/13-161-en-atr-filter-mt4-04.webp)
The ATR Filter Indicator is designed to filter out market noise and provide accurate signals for buying and selling. This oscillator combines two key concepts Average True Range (ATR) and Moving Average (MA) to measure market volatility.
ATR Filter Oscillator Specifications Table
The table below presents the features of the ATR Filter Indicator.
|
Indicator Categories:
|
Oscillators MT4 Indicators
Volatility MT4 Indicators
Trading Assist MT4 Indicators
|
|
Platforms:
|
MetaTrader 4 Indicators
|
|
Trading Skills:
|
Elementary
|
|
Indicator Types:
|
Reversal MT4 Indicators
|
|
Timeframe:
|
Multi-Timeframe MT4 Indicators
|
|
Trading Style:
|
Day Trading MT4 Indicators
Scalper MT4 Indicators
Swing Trading MT4 Indicators
|
|
Trading Instruments:
|
Stock Market MT4 Indicators
Cryptocurrency MT4 Indicators
Forex MT4 Indicators
|
ATR Filter Indicator at a Glance
The ATR Filter Oscillator first calculates the ATR over a specific period and then applies a moving average to it.
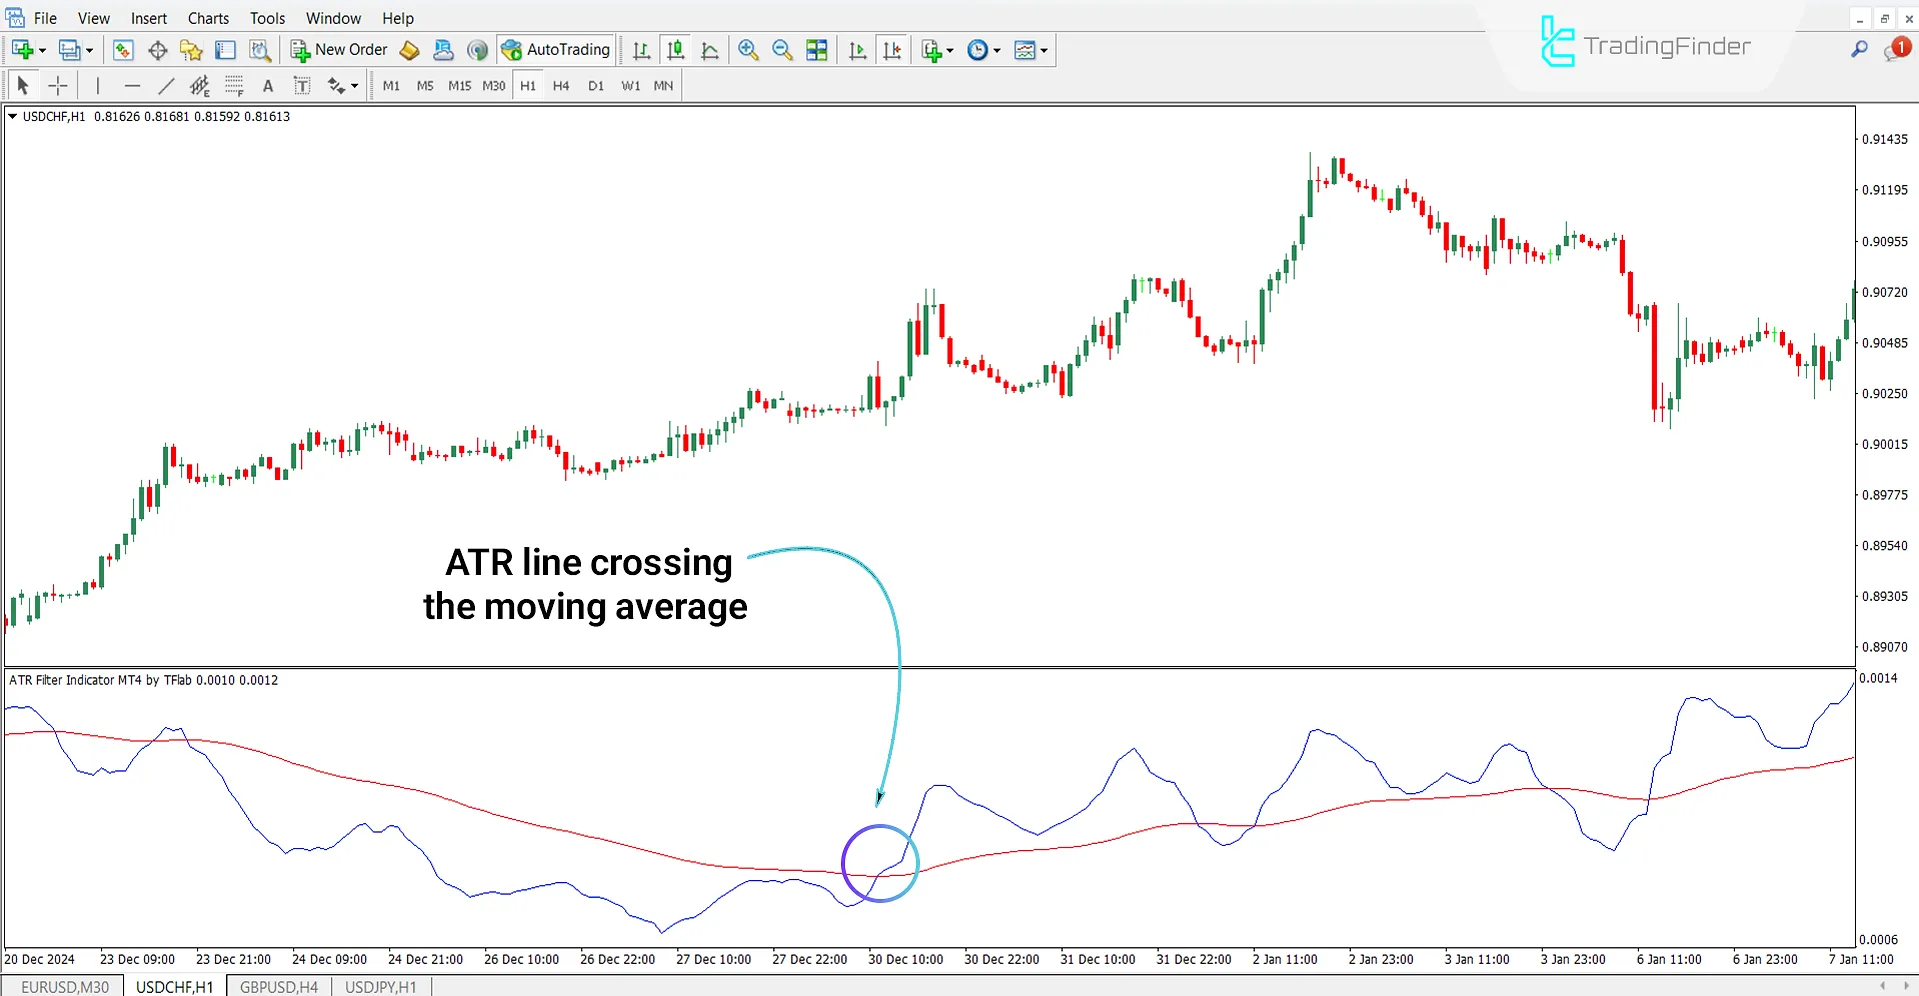
For example, if the ATR line crosses above the moving average, it can be interpreted as a bullish movement. Conversely, if the ATR line moves below the moving average, it indicates bearish momentum.
Bullish Trend
According to the analysis of the USD/CHF chart on the 1-hour timeframe, the blue line (ATR) has crossed below the moving average. This condition indicates a strong bullish trend, and the crossover point can serve as an ideal entry point for buy trades.

Bearish Trend
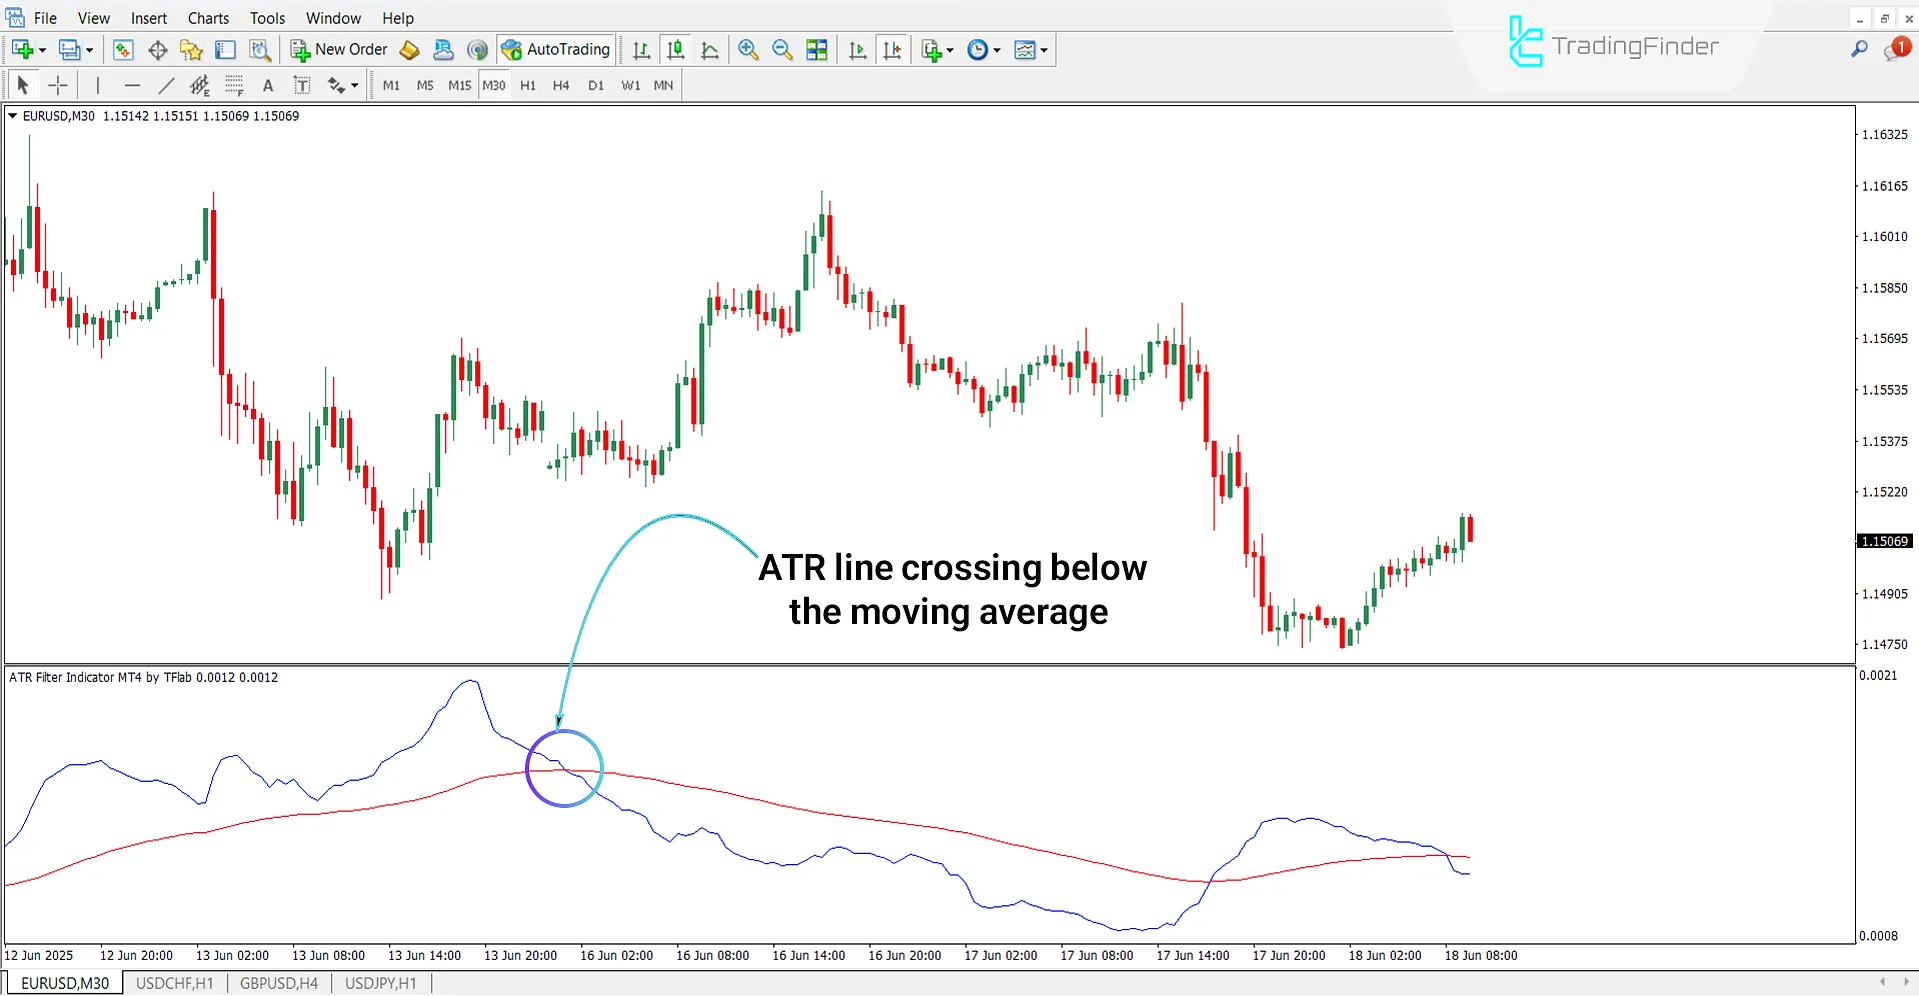
The EUR/USD currency pair chart on the 30-minute timeframe demonstrates the ATR Filter Indicator’s performance in a bearish trend.
As shown, the ATR line (blue) crosses below the moving average (red) and oscillates beneath it. In such conditions, the main market movement can be considered bearish.

ATR Filter Indicator Settings
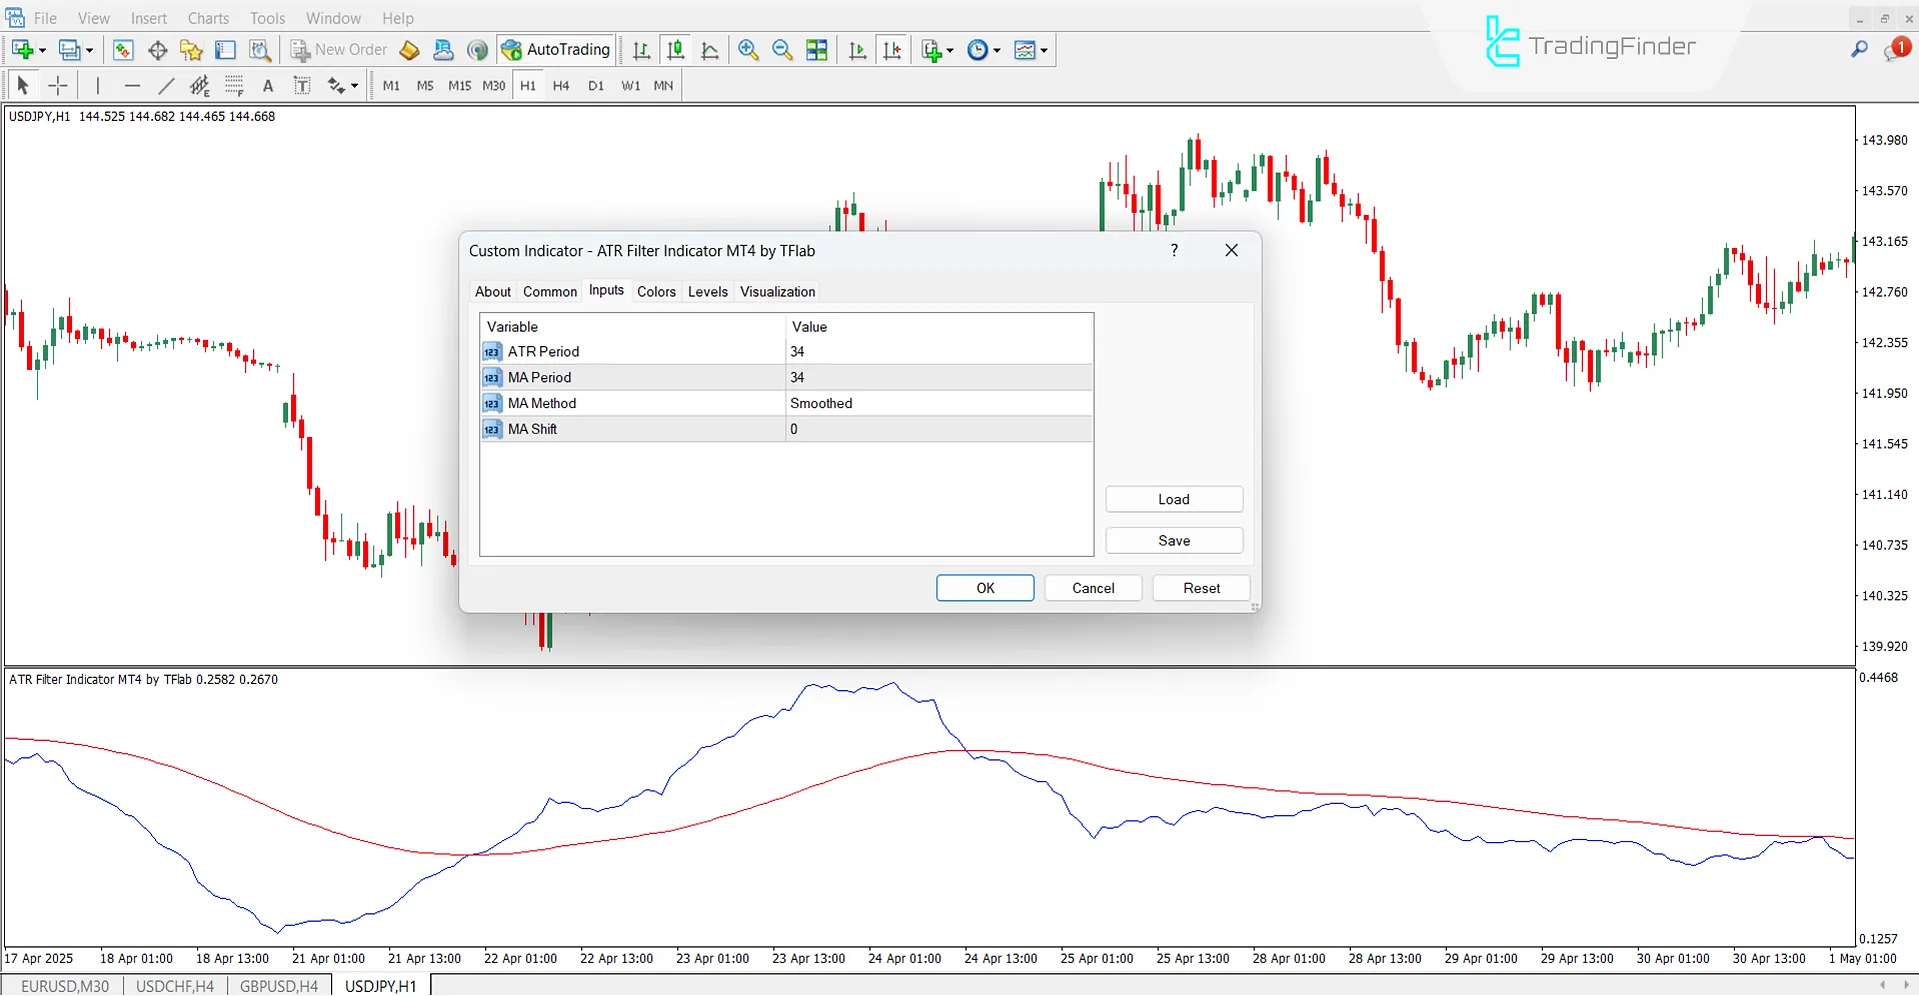
The following parameters are adjustable in the ATR Filter Oscillator:

- ATR Period: The period for calculating the ATR value
- MA Period: Number of candles used to calculate the moving average
- MA Method: Type of moving average
- MA Shift: The shift value applied to the moving average line
Conclusion
The ATR Filter Indicator, by using the ATR volatility index combined with a moving average filter, identifies real market conditions and eliminates noise.
This tool only generates signals when volatility is strong, resulting in more accurate analysis and fewer false entries. It can effectively optimize trading strategies in volatile markets.
ATR Filter Oscillator MT4 PDF
ATR Filter Oscillator MT4 PDF
Click to download ATR Filter Oscillator MT4 PDFWhat is the basis of the ATR Filter Oscillator’s functionality?
This indicator first measures market volatility using ATR and then filters out weak signals through a moving average.
Is this indicator limited to the Forex market?
No, the ATR Filter Indicator can also be used in cryptocurrency, stocks, and commodities markets, not just Forex.


