![ATR XH Volume Indicator for MetaTrader 4 Download - Free - [TFlab]](https://cdn.tradingfinder.com/image/244168/4-49-en-atr-xh-volume-mt4-1.webp)
![ATR XH Volume Indicator for MetaTrader 4 Download - Free - [TFlab] 0](https://cdn.tradingfinder.com/image/244168/4-49-en-atr-xh-volume-mt4-1.webp)
![ATR XH Volume Indicator for MetaTrader 4 Download - Free - [TFlab] 1](https://cdn.tradingfinder.com/image/244135/4-49-en-atr-xh-volume-mt4-2.webp)
![ATR XH Volume Indicator for MetaTrader 4 Download - Free - [TFlab] 2](https://cdn.tradingfinder.com/image/244146/4-49-en-atr-xh-volume-mt4-3.webp)
![ATR XH Volume Indicator for MetaTrader 4 Download - Free - [TFlab] 3](https://cdn.tradingfinder.com/image/244147/4-49-en-atr-xh-volume-mt4-4.webp)
The ATR XH Volume Indicator in MetaTrader 4 indicators combines the Average True Range (ATR) with trading volume and displays their changes simultaneously.
This indicator is used for analyzing market conditions and identifying strong trends or low-volatility periods.
The ATR line in this indicator is displayed in orange. Using additional divergence tools like the PAFX Secret Indicator, along with verifying key divergences, traders can gain more confidence in entry zones.
ATR XH Volume Indicator Specifications
The table below summarizes the features of this indicator.
Indicator Categories: | Oscillators MT4 Indicators Volatility MT4 Indicators Trading Assist MT4 Indicators |
Platforms: | MetaTrader 4 Indicators |
Trading Skills: | Intermediate |
Indicator Types: | Range MT4 Indicators Reversal MT4 Indicators |
Timeframe: | Multi-Timeframe MT4 Indicators |
Trading Style: | Intraday MT4 Indicators |
Trading Instruments: | Stock Market MT4 Indicators Cryptocurrency MT4 Indicators Forex MT4 Indicators |
Overview of the Indicator
The ATR XH Volume Indicator, by simultaneously displaying ATR fluctuations and trading volumes, allows traders to easily identify strong trends and periods of low volatility.
- An increase in both volume and ATR is a sign of continued market momentum in the same direction
- Conversely, a decrease in both volume and ATR reflects the start of low-activity or range-bound periods
Lastly, an increase in volume coupled with a decline in ATR can indicate weakness in trend continuation
Indicator in an Uptrend
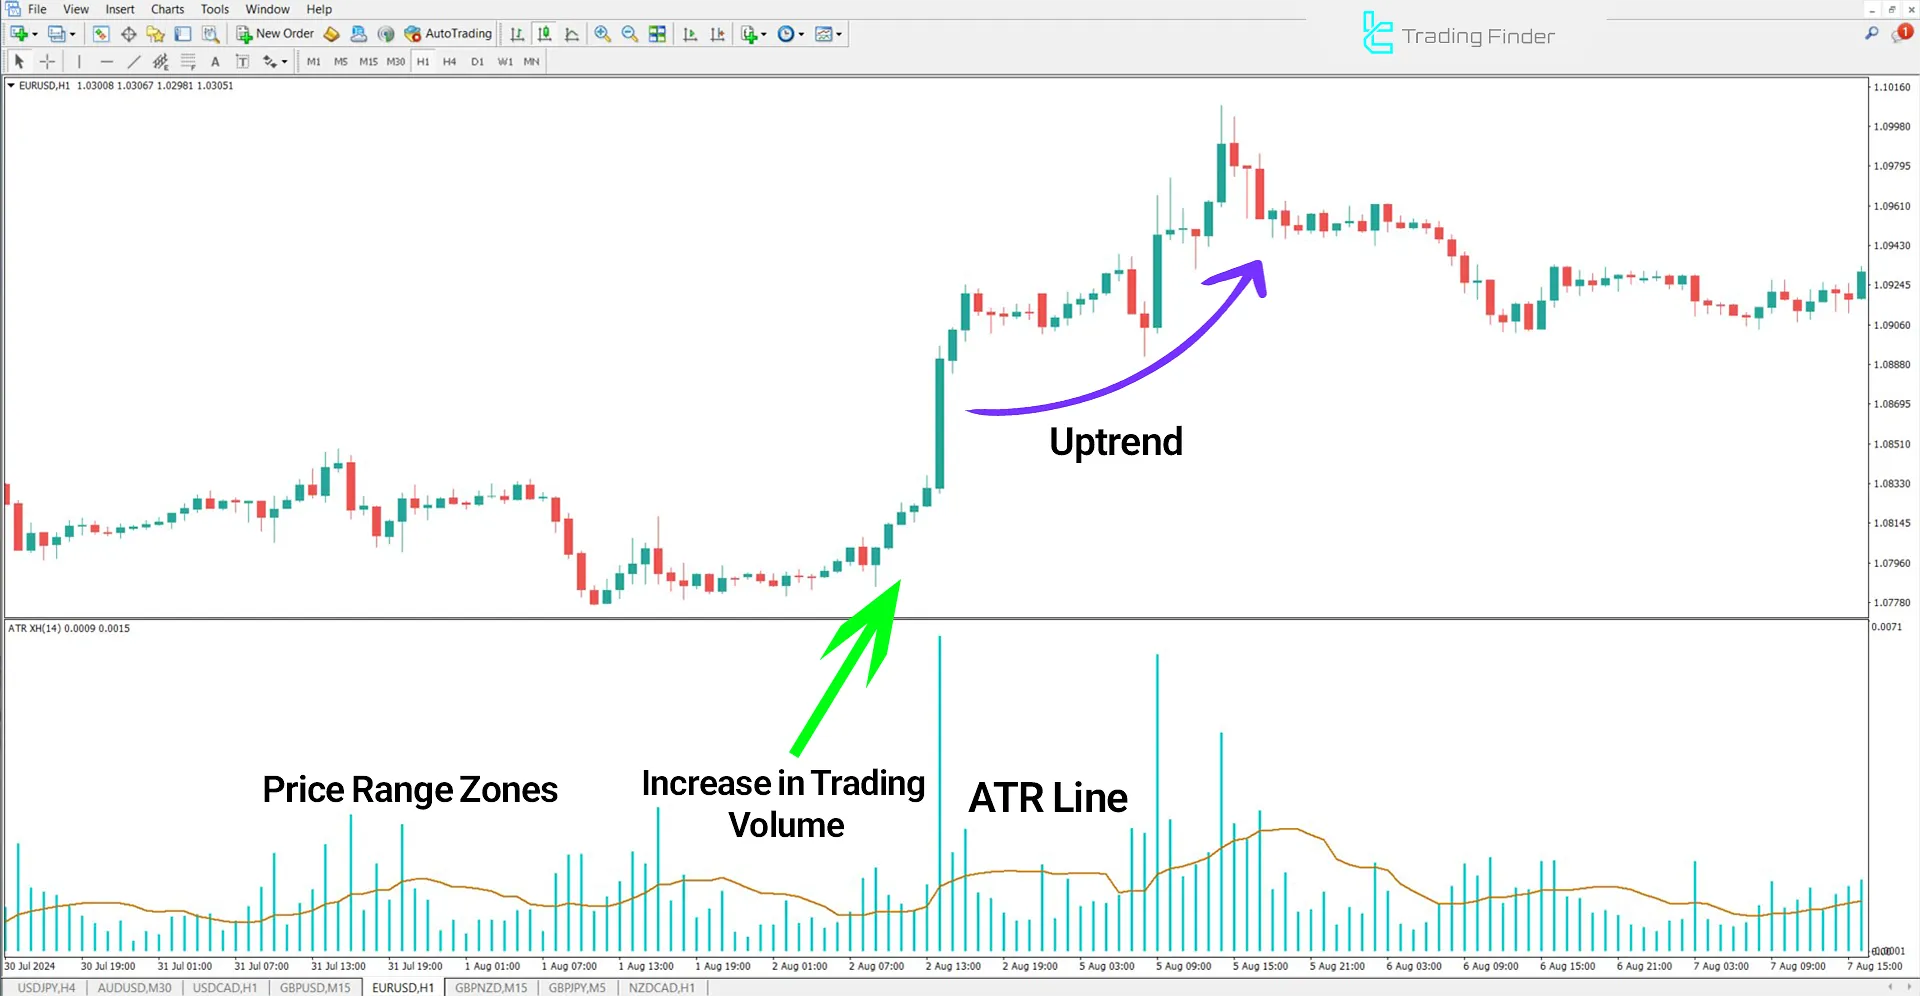
In the price chart of the EUR/USD currency pair, the price was in a range and then formed an uptrend after an increase in trading volume.
By observing the increase in trading volume and the price crossing the ATR line, traders can identify the market trend and anticipate the likelihood of continuation in the current direction.

Indicator in a Downtrend
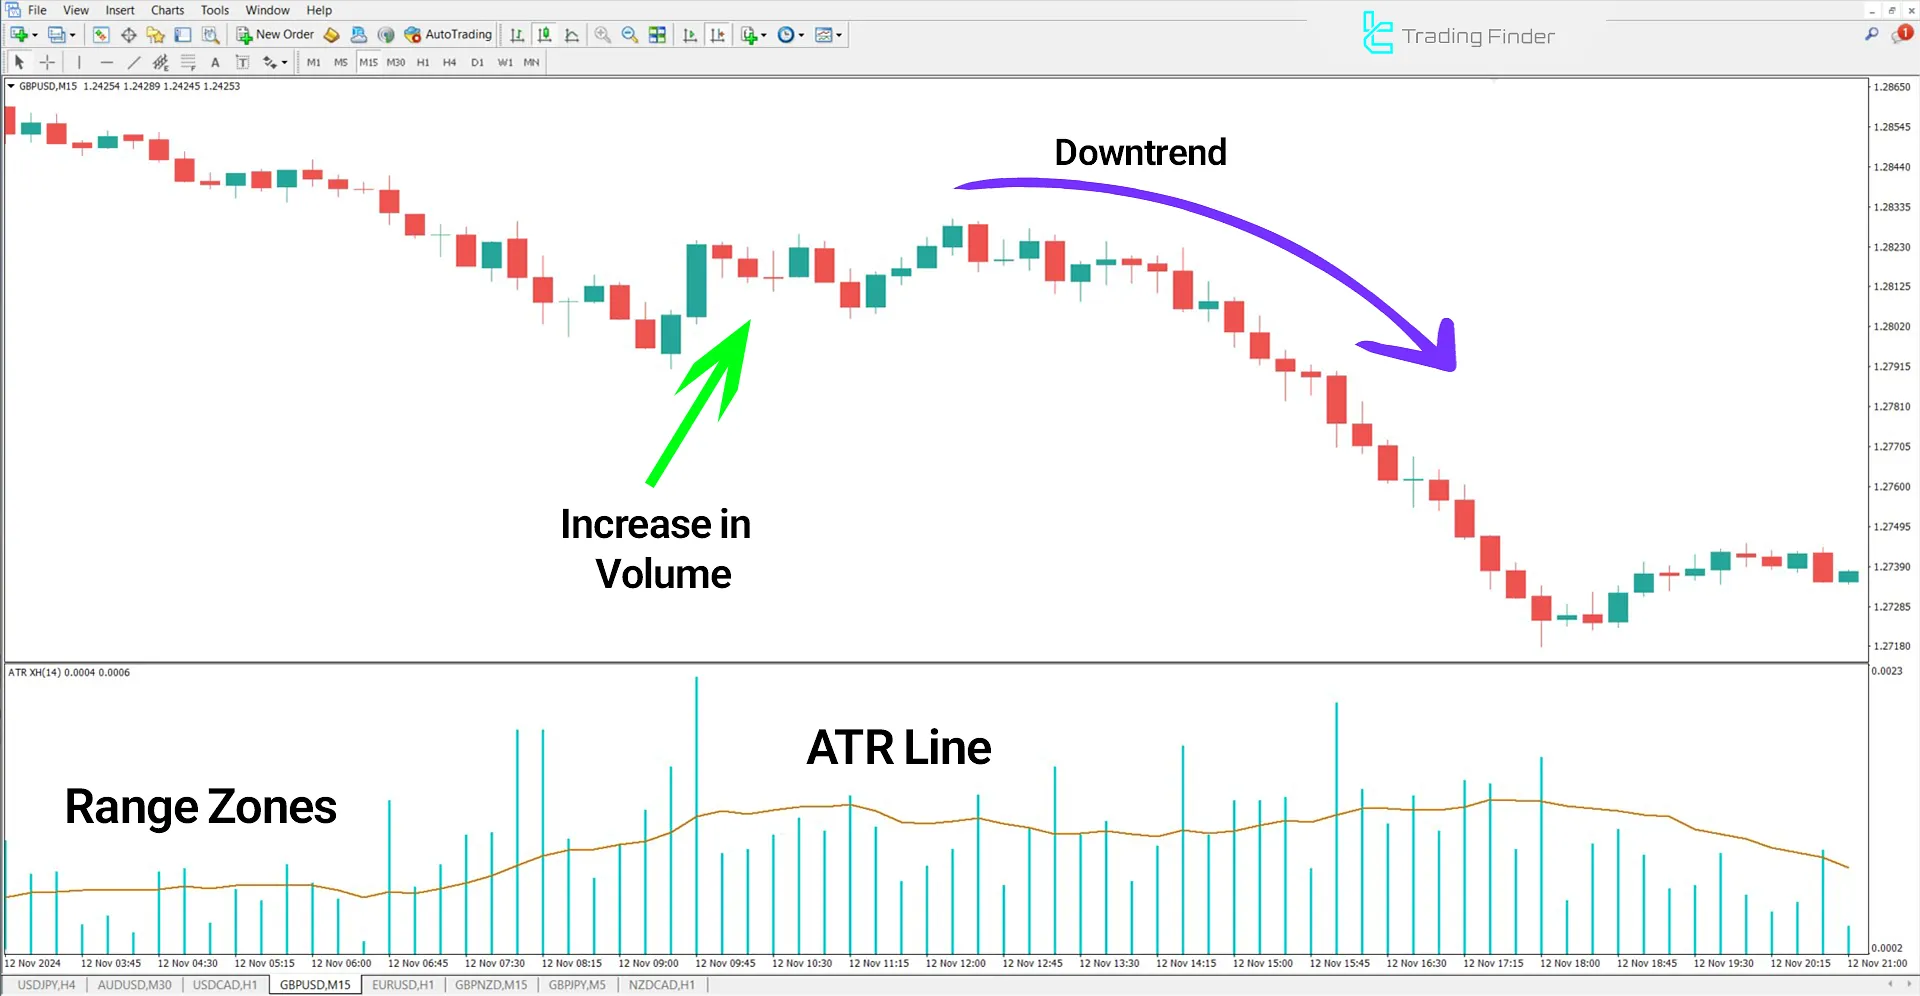
In the price chart of the GBP/USD currency pair, the indicator was in a range, but after an increase in trading volume, the price entered a downtrend.
Observing the entry of liquidity and the increase in volume along with the price decline allows traders to open sell positions in line with the downtrend.
 Demonstration of increased trading volume in a downtrend using the ATR XH Volume Indicator.
Settings of the ATR XH Volume Indicator
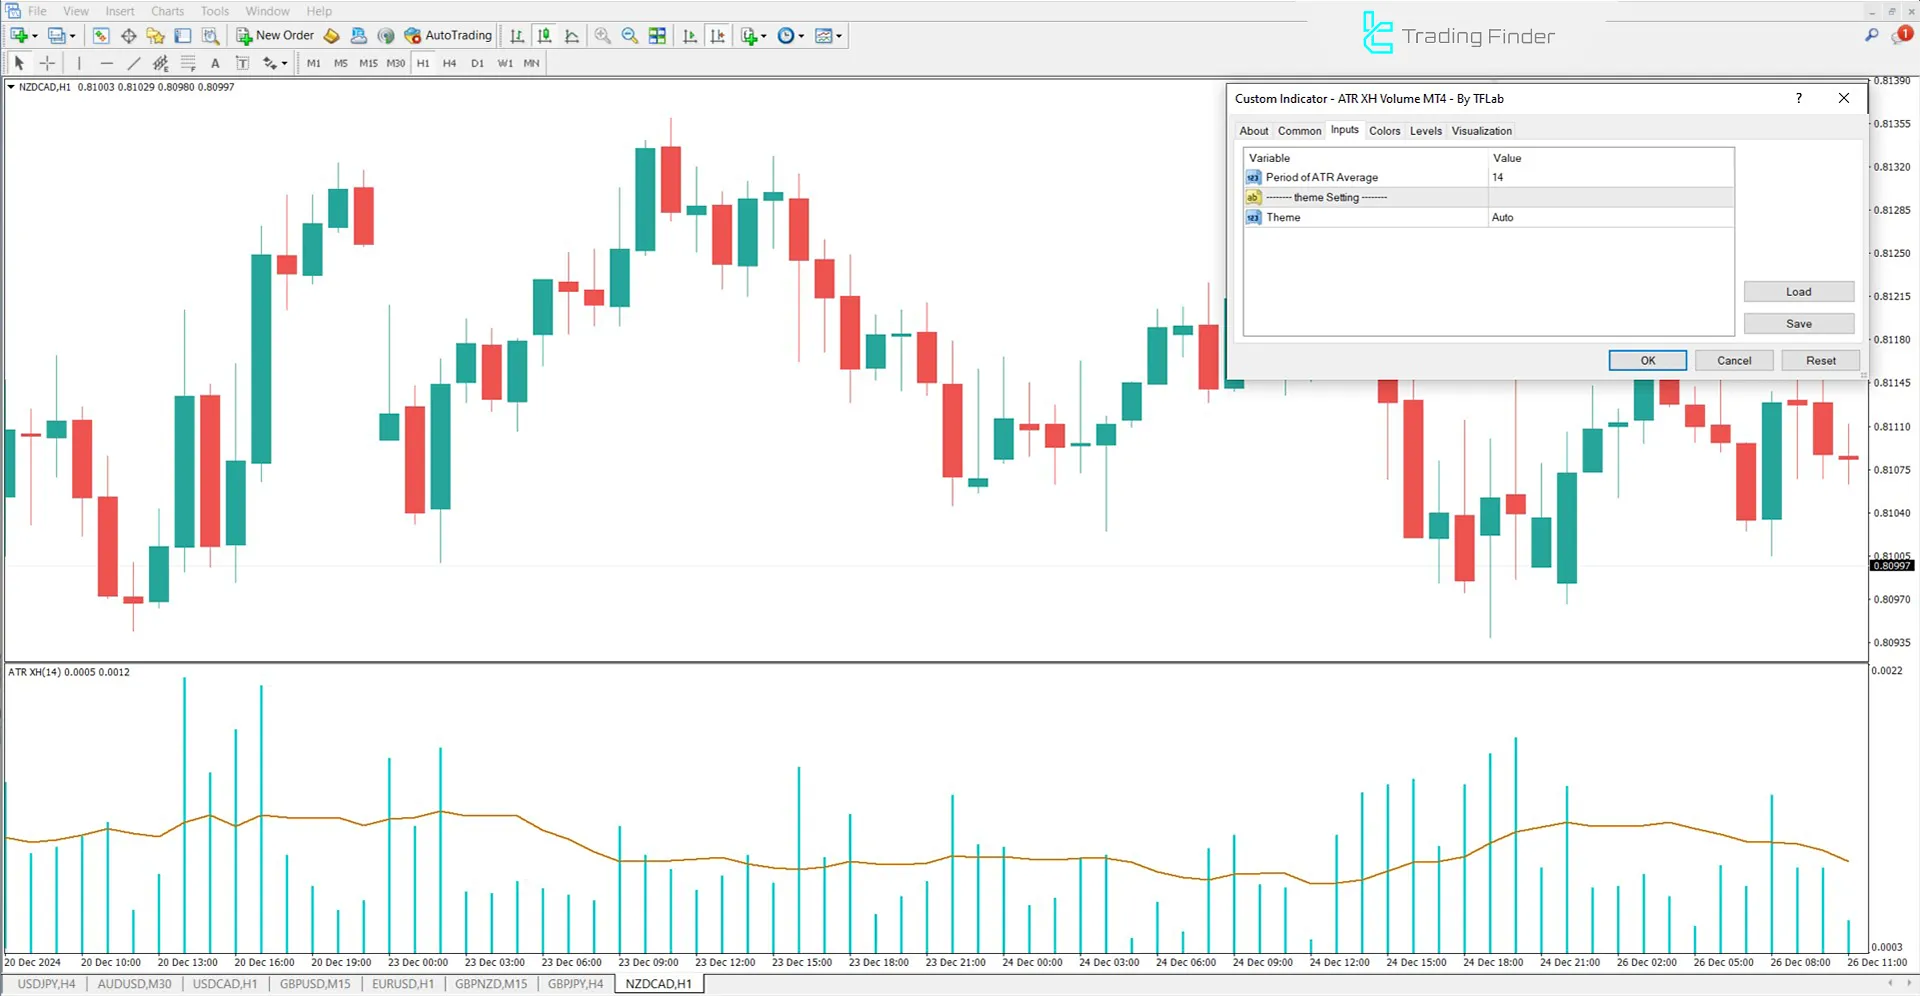
The following image shows the settings for the indicator:

- Period of ATR Average: Calculates the trading volume period based on ATR
Conclusion
The ATR XH Volume Indicator, by combining trading volume and Average True Range (ATR), is a practical tool for identifying strong trends and reducing market volatility.
By observing an increase in trading volume, the market direction can be determined using this indicator.
ATR XH Volume MT4 PDF
ATR XH Volume MT4 PDF
Click to download ATR XH Volume MT4 PDFWhat is the ATR XH Volume Indicator?
The ATR XH Volume Indicator is a combined tool that displays trading volume and Average True Range (ATR) simultaneously.
How to use the ATR XH Volume Indicator for trend identification?
If both trading volume and ATR increase simultaneously, there’s a likelihood of a continuation of the current market trend. Conversely, a decrease in both metrics signals entry into low-volatility or range-bound periods.


