![Balanced Volume Oscillator for MetaTrader 4 Download - Free - [TFlab]](https://cdn.tradingfinder.com/image/183226/4-30-en-balanced-volume-oscillator-mt4-1.webp)
![Balanced Volume Oscillator for MetaTrader 4 Download - Free - [TFlab] 0](https://cdn.tradingfinder.com/image/183226/4-30-en-balanced-volume-oscillator-mt4-1.webp)
![Balanced Volume Oscillator for MetaTrader 4 Download - Free - [TFlab] 1](https://cdn.tradingfinder.com/image/183193/4-30-en-balanced-volume-oscillator-mt4-2.webp)
![Balanced Volume Oscillator for MetaTrader 4 Download - Free - [TFlab] 2](https://cdn.tradingfinder.com/image/183194/4-30-en-balanced-volume-oscillator-mt4-3.webp)
![Balanced Volume Oscillator for MetaTrader 4 Download - Free - [TFlab] 3](https://cdn.tradingfinder.com/image/183195/4-30-en-balanced-volume-oscillator-mt4-4.webp)
The Balanced Volume Oscillator is one of the MetaTrader 4 indicators, designed to measure the volume flow in the market, helping traders predict the trend strength or the likelihood of price direction changes.
This indicator combines trading volume with price changes and answers whether money flows into or out of the market. Therefore, the Balanced Volume Oscillator is a practical tool for identifying trends and Potential Reversal Zones (PRZ).
Balanced Volume Oscillator Specifications Table
In this table, the details of this indicator are presented briefly:
Indicator Categories: | Oscillators MT4 Indicators Support & Resistance MT4 Indicators Trading Assist MT4 Indicators |
Platforms: | MetaTrader 4 Indicators |
Trading Skills: | Intermediate |
Indicator Types: | Trend MT4 Indicators Reversal MT4 Indicators |
Timeframe: | Multi-Timeframe MT4 Indicators |
Trading Style: | Day Trading MT4 Indicators |
Trading Instruments: | Share Stocks MT4 Indicators Stock Market MT4 Indicators Cryptocurrency MT4 Indicators Forex MT4 Indicators |
Indicator Overview
The histogram bars in this indicator show the current volume relative to the average periodic volume. Additionally, the colors indicate specific changes in trading volume compared to the average periodic volume and Fibonacci levels.
The histogram bars are color-coded based on the volume size:
- Red: Indicates current volume below the average periodic volume
- Green: Represents increased volume exceeding 38.2% Fibonacci level above the average periodic volume
- Yellow: Indicates increased volume between38.2% and 61.8% Fibonacci levels above the average periodic volume
- Purple: Shows increased volume between 61.8% and 100% Fibonacci levels above the average periodic volume
- Blue: Signals increased volume exceeding the 100% Fibonacci level relative to the average periodic volume
Indicator in an Uptrend
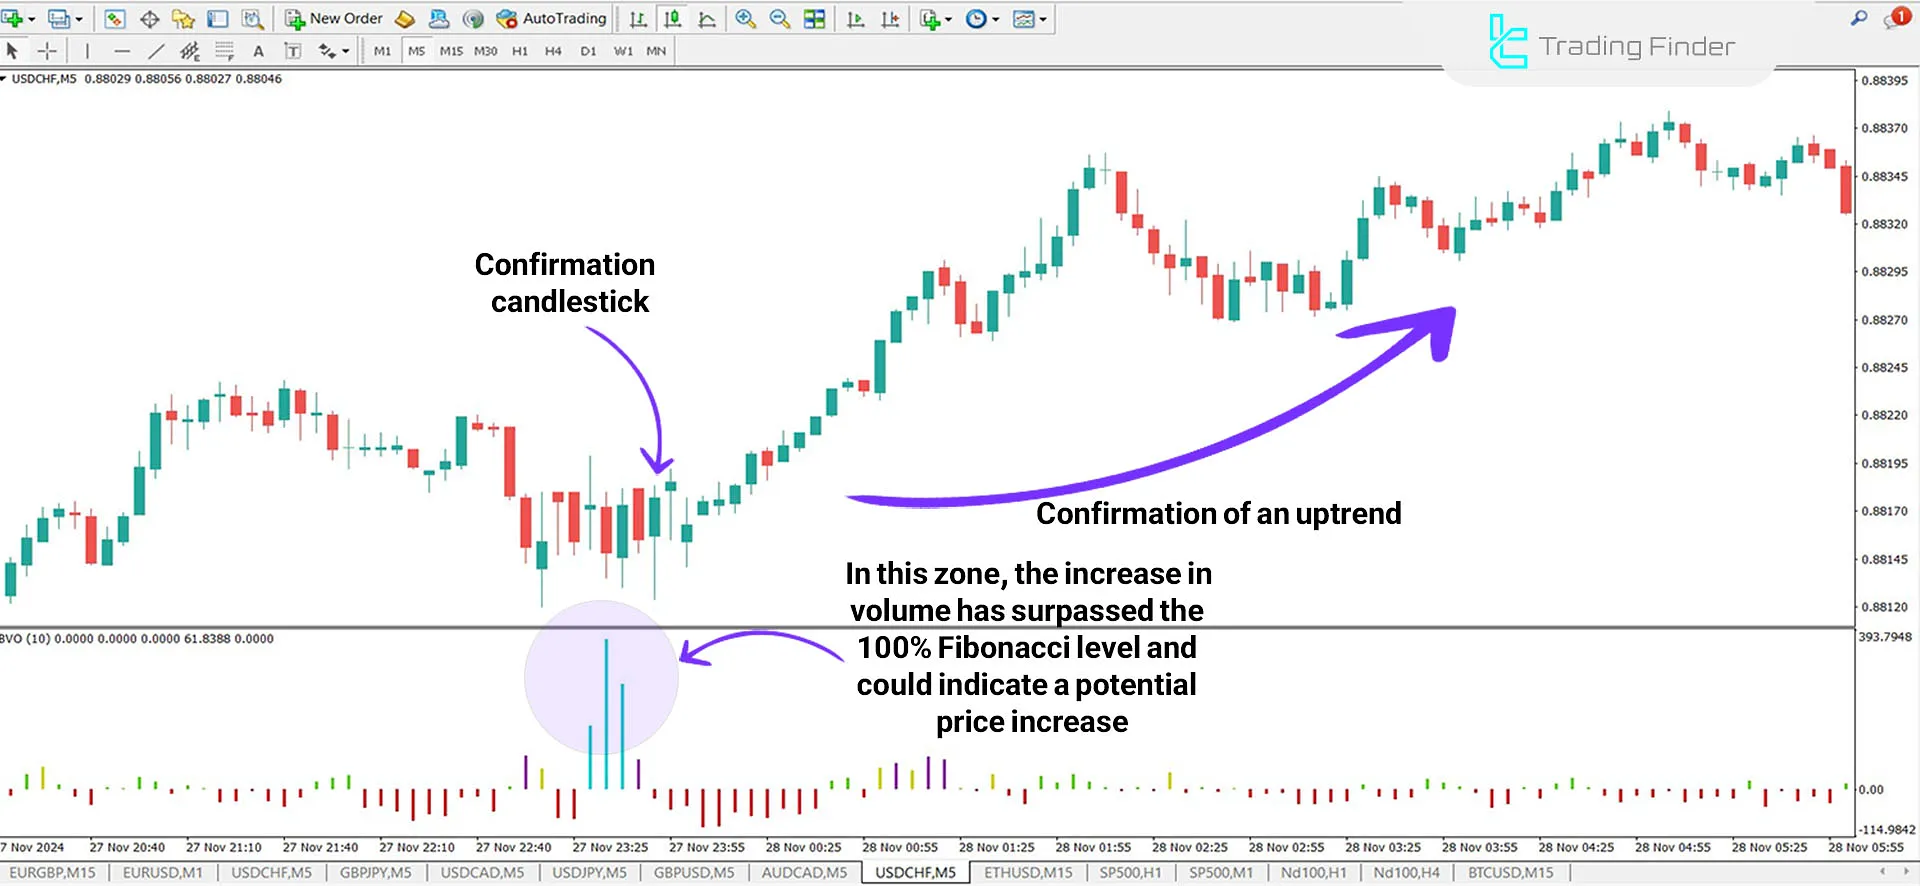
In an uptrend, the red color in the histogram of the Balanced Volume Oscillator indicates a decline in trading volume. This decrease may signify a weakness among sellers and an increase in momentum within the price trend.
Traders can enter a Buy position when volume increases (blue bars) at specific levels, accompanied by confirmation candlesticks, as the price approaches a support level.

Indicator in a Downtrend
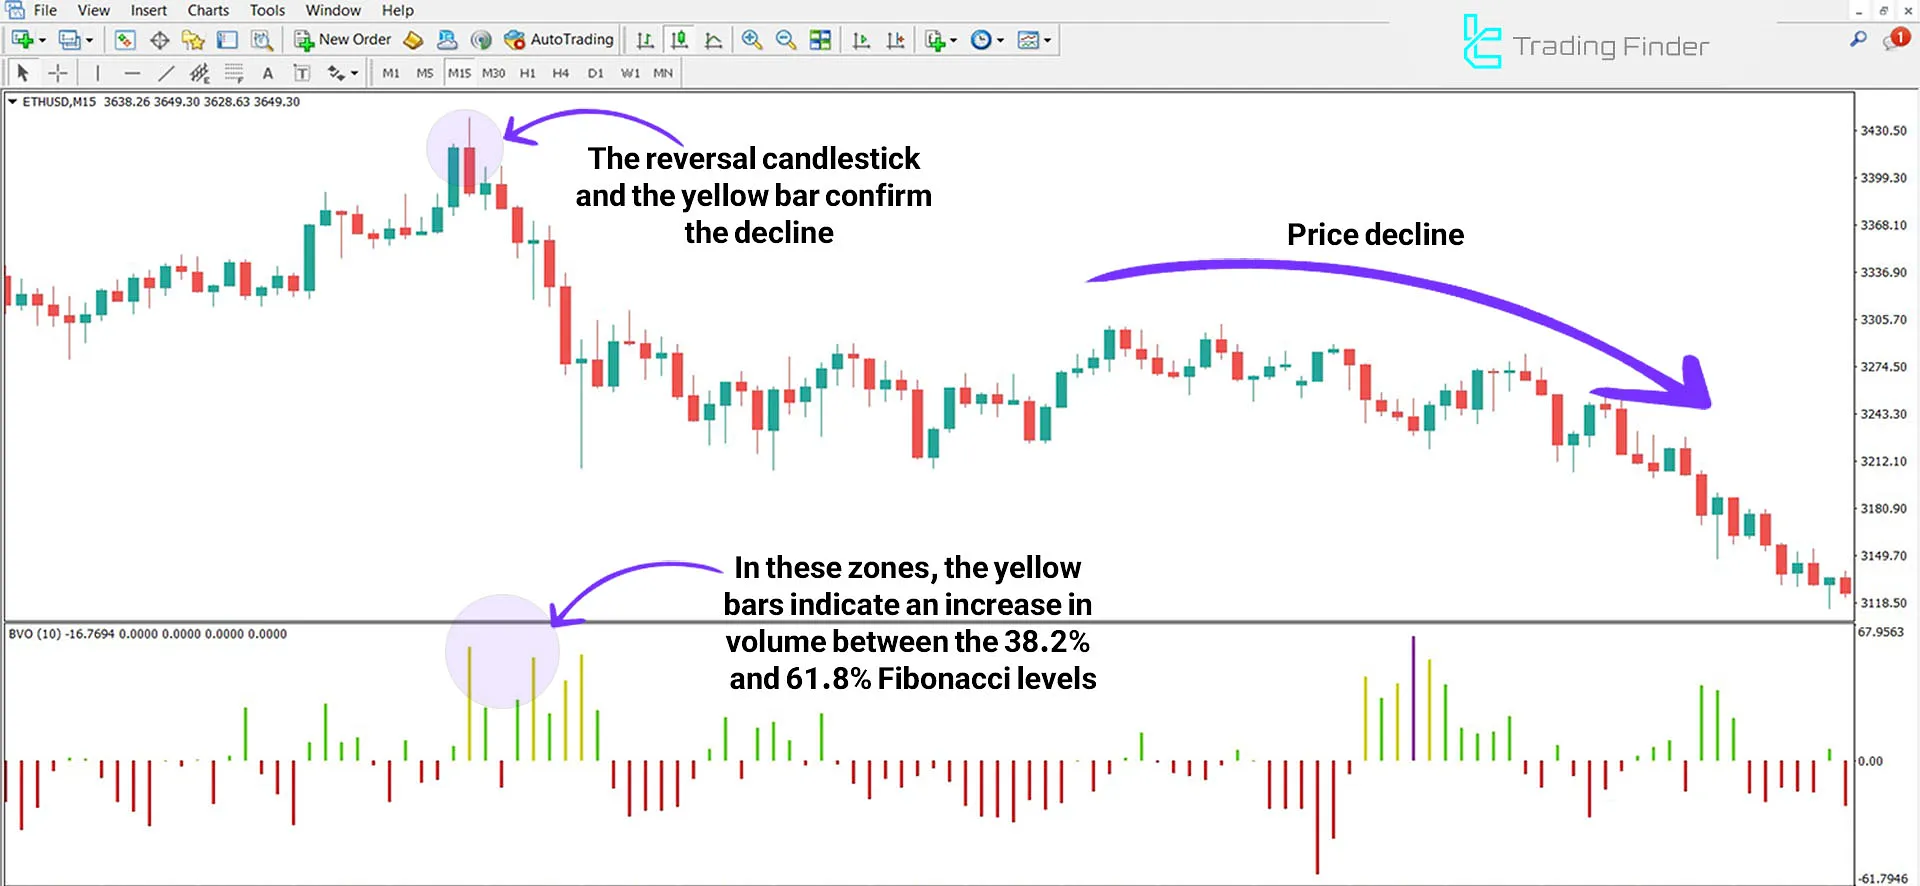
In the Ethereum (ETH) price chart, when a new high is formed, the color of the histogram bars changes to yellow, indicating that volume is entering the market.
This could signal abearish divergence and strengthen the possibility of a trend reversal.
In such scenarios, traders should look for confirmations such as reversal candlesticks or breakouts of resistance levels.

Indicator Settings
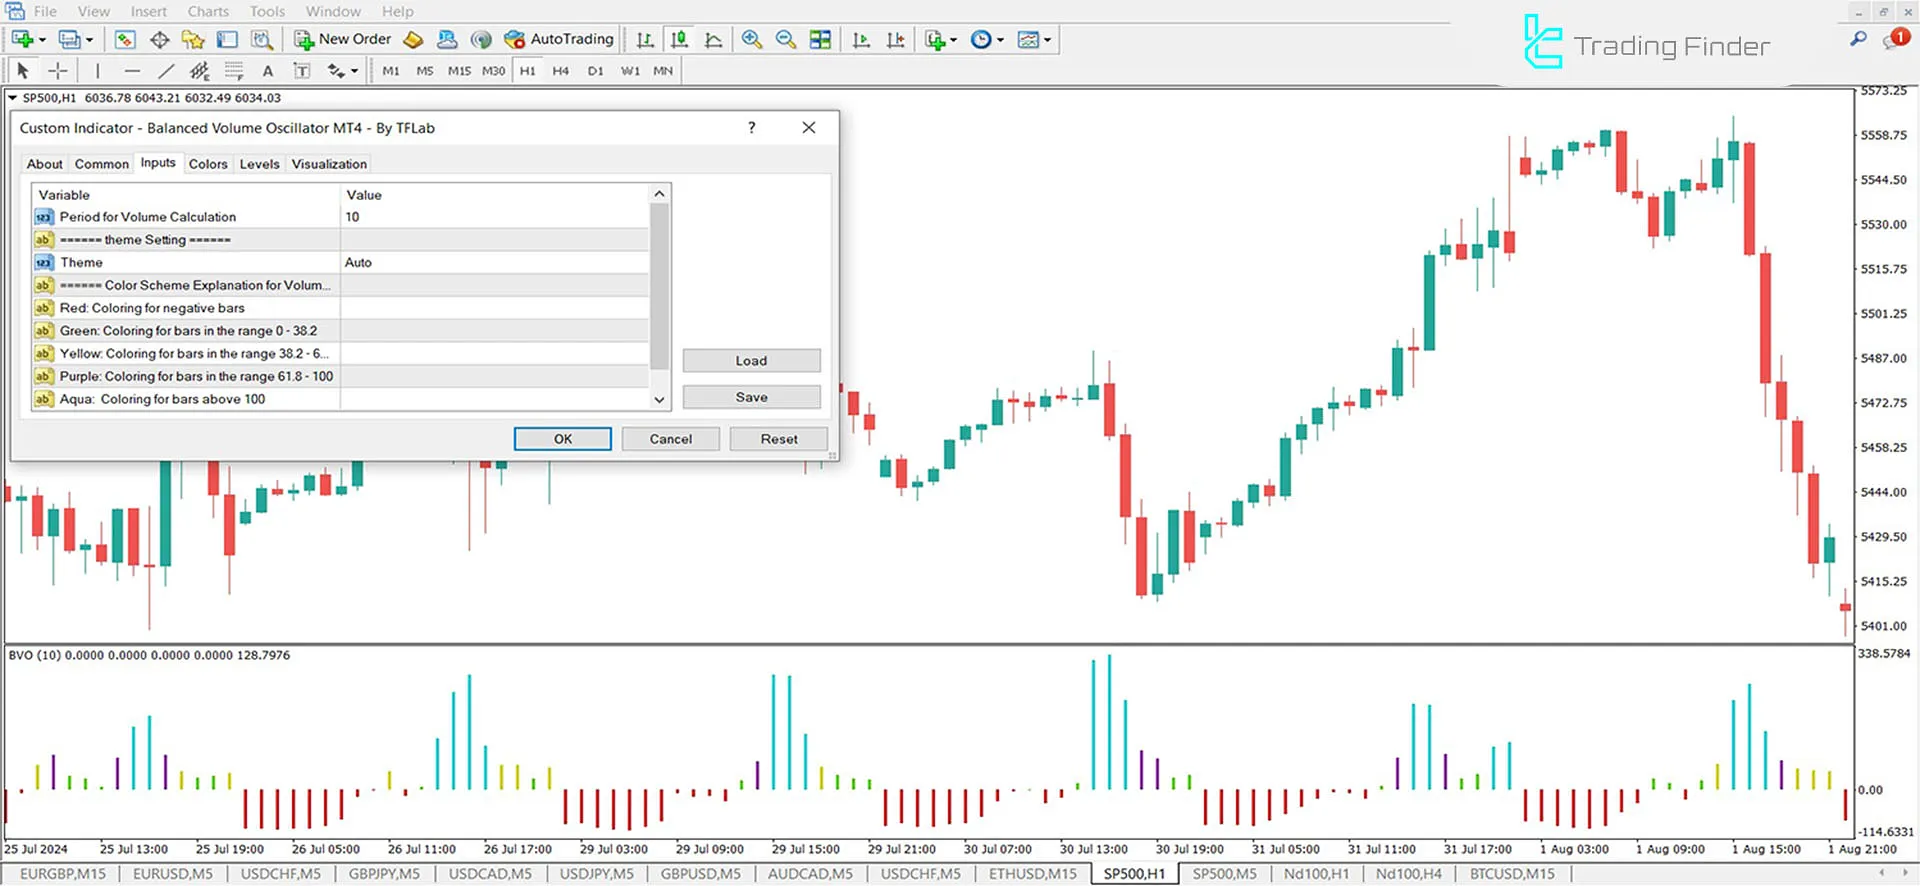
In the following image, you can see the complete details of the indicator settings:

- Period for Volume Calculation: Number of periods for volume calculation
- Theme: Auto theme adjustment for display
- Red Coloring for Negative Bars: Display negative volume in red
- Green Coloring for Bars in the Range 0 - 38.2: Volume in the range of 0 to 38.2 with green color
- Yellow Coloring for Bars in the Range 38.2 - 61.8: Volume in the range of 38.2 to 61.8 with yellow color
- Purple Coloring for Bars in the Range 61.8 - 100: Volume in the range of 61.8 to 100 with purple color
- Aqua Coloring for Bars Above 100: Volume above 100 with light blue color
Conclusion
With this color scheme, traders can observe changes in volume compared to the periodic average.
The Balanced Volume Oscillator performs better in short-term time frames, such as 15 minutes, because trading volume tends to be higher in long-term trends, leading to weaker breakouts.
Traders can enhance their market analysis by using the Auto Fibo indicator as a complementary tool alongside this indicator.
Balanced Volume Oscillator MT4 PDF
Balanced Volume Oscillator MT4 PDF
Click to download Balanced Volume Oscillator MT4 PDFWhat is the best time frame for using this indicator?
The indicator works best in short-term time frames like 15 minutes. However, it can also assist in analyzing trends in long-term time frames.
Is this indicator suitable for beginners?
Yes, this indicator is beginner-friendly due to its simple display of volume and changes. However, it’s recommended that you have a basic understanding of technical analysis before using it.


