


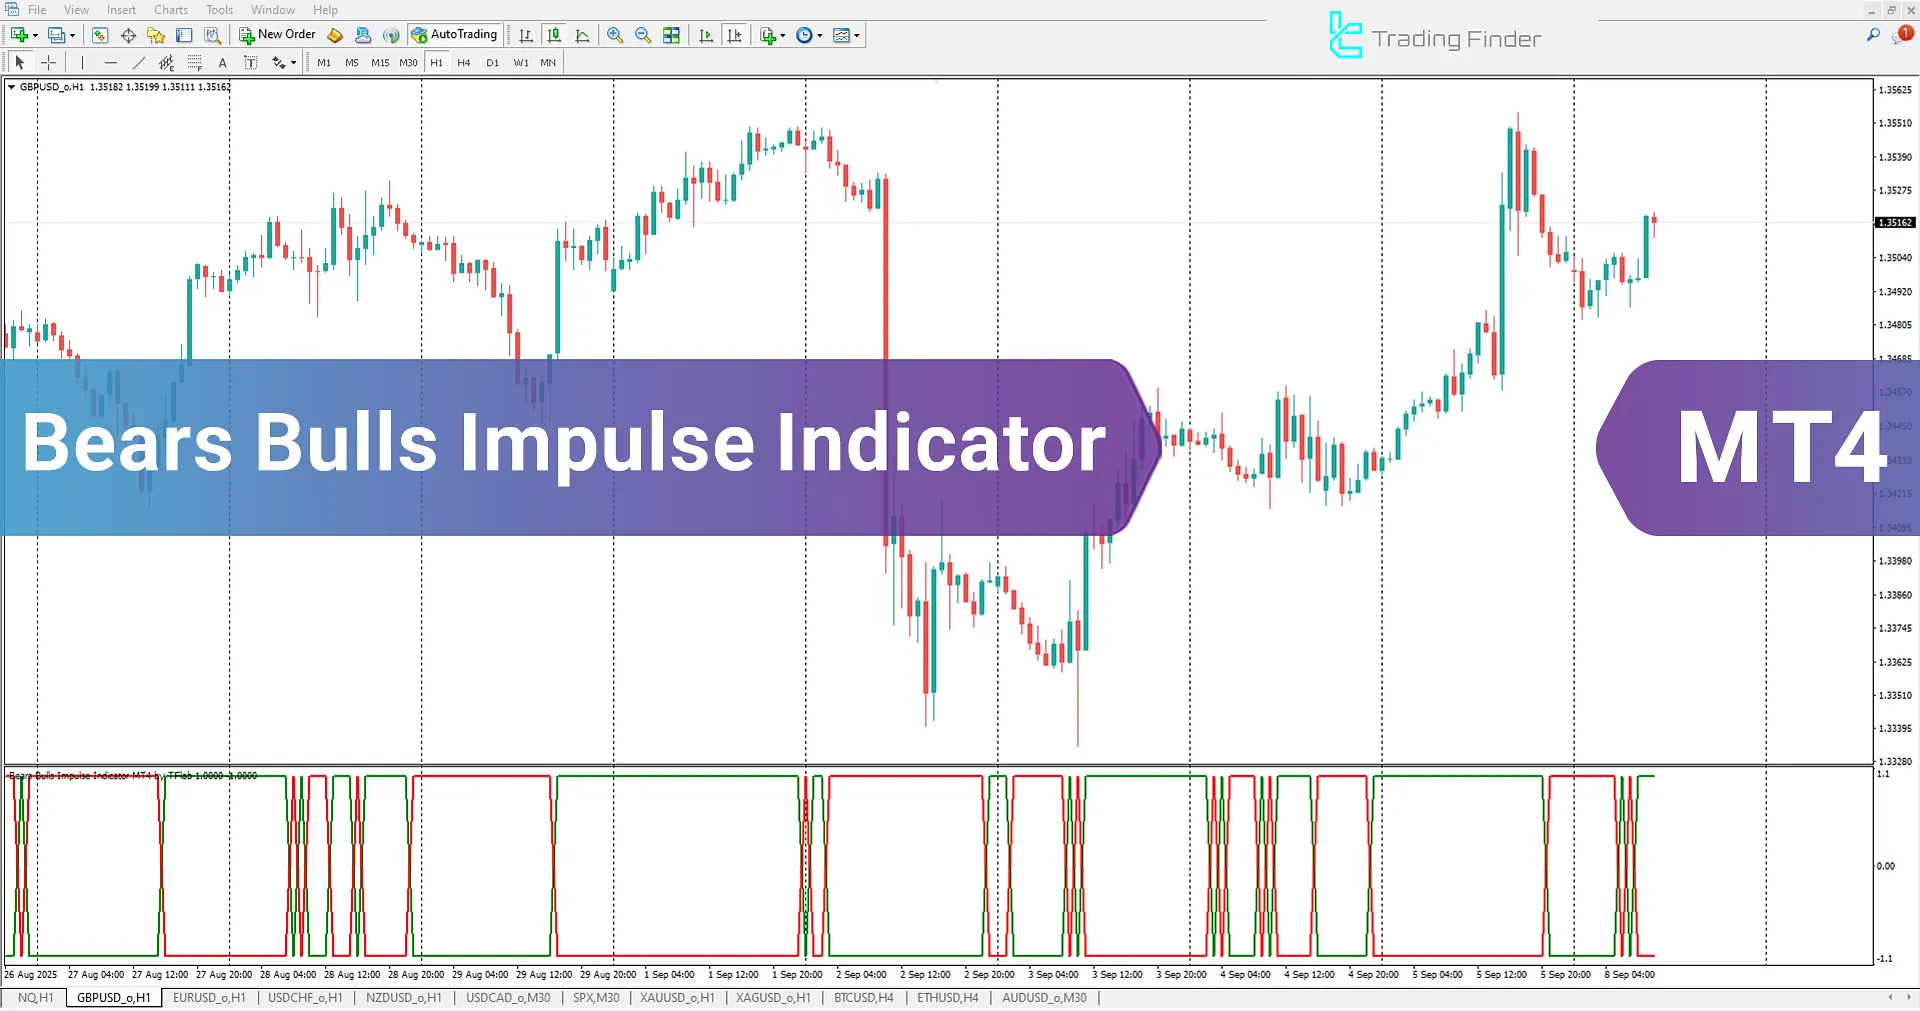
The Bears Bulls Impulse Indicator is a practical oscillator for forex traders that allows them to identify bullish and bearish market trends in MetaTrader 4.
This indicator uses two oscillator lines to define market direction.
When the green oscillator line is above the red oscillator line, it indicates a bullish trend. Conversely, when the red oscillator line is above the green one, it signals a bearish market trend.
Bears and Bulls Motivation Indicator Table
Below, the information related to the Bears and Bulls Motivation Indicator is provided.
Indicator Categories: | Oscillators MT4 Indicators Signal & Forecast MT4 Indicators Trading Assist MT4 Indicators |
Platforms: | MetaTrader 4 Indicators |
Trading Skills: | Intermediate |
Indicator Types: | Leading MT4 Indicators Trend MT4 Indicators Lagging MT4 Indicators |
Timeframe: | Multi-Timeframe MT4 Indicators |
Trading Style: | Day Trading MT4 Indicators Intraday MT4 Indicators Scalper MT4 Indicators |
Trading Instruments: | Indices Market MT4 Indicators Stock Market MT4 Indicators Cryptocurrency MT4 Indicators Forex MT4 Indicators |
Bears and Bulls Motivation Indicator at a Glance
The Bears Bulls Impulse Indicator is a useful tool for technical traders that displays two oscillator lines in green and red, issuing buy and sell signals when the lines cross.
Besides identifying entry and exit points, this indicator helps traders recognize the current market trend as well as potential reversals.
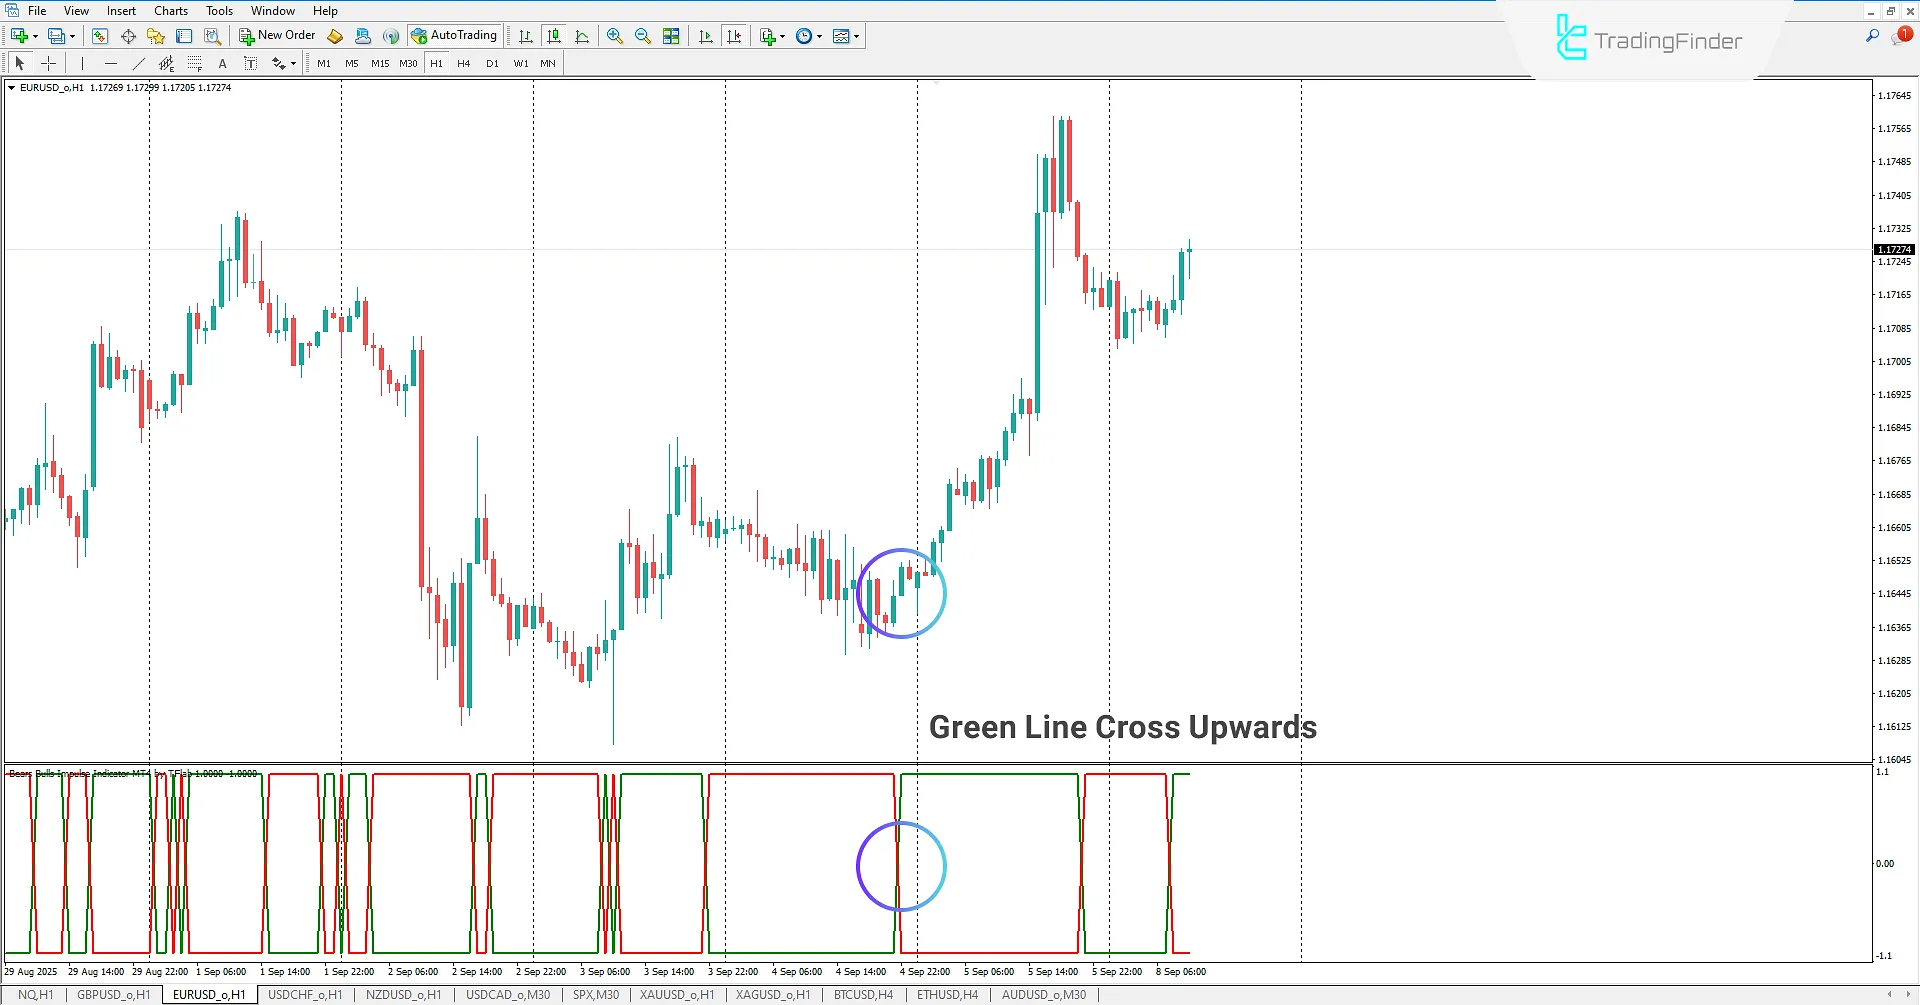
Bullish Trend of the Bears and Bulls Motivation Indicator
On the 1-hour EUR/USD chart, the Bears Bulls Impulse Indicator is applied.
When the green oscillator line crosses above the red oscillator line, it indicates a buy signal in the market.
Traders can use this opportunity to open buy positions and benefit from the potential bullish trend.
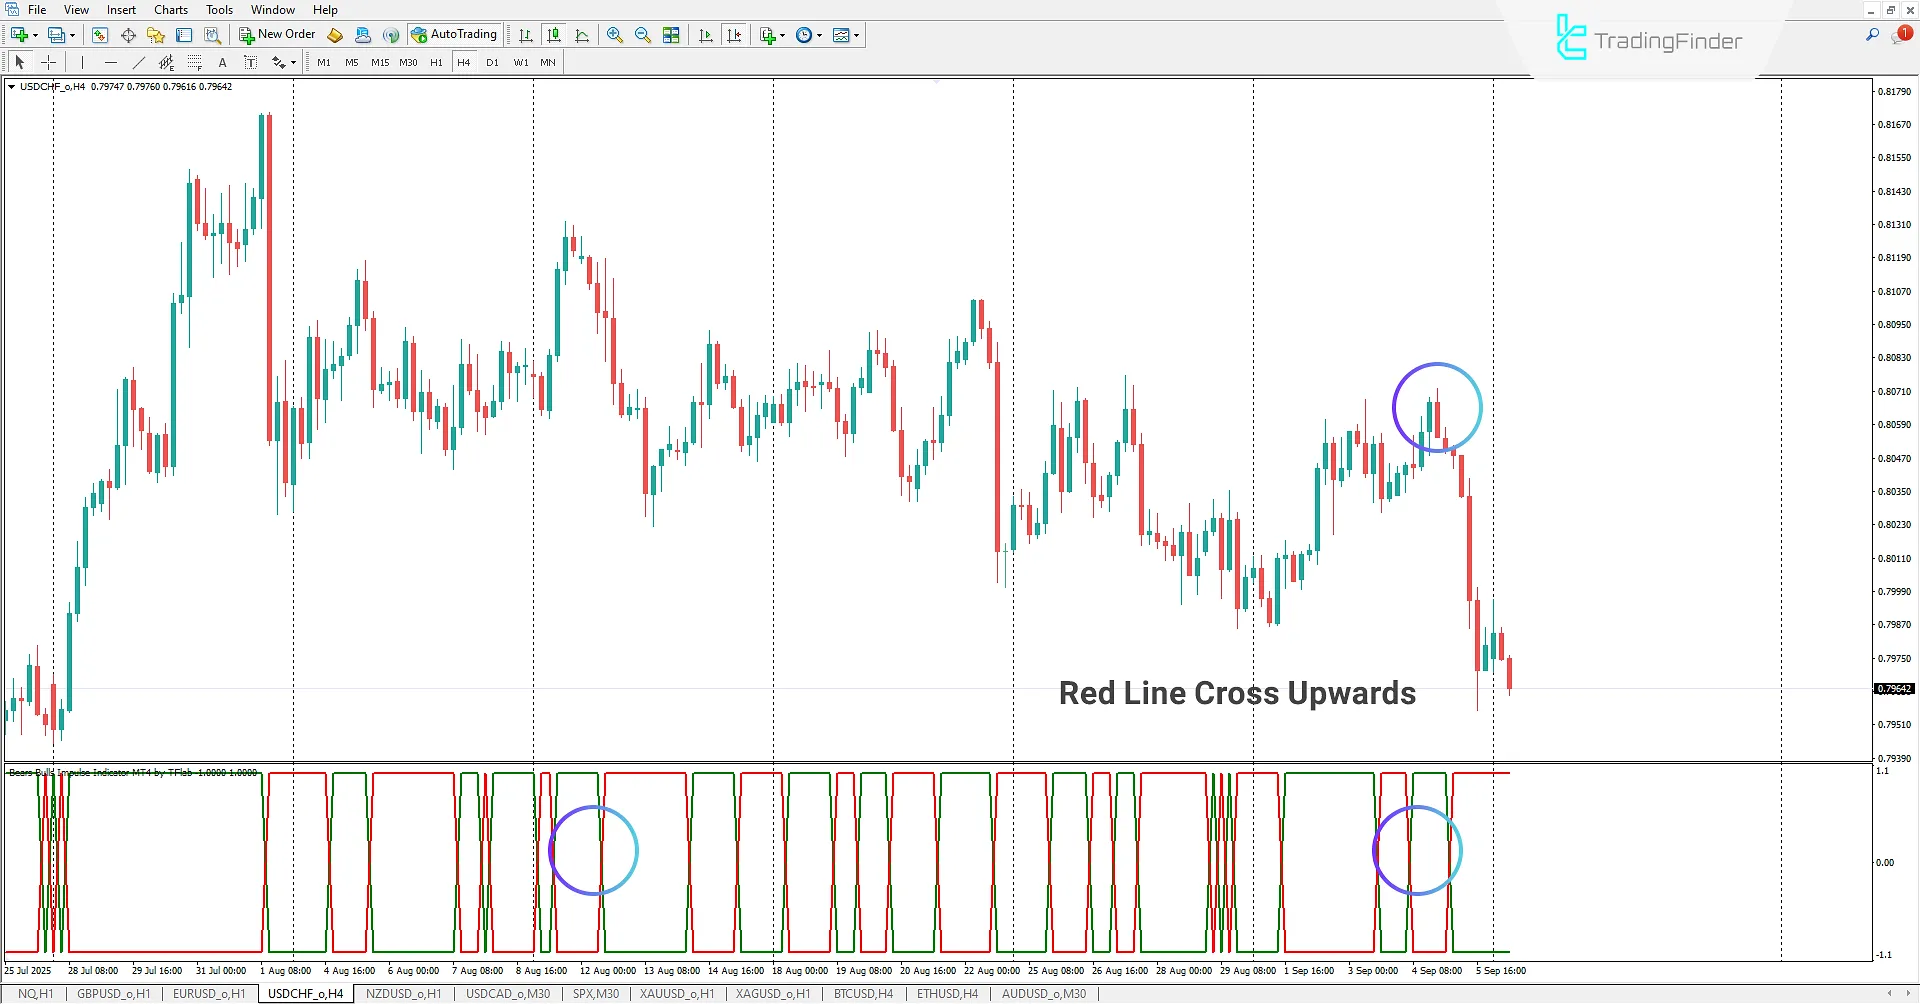
Bearish Trend of the Bears and Bulls Motivation Indicator
On the 4-hour USDCHF chart, traders can use the Bears Bulls Impulse Indicator to identify sell signals.
Whenever the red oscillator line moves above the green oscillator line, it indicates a sell signal.
In such cases, traders can use the signal to open sell positions and follow the bearish market trend.
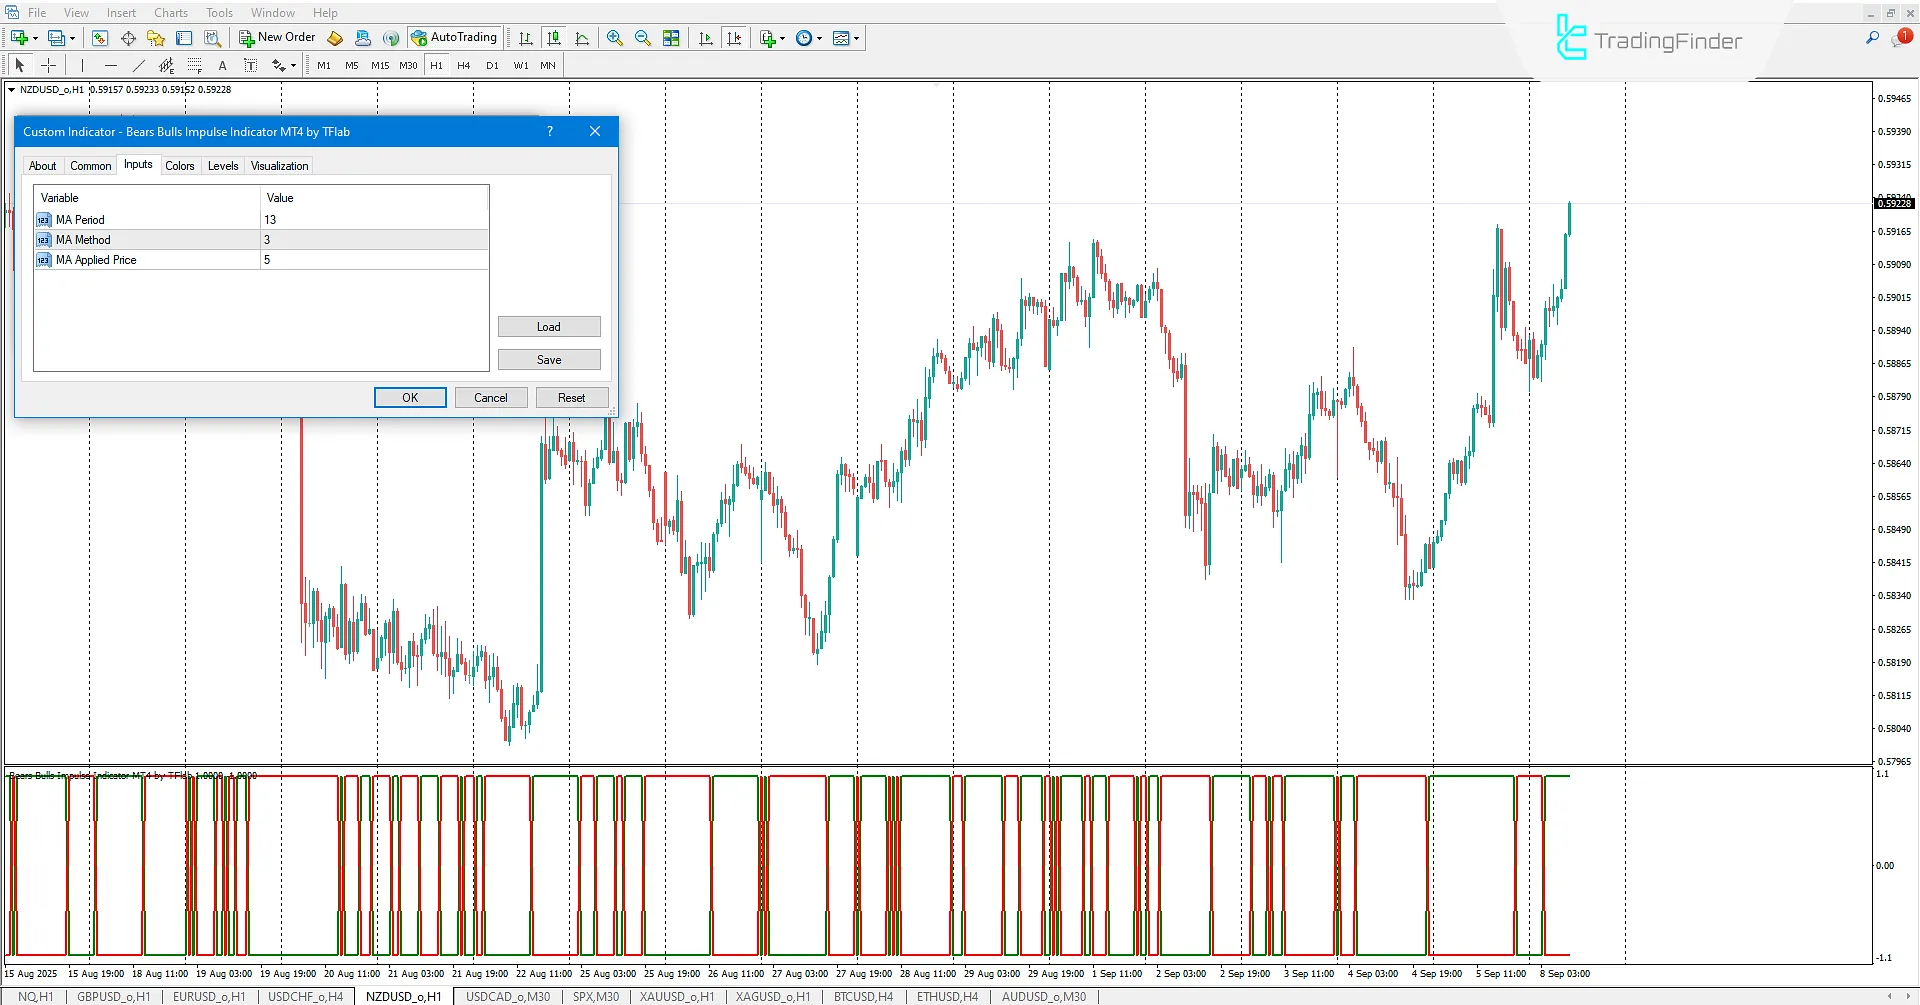
Settings of the Bears and Bulls Motivation Indicator
The following section provides the settings of the Bears and Bulls Motivation Indicator:
- MA Period: Define moving average calculation period;
- MA Method: Define moving average calculation method;
- MA Applied Price: Define base price for moving average calculation.
Conclusion
The Bears Bulls Impulse Indicator is a useful tool for identifying buy and sell signals in the market.
Forex and crypto traders can use this indicator along with their trading strategies to identify bullish and bearish trends and enter buy or sell positions when the two oscillator lines cross.
Bears Bulls Impulse Indicator in MetaTrader 4 PDF
Bears Bulls Impulse Indicator in MetaTrader 4 PDF
Click to download Bears Bulls Impulse Indicator in MetaTrader 4 PDFWhat is the Bears Bulls Impulse Indicator?
It is a practical oscillator for forex and crypto traders that identifies bullish and bearish market trends and issues buy and sell signals.
How does the Bears Bulls Impulse Indicator show market trends?
By using two oscillator lines:
- Green line above red line: Bullish trend
- Red line above green line: Bearish trend


