![Better DMX Jurik Histogram Indicator for MetaTrader 4 Download - Free - [TFlab]](https://cdn.tradingfinder.com/image/203607/4-41-en-better-dmx-jurik-histogram-mt4-1.webp)
![Better DMX Jurik Histogram Indicator for MetaTrader 4 Download - Free - [TFlab] 0](https://cdn.tradingfinder.com/image/203607/4-41-en-better-dmx-jurik-histogram-mt4-1.webp)
![Better DMX Jurik Histogram Indicator for MetaTrader 4 Download - Free - [TFlab] 1](https://cdn.tradingfinder.com/image/203588/4-41-fa-better-dmx-jurik-histogram-mt4-2.webp)
![Better DMX Jurik Histogram Indicator for MetaTrader 4 Download - Free - [TFlab] 2](https://cdn.tradingfinder.com/image/203587/4-41-fa-better-dmx-jurik-histogram-mt4-3.webp)
![Better DMX Jurik Histogram Indicator for MetaTrader 4 Download - Free - [TFlab] 3](https://cdn.tradingfinder.com/image/203586/4-41-fa-better-dmx-jurik-histogram-mt4-4.webp)
The Better DMX Juric Histogram Indicator is one of the advanced indicators in MetaTrader 4 that combines the Directional Movement Index (DMX) to simplify and enhance the accuracy of market trend analysis.
This oscillator features a colored histogram in its own window that displays trend changes through color shifts: green for bullish trends and red for bearish trends.
The indicator includes two moving averages (MA): ablue moving average (faster) and an orange moving average (slower).
Indicator Specifications
The following table summarizes the specifications of the indicator:
Indicator Categories: | Oscillators MT4 Indicators Currency Strength MT4 Indicators Trading Assist MT4 Indicators |
Platforms: | MetaTrader 4 Indicators |
Trading Skills: | Intermediate |
Indicator Types: | Lagging MT4 Indicators Reversal MT4 Indicators |
Timeframe: | Multi-Timeframe MT4 Indicators |
Trading Style: | Intraday MT4 Indicators |
Trading Instruments: | Share Stocks MT4 Indicators Forward Market MT4 Indicators Indices Market MT4 Indicators Stock Market MT4 Indicators Cryptocurrency MT4 Indicators Forex MT4 Indicators |
Overview
The Better DMX Jurik Histogram simplifies data interpretation and serves as an effective tool for detecting price movement directions.
By reducing noise and lag, the DMX oscillator provides more accurate signals for identifying the direction and strength of market trends.
This indicator oscillates within specific ranges and highlights overbought and oversold levels, with values above +60 indicating overbought conditions and below -60 indicating oversold conditions.
Bullish Trend
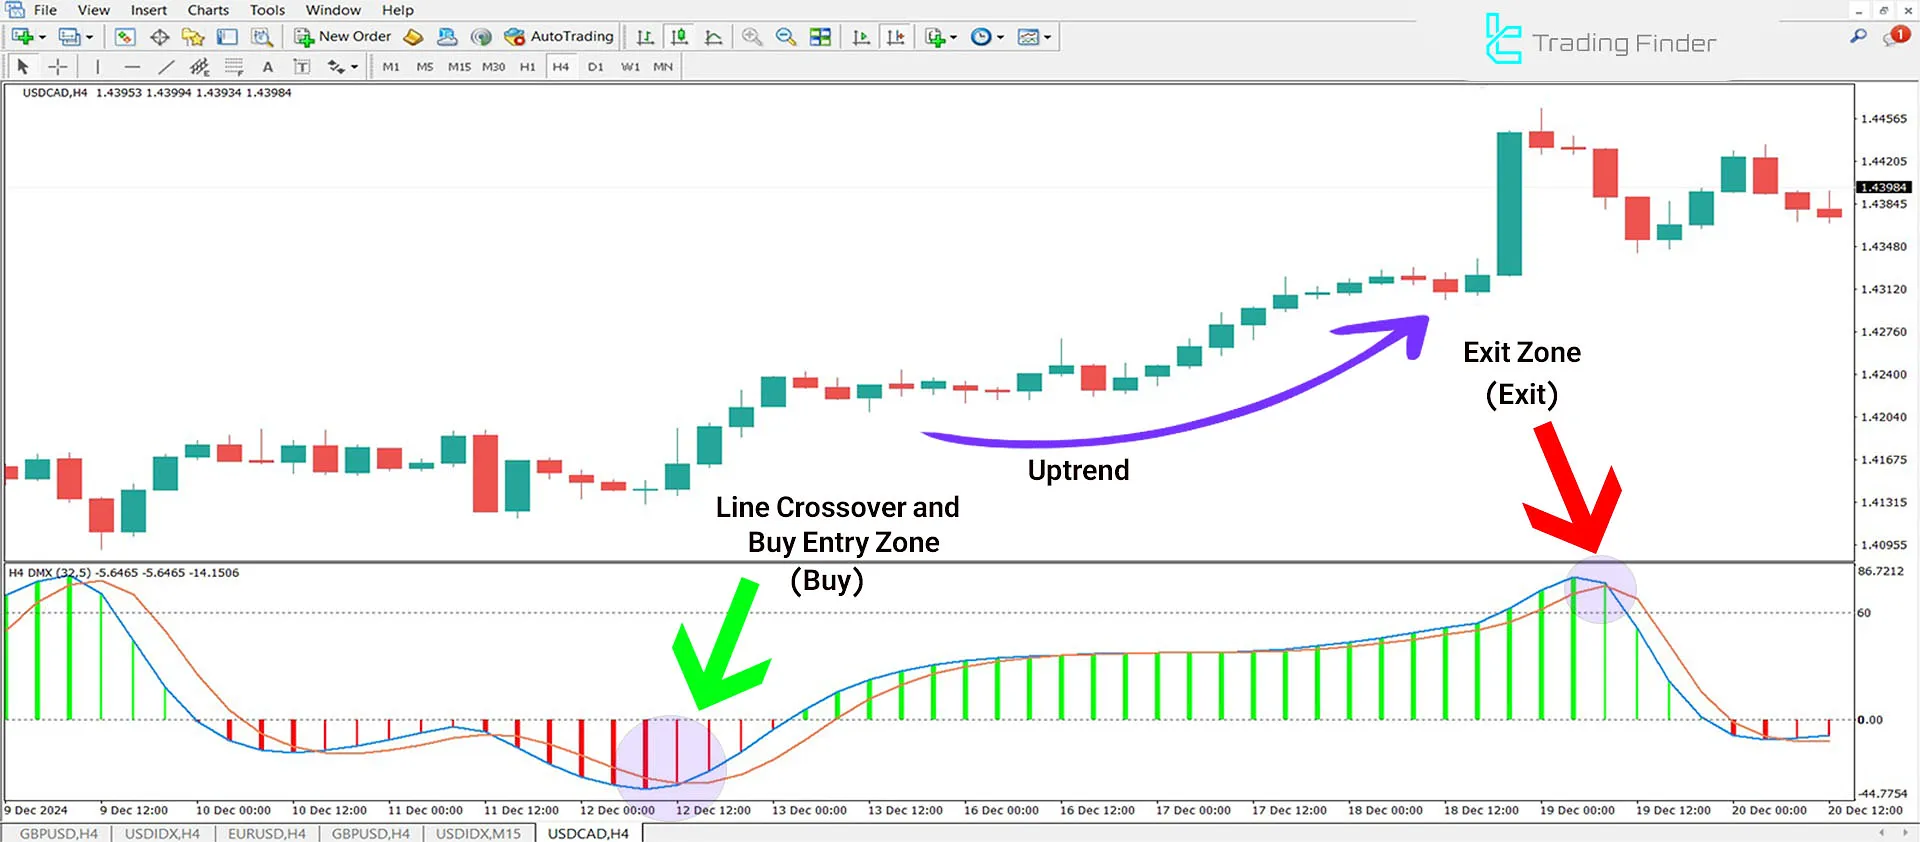
The image below demonstrates the USD/CAD pair on the H4 timeframe. When the blue line crosses above the orange line, traders interpret it as a buy signal.

Bearish Trend
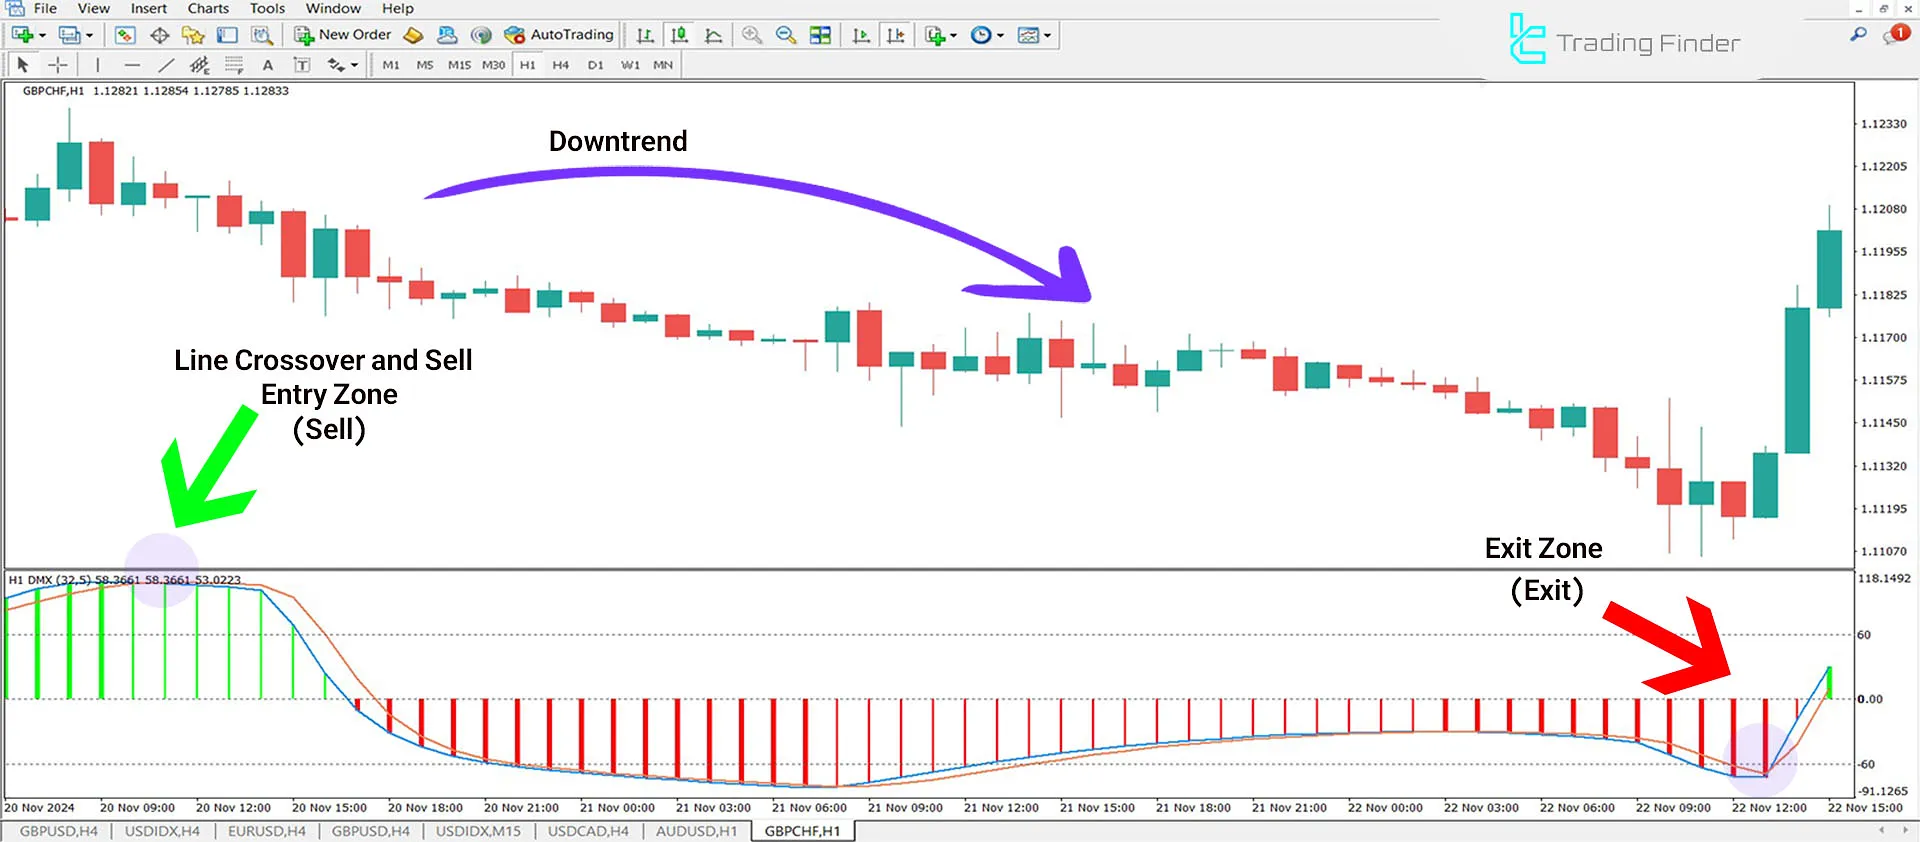
The GBP/CHF pair on the H1 timeframe showcases the indicator's performance in a bearish trend.
After forming histogram bars in the positive phase (above zero), if the blue line crosses below the red line, traders can interpret this as a sell signal.

Indicator Settings
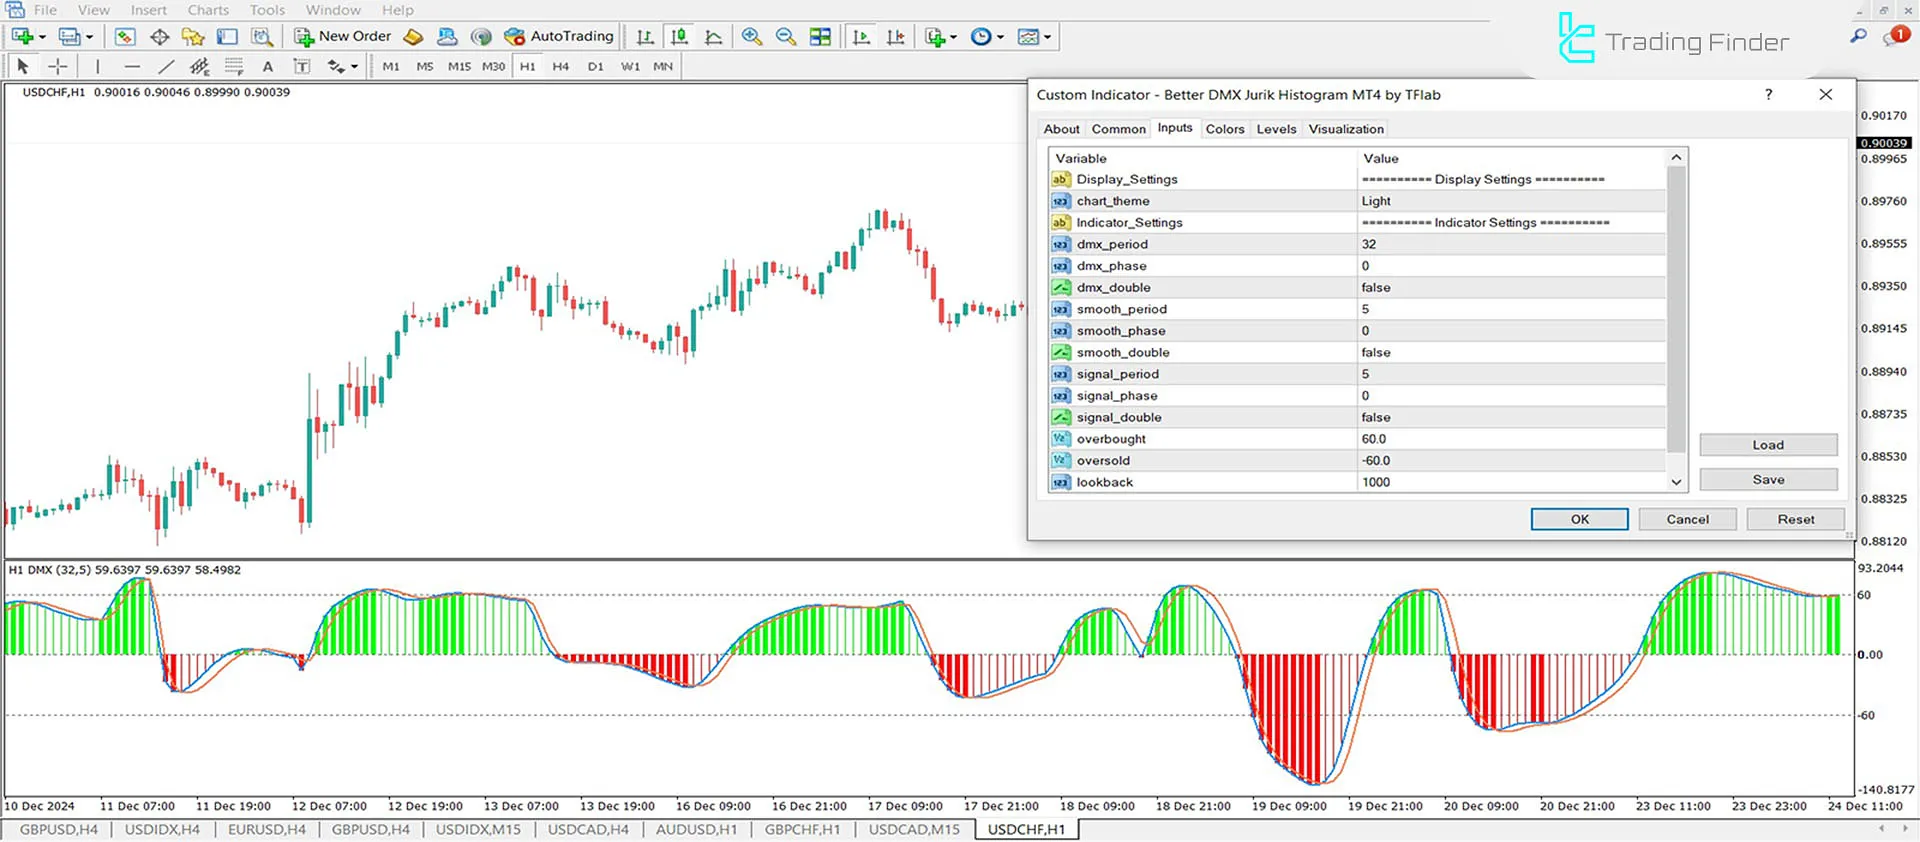
The following are the detailed settings for the Better DMX Jurik Histogram:

- Chart Theme: Background theme of the indicator
- DMX Period: Calculation period for the DMX
- DMX Phase: Parameter for precision adjustment
- DMX Double: Recalculates DMX values
- Smooth Period: Number of periods for smoothing calculation
- Smooth Phase: Phase value for applying smoothing
- Smooth Double: Applies smoothing values in two steps
- Signal Period: Number of periods for signal line calculation
- Signal Phase: Phase value for adjusting the signal line
- Signal Double: Two-step signal line calculation
- Over Bought: Overbought levels
- Over Sold: Oversold levels
- Look Back: Number of candles used in the indicator's calculations
Conclusion
This indicator is suitable for all timeframes and financial instruments and offers high flexibility in its settings, allowing traders to customize it according to their trading strategies.
It is particularly effective for mid-term and long-term strategies and performs better in volatile markets.
Better DMX Jurik Histogram MT4 PDF
Better DMX Jurik Histogram MT4 PDF
Click to download Better DMX Jurik Histogram MT4 PDFCan this indicator be used in all timeframes?
Yes, this indicator works across all timeframes but tends to have lower error rates on higher timeframes.
Is this indicator useful for identifying entry and exit points?
Yes, traders can identify these points using strong green or red bars and the oscillator's line crossings.


