![Better Volume New Alerts Indicator MT4 Download – Free – [TFlab]](https://cdn.tradingfinder.com/image/392480/13-122-en-better-volume-new-alerts-mt4-01.webp)
![Better Volume New Alerts Indicator MT4 Download – Free – [TFlab] 0](https://cdn.tradingfinder.com/image/392480/13-122-en-better-volume-new-alerts-mt4-01.webp)
![Better Volume New Alerts Indicator MT4 Download – Free – [TFlab] 1](https://cdn.tradingfinder.com/image/392492/13-122-en-better-volume-new-alerts-mt4-02.webp)
![Better Volume New Alerts Indicator MT4 Download – Free – [TFlab] 2](https://cdn.tradingfinder.com/image/392491/13-122-en-better-volume-new-alerts-mt4-03.webp)
![Better Volume New Alerts Indicator MT4 Download – Free – [TFlab] 3](https://cdn.tradingfinder.com/image/392493/13-122-en-better-volume-new-alerts-mt4-04.webp)
The Better Volume New Alerts Indicator is considered one of the most practical volume-based indicators in forex market and other markets. This trading tool is designed to detect price reversal zones and optimal points to open or close positions.
Unlike the simple volume indicator, which merely shows the volume amount, this tool facilitates market condition analysis through smart color coding and various categorizations.
Better Volume Oscillator Specifications
The features of the Better Volume Display Indicator are presented in the table below:
Indicator Categories: | Oscillators MT4 Indicators Signal & Forecast MT4 Indicators Currency Strength MT4 Indicators |
Platforms: | MetaTrader 4 Indicators |
Trading Skills: | Elementary |
Indicator Types: | Reversal MT4 Indicators |
Timeframe: | Multi-Timeframe MT4 Indicators |
Trading Style: | Day Trading MT4 Indicators Scalper MT4 Indicators Swing Trading MT4 Indicators |
Trading Instruments: | Share Stocks MT4 Indicators Forward Market MT4 Indicators Indices Market MT4 Indicators Commodity Market MT4 Indicators Stock Market MT4 Indicators Cryptocurrency MT4 Indicators Forex MT4 Indicators |
Better Volume New Alerts Indicator at a Glance
The Better Volume Oscillator with Alerts presents volume data using histogram bars. These bars are generally displayed in six different colors, including:
- Sky Blue: Indicates very high volume near price peaks
- Silver: Normal volume with no particular directional bias
- Red: Low volume during market indecision
- Light Blue: High volume within a narrow price range
- Yellow: Low volume at bottom points
- Purple: Peak volume with high volatility
Bullish Trend Conditions
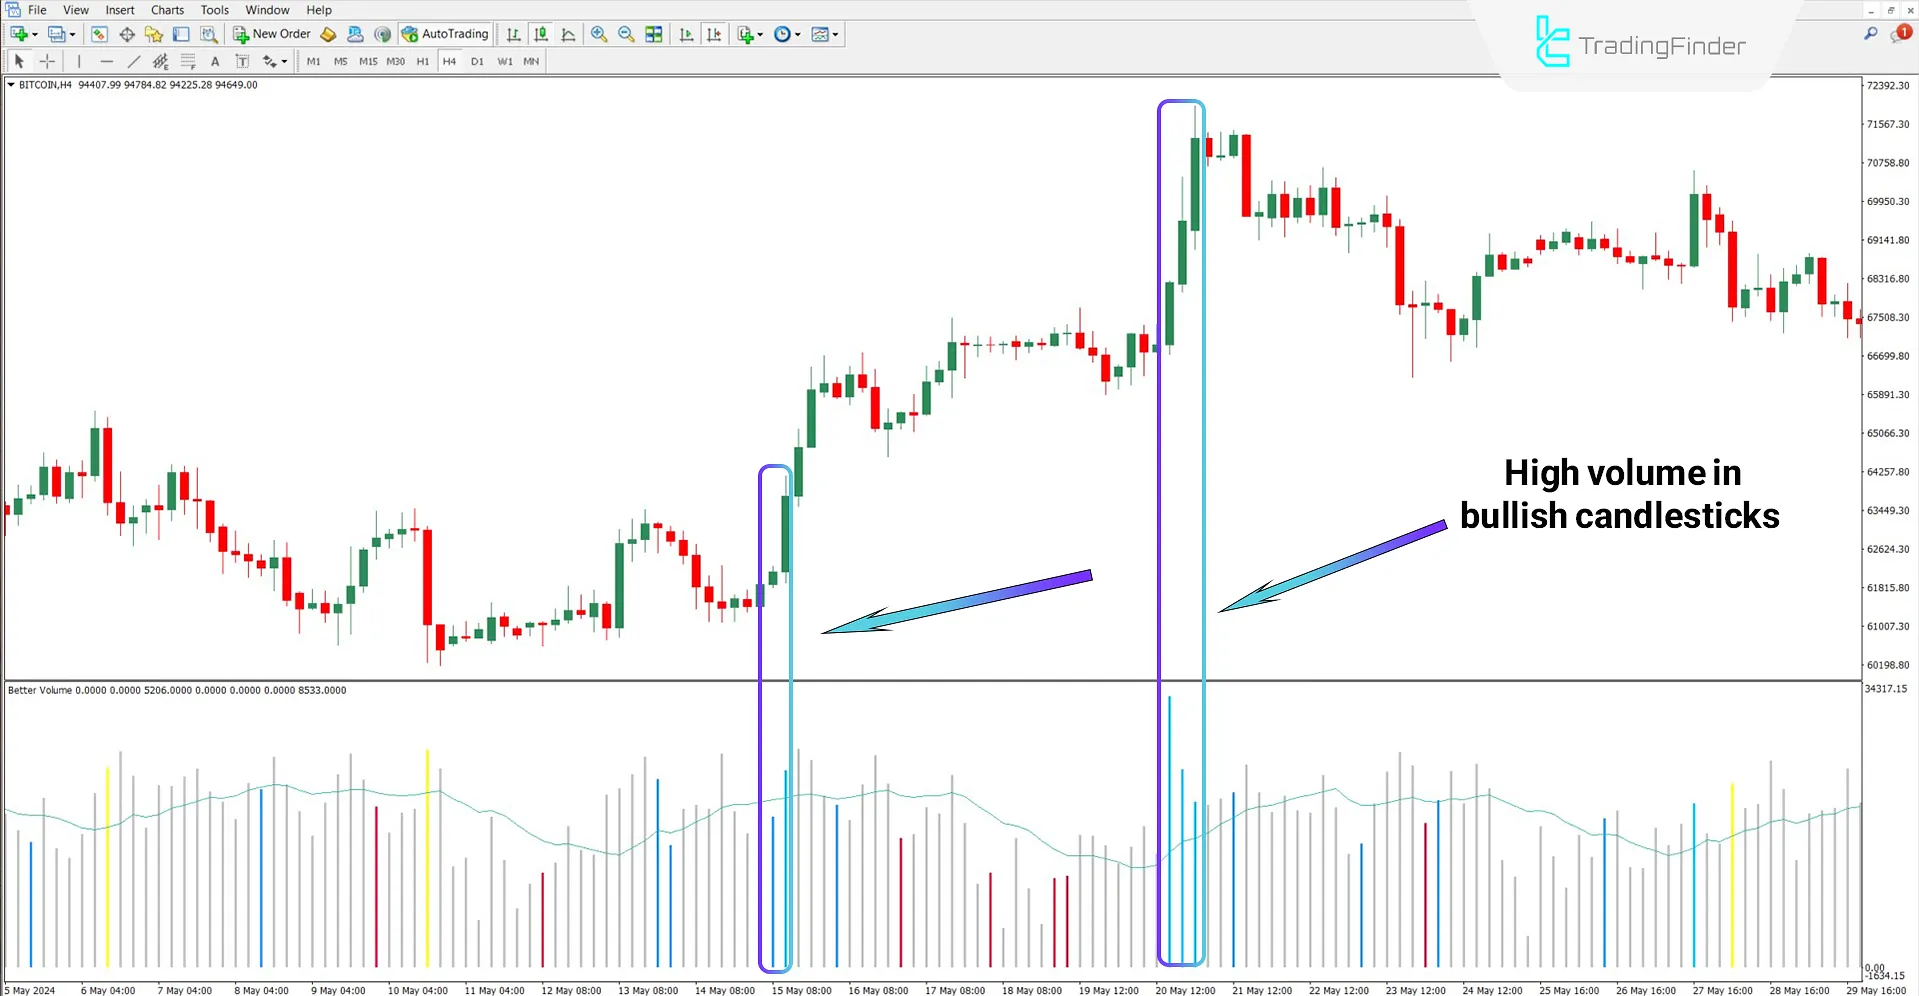
According to the Bitcoin (BTC) chart on the 4-hour timeframe, the oscillator formed two light blue histograms, indicating high volume. These histograms reflect high volume in bullish candles, increasing the likelihood of a trend reversal.

Bearish Trend Conditions
Based on the GBP/USD chart analysis on the 1-hour timeframe, the presence of red, silver, and yellow histograms alongside a pricedrop confirms a bearish trend. Additionally, the formation of silver bars beneath green candles signals low volume in buy trades.

Better Volume Oscillator Settings
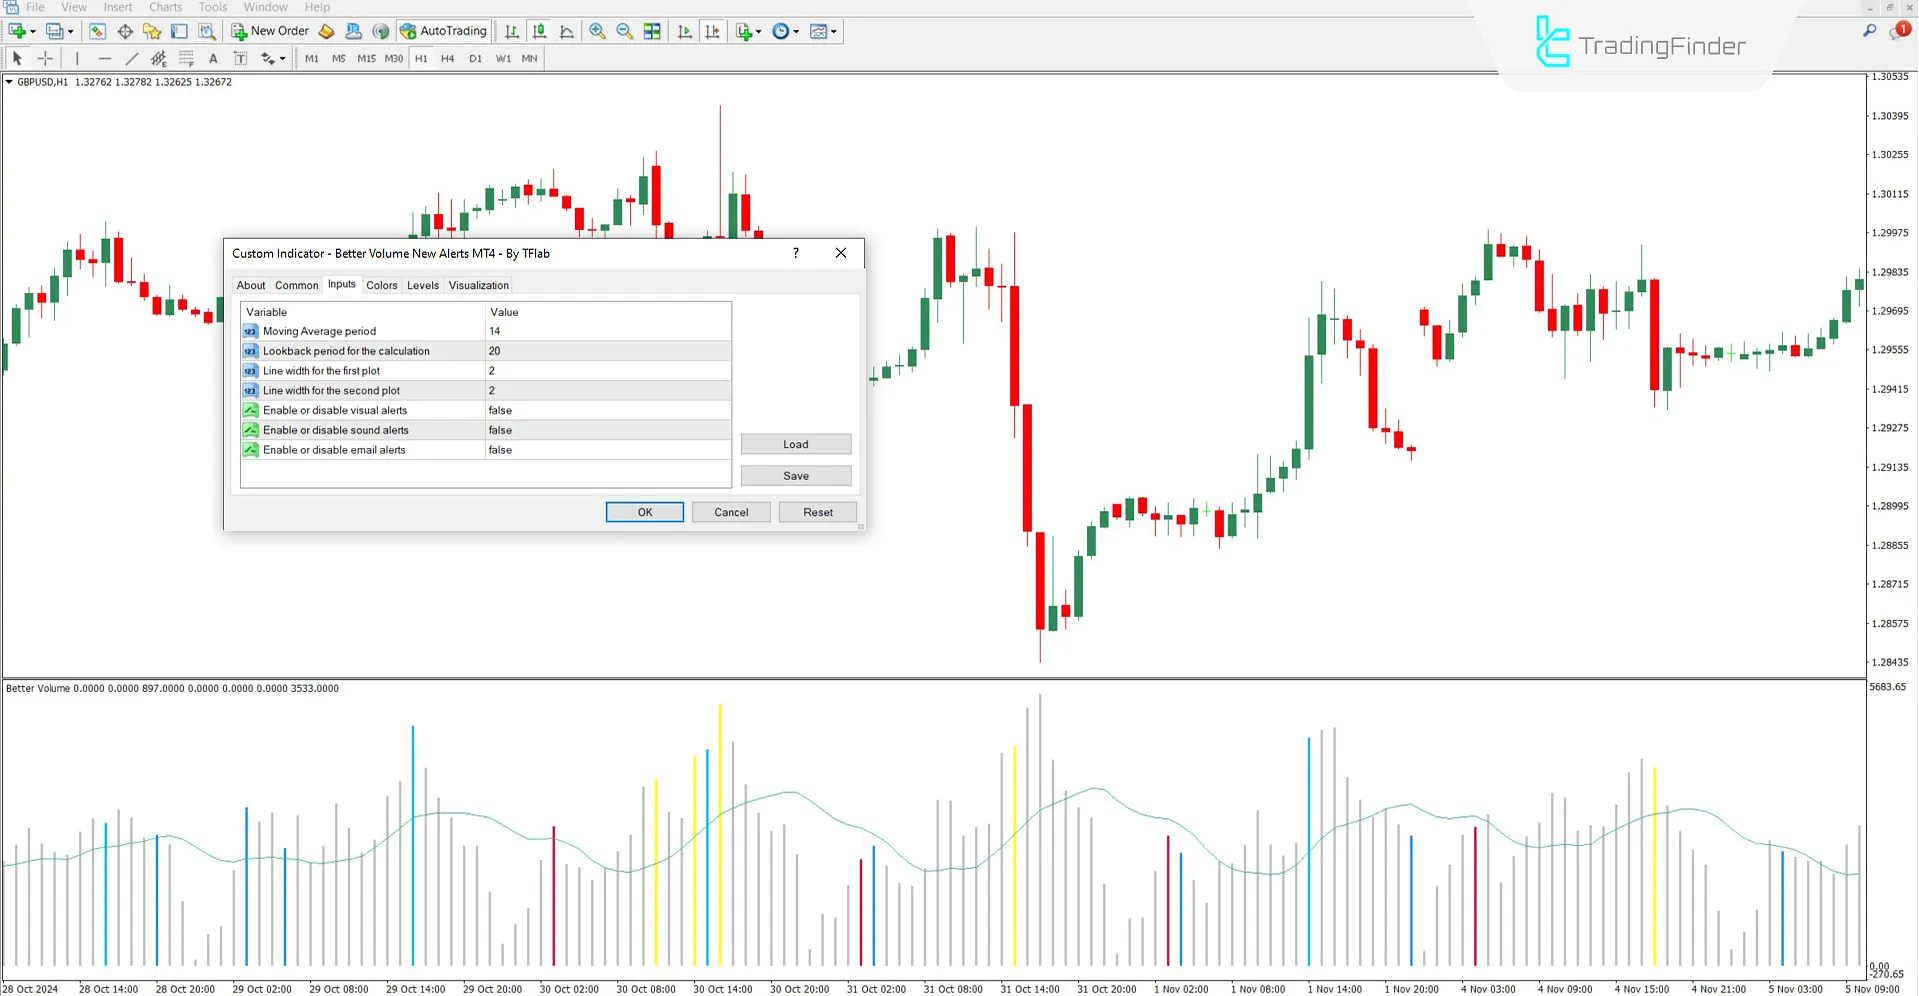
The image below describes the settings of the Better Volume Display Indicator:

- Moving Average period: The period for the volume moving average
- The lookback period for the calculation: Number of candles used for index calculations
- Line width for the first plot: Defines histogram bar thickness
- Line width for the second plot: Defines moving average line thickness
- Enable or disable visual alerts: Activate visual notifications
- Enable or disable sound alerts: Activate sound notifications
- Enable or disable email alerts: Enable email alert delivery
Conclusion
The Better Volume New Alerts Indicator generates histograms and considers tick volume to help identify potential trend reversal zones.
Trading signals in this oscillator are revealed through color changes in the histogram. The Better Volume Display Indicator can also be integrated with various trading strategies, including volume-based strategies.
Better Volume New Alerts MT4 PDF
Better Volume New Alerts MT4 PDF
Click to download Better Volume New Alerts MT4 PDFWhat is the main purpose of this indicator?
Identify key trading volume points that may indicate a trend change or confirmation.
What does the yellow color represent?
It typically signals a "volume bottom," which can indicate the end of a trend.


