![Bollinger Bands RSI Indicator for MT4 Download – Free – [TradingFinder]](https://cdn.tradingfinder.com/image/514842/13-195-en-bollinger-bands-rsi-mt4-01.webp)
![Bollinger Bands RSI Indicator for MT4 Download – Free – [TradingFinder] 0](https://cdn.tradingfinder.com/image/514842/13-195-en-bollinger-bands-rsi-mt4-01.webp)
![Bollinger Bands RSI Indicator for MT4 Download – Free – [TradingFinder] 1](https://cdn.tradingfinder.com/image/514841/13-195-en-bollinger-bands-rsi-mt4-02.webp)
![Bollinger Bands RSI Indicator for MT4 Download – Free – [TradingFinder] 2](https://cdn.tradingfinder.com/image/514843/13-195-en-bollinger-bands-rsi-mt4-03.webp)
![Bollinger Bands RSI Indicator for MT4 Download – Free – [TradingFinder] 3](https://cdn.tradingfinder.com/image/514844/13-195-en-bollinger-bands-rsi-mt4-04.webp)
The Bollinger Bands and RSI Indicator is a combined tool created by integrating two indicators: Bollinger Bands indicator and Relative Strength Index (RSI), within MT4.
This oscillator, by simultaneously analyzing price fluctuations and market momentum, enables the forecasting of reversal points and plays an important role in optimizing entry and exit points.
Specification Table of Bollinger Bands and RSI Oscillator
The following table is designed to display the specifications of the Bollinger Bands and RSI indicator:
Indicator Categories: | Oscillators MT4 Indicators Bands & Channels MT4 Indicators |
Platforms: | MetaTrader 4 Indicators |
Trading Skills: | Elementary |
Indicator Types: | Reversal MT4 Indicators |
Timeframe: | Multi-Timeframe MT4 Indicators |
Trading Style: | Day Trading MT4 Indicators Scalper MT4 Indicators Swing Trading MT4 Indicators |
Trading Instruments: | Stock Market MT4 Indicators Cryptocurrency MT4 Indicators Forex MT4 Indicators |
Bollinger Bands and RSI Indicator at a Glance
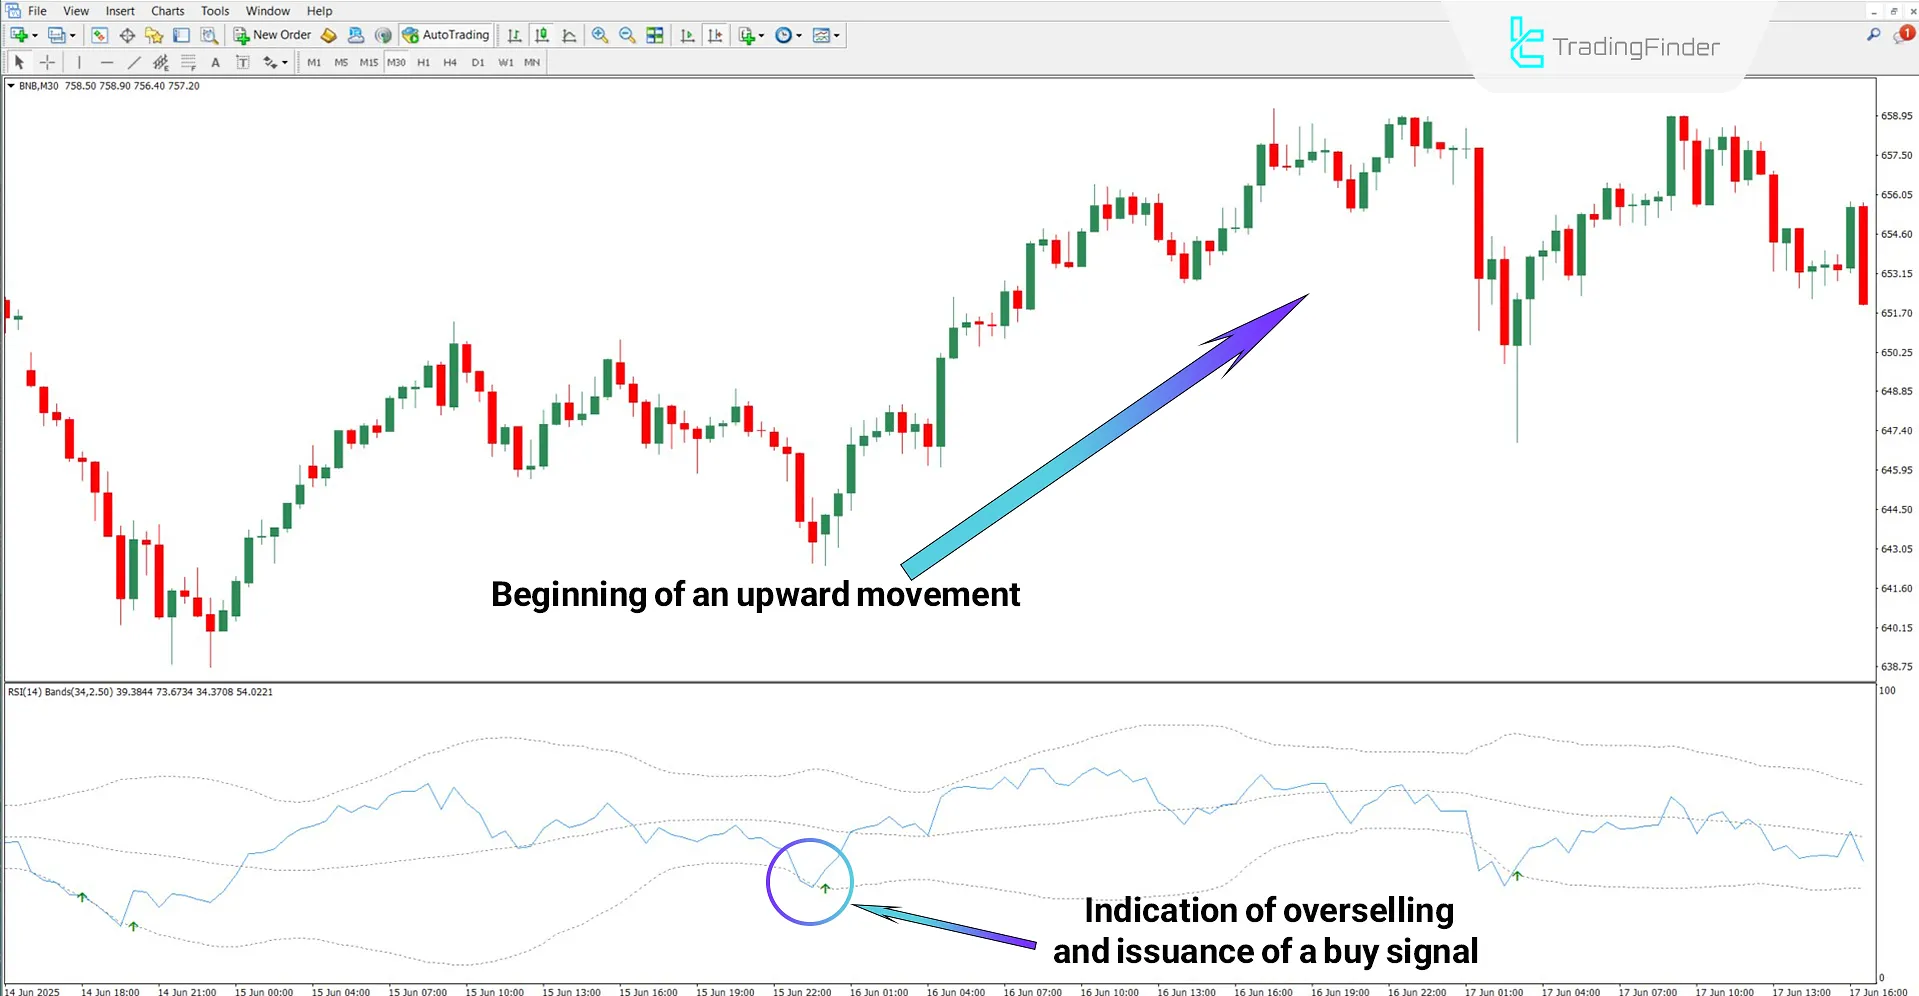
In the Bollinger Bands and RSI oscillator, when the "RSI" line touches the lower band, it indicates oversold conditions, and the indicator issues a buy signal.
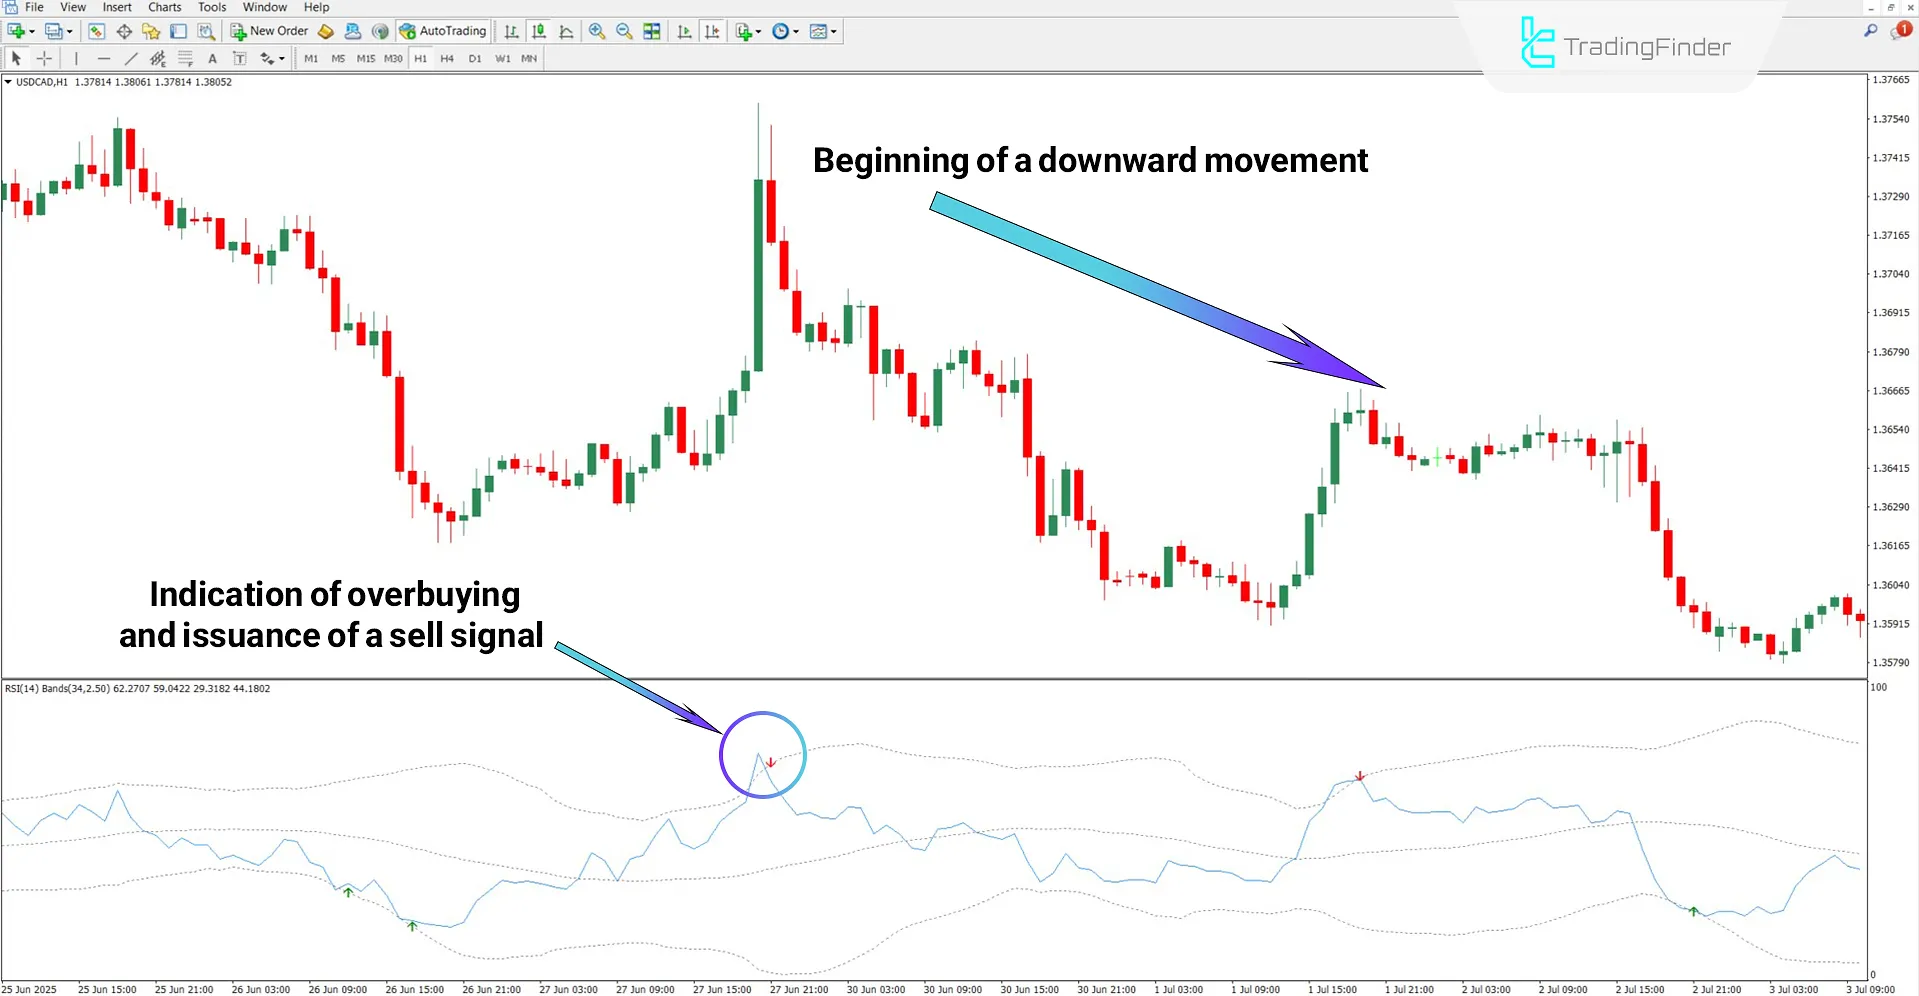
Conversely, when the "RSI" line touches the upper band, it means the price has reached the overbought zone, and the indicator, using a red arrow, signals a sell position.
Buy Position
According to the Binance Coin (BNB) chart in the 30-minute timeframe, when the "RSI" line reached the lower band, it indicated oversold conditions. After that, the indicator identified the trend reversal and issued a buy signal at the same spot using a green arrow.

Sell Position
Based on the USD/CAD currency pair chart in the 1-hour timeframe, the "RSI" line touching the upper band indicates overbought conditions and a price reversal.
The Bollinger Bands and RSI indicator consider the point of contact as a sell signal.

Settings of Bollinger Bands and RSI Indicator
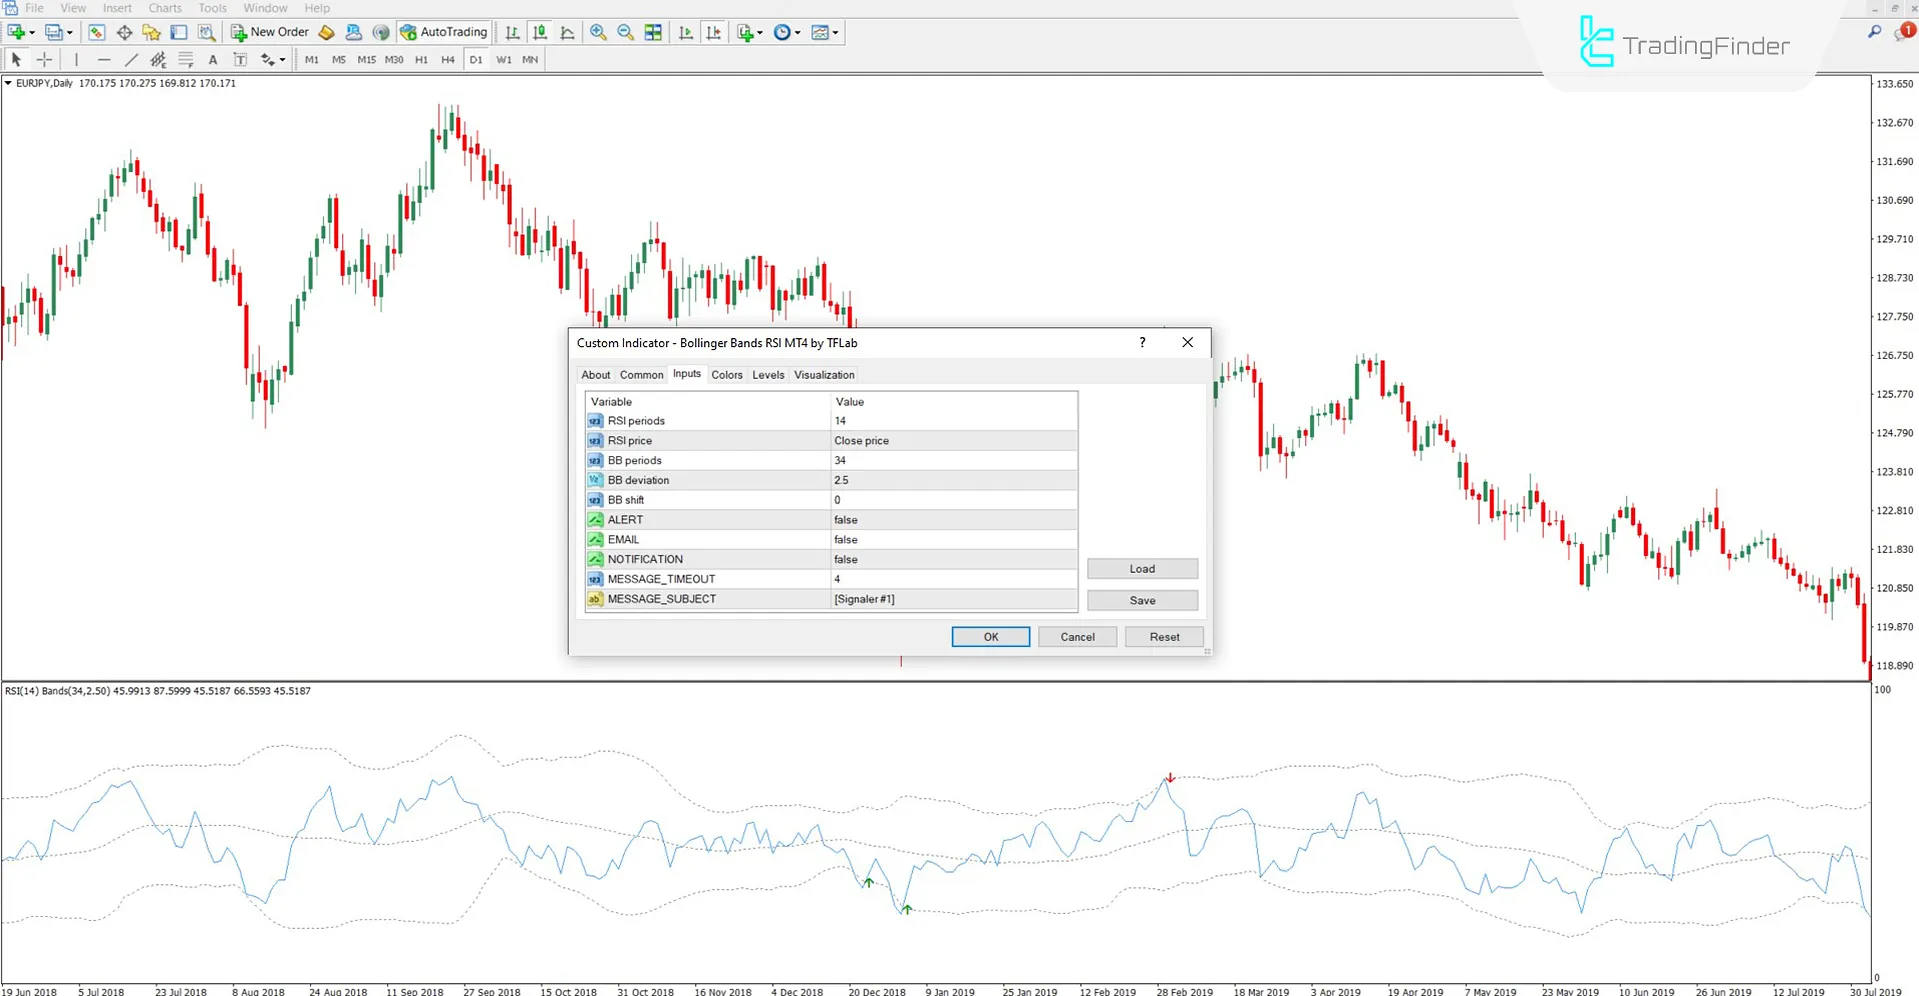
The image below explains the adjustable options in the Bollinger Bands and RSI indicator:

- RSI period: Relative Strength Index calculation period
- RSI price: Type of price used for RSI calculation
- BB periods: Number of periods used to calculate Bollinger Bands
- BB deviation: Standard deviation value for plotting upper and lower bands
- BB shift: Shift amount of Bollinger Bands relative to the chart
- ALERT: Enable alert
- EMAIL: Send alert via email
- NOTIFICATION: Enable notification
- MESSAGE_TIMEOUT: Display duration of the signal alert message
- MESSAGE_SUBJECT: Title or label of the alert message upon sending
Conclusion
The Bollinger Bands and RSI oscillator are a combined tool for identifying overbought and oversold zones in the market. This indicator issues buy signals when the "RSI" line touches the lower band and sell signals when it touches the upper band. The combination of volatility and momentum analysis makes this indicator a suitable tool for all markets, including cryptocurrency, stocks, forex market, and commodities.
Bollinger Bands RSI Indicator MT4 PDF
Bollinger Bands RSI Indicator MT4 PDF
Click to download Bollinger Bands RSI Indicator MT4 PDFDoes this indicator issue signal in higher timeframes as well?
Yes, the Bollinger Bands and RSI indicator are capable of providing trading signals in all timeframes.
When is a sell signal issued?
When the "RSI" line touches the upper Bollinger Band, the indicator issues a sell signal with a red arrow.


