![Bollinger Squeeze Advanced Indicator for MT4 Download – Free – [TradingFinder]](https://cdn.tradingfinder.com/image/462446/13-168-en-bollinger-squeeze-advanced-mt4-01.webp)
![Bollinger Squeeze Advanced Indicator for MT4 Download – Free – [TradingFinder] 0](https://cdn.tradingfinder.com/image/462446/13-168-en-bollinger-squeeze-advanced-mt4-01.webp)
![Bollinger Squeeze Advanced Indicator for MT4 Download – Free – [TradingFinder] 1](https://cdn.tradingfinder.com/image/462445/13-168-en-bollinger-squeeze-advanced-mt4-02.webp)
![Bollinger Squeeze Advanced Indicator for MT4 Download – Free – [TradingFinder] 2](https://cdn.tradingfinder.com/image/462448/13-168-en-bollinger-squeeze-advanced-mt4-03.webp)
![Bollinger Squeeze Advanced Indicator for MT4 Download – Free – [TradingFinder] 3](https://cdn.tradingfinder.com/image/462463/13-168-en-bollinger-squeeze-advanced-mt4-04.webp)
The Bollinger Squeeze Advanced Indicator is designed to identify price squeeze phases in the MetaTrader 4 platform. This trading tool appears on the chart as a series of histograms along with a swinging line, forecasting potential strong movements.
In the Advanced Bollinger Pressure Oscillator, green bars indicate bullish trends, red bars signal bearish trends, and blue bars show Bollinger Band squeeze.
Specification Table of the Advanced Bollinger Pressure Oscillator
The features of the Advanced Bollinger Band Squeeze Indicator are as follows.
Indicator Categories: | Signal & Forecast MT4 Indicators Currency Strength MT4 Indicators Trading Assist MT4 Indicators |
Platforms: | MetaTrader 4 Indicators |
Trading Skills: | Intermediate |
Indicator Types: | Reversal MT4 Indicators |
Timeframe: | Multi-Timeframe MT4 Indicators |
Trading Style: | Day Trading MT4 Indicators Scalper MT4 Indicators Swing Trading MT4 Indicators |
Trading Instruments: | Stock Market MT4 Indicators Cryptocurrency MT4 Indicators Forex MT4 Indicators |
Overview of the Bollinger Squeeze Advanced Indicator
The Bollinger Squeeze Advanced Indicator features eight different technical indicators, including RSI, CCI, Momentum, and more, which can be configured from the settings. Users can choose the desired indicator to change the oscillator's calculations.
Note: By default, the Advanced Bollinger Pressure Oscillator performs its calculations based on the DeMarker indicator.
Bullish Trend Conditions
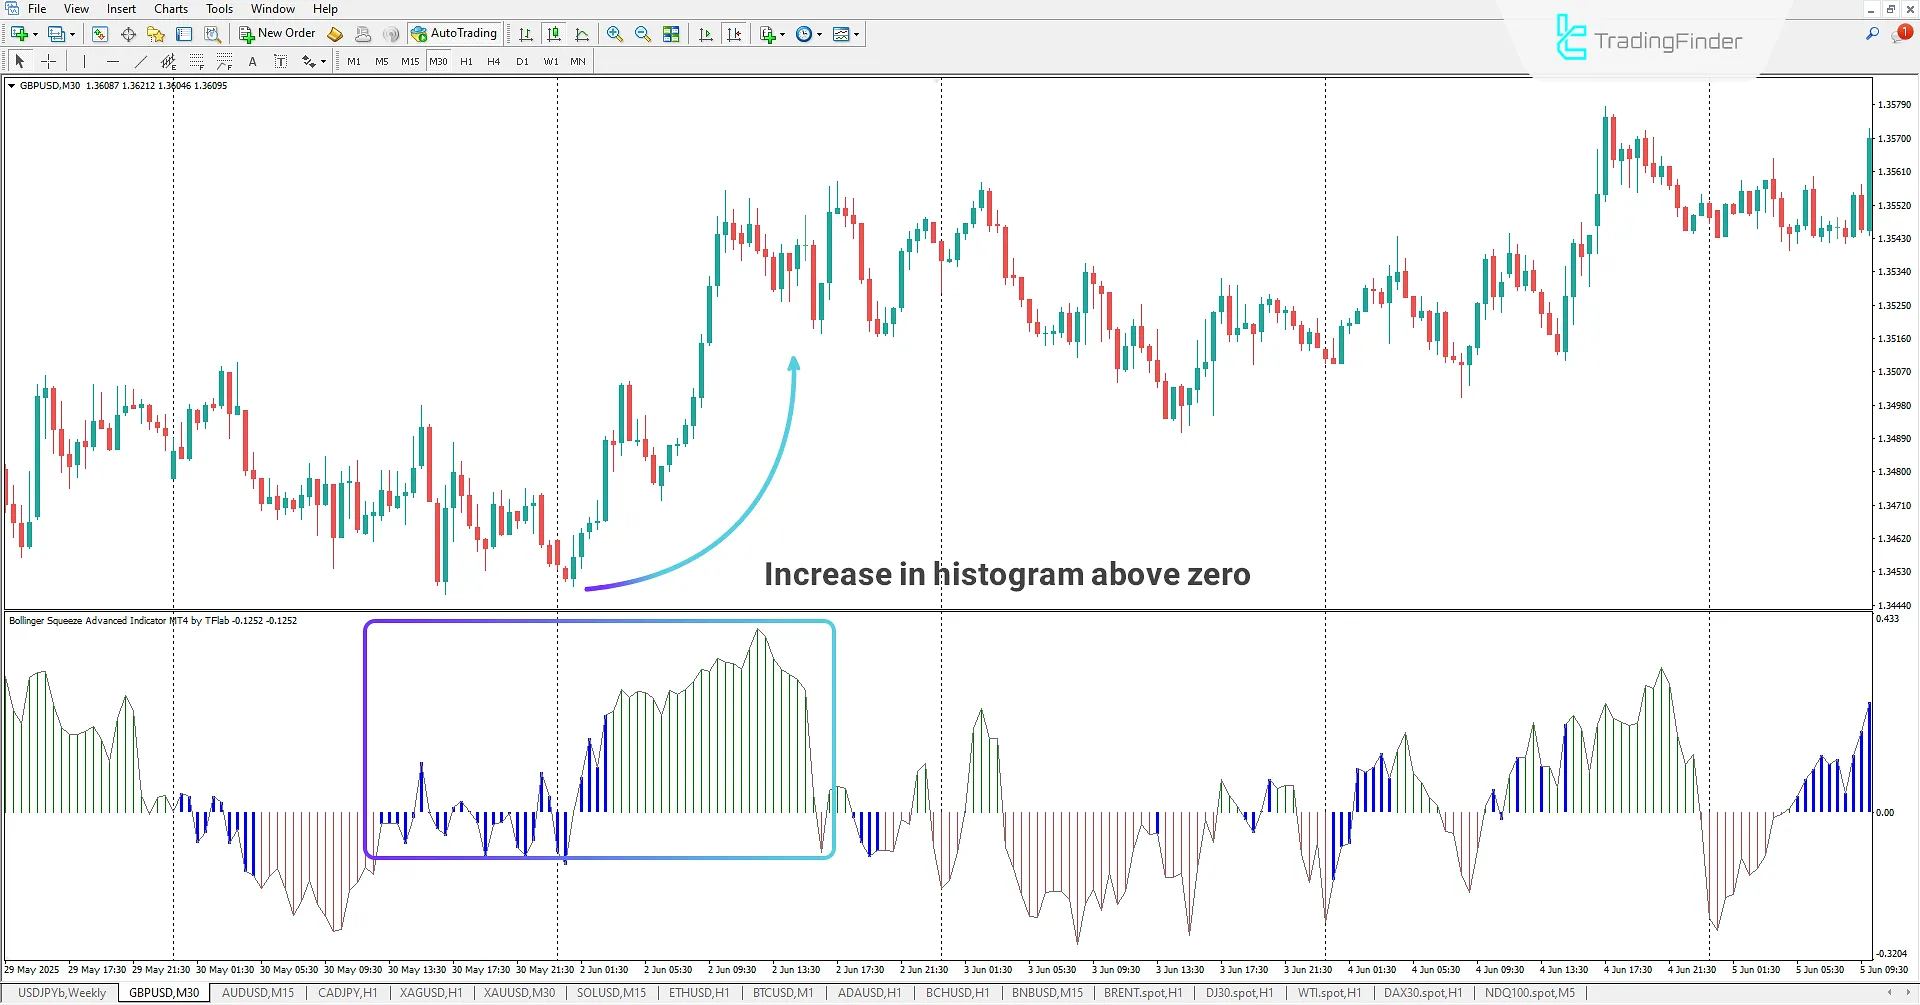
According to the GBP/USD 30-minute chart, blue bars indicate a price squeeze. A change in histogram color from blue to green signals the beginning of a bullish trend.

Bearish Trend Conditions
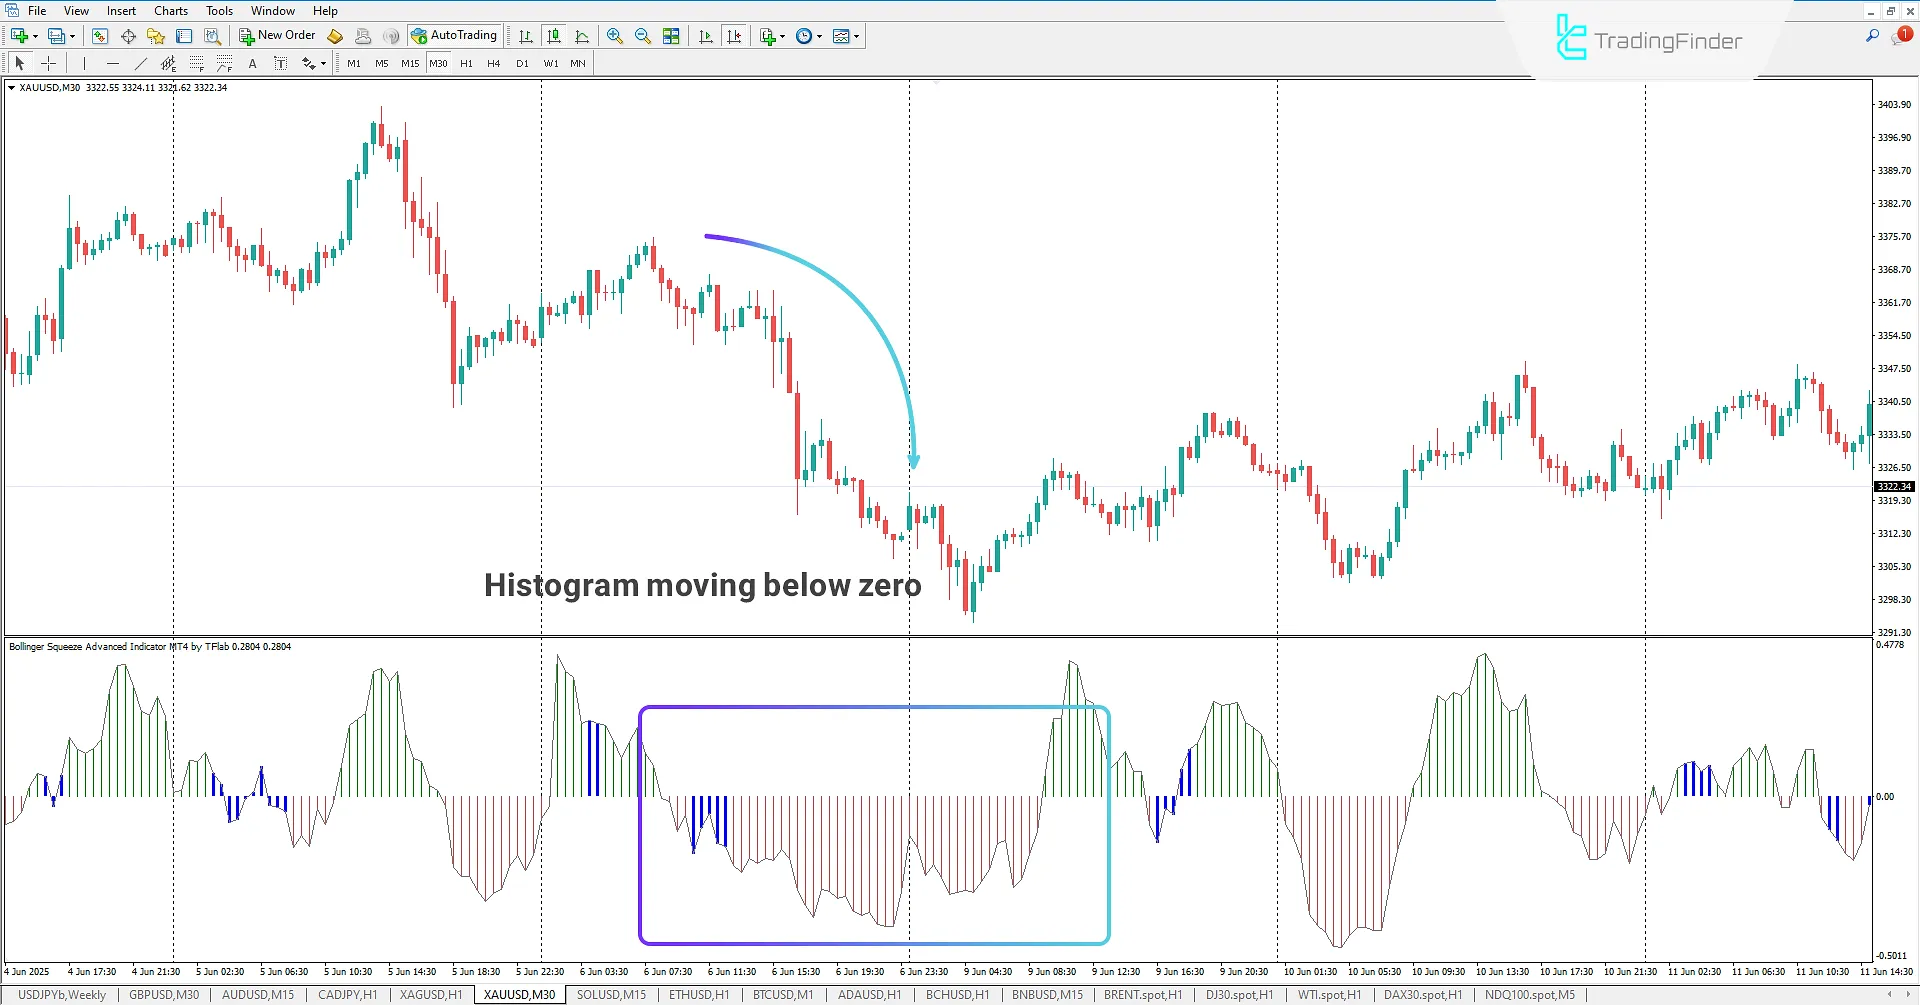
Based on the XAU/USD 30-minute chart, a negative histogram direction indicates a decline in buying pressure. Furthermore, a color change from blue (squeeze) to red signals the start of a bearish trend.

Bollinger Band Squeeze Advanced Indicator Settings
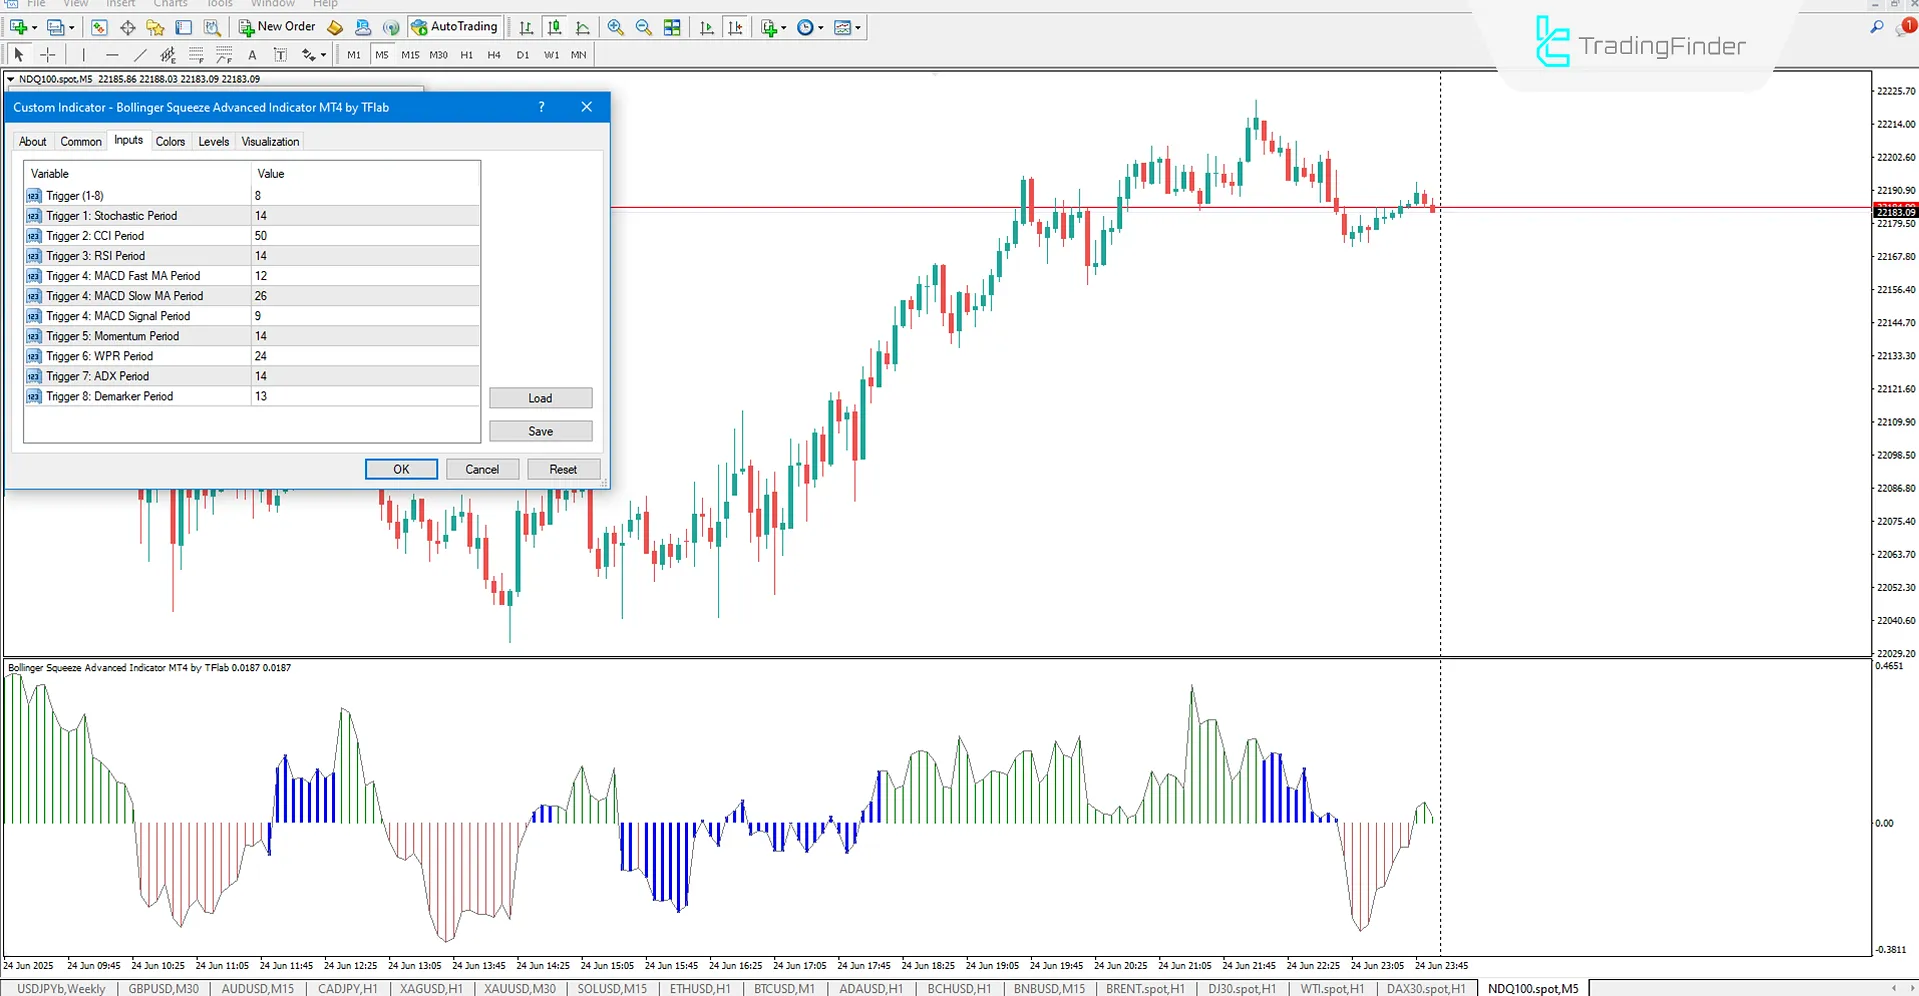
The configurable parameters in the Advanced Bollinger Pressure Oscillator are listed below:

- Trigger: Select indicator number from 1 to 8
- Stochastic Period: Period for calculating the Stochastic oscillator
- CCI Period: Calculation period for the CCI
- RSI Period: Calculation period for the RSI
- MACD Fast MA Period: Fast moving average period in MACD
- MACD Slow MA Period: Slow moving average period in MACD
- MACD Signal Period: Signal line period in MACD
- Momentum Period: Period for Momentum calculation
- WPR Period: Calculation period for Williams %R
- ADX Period: Period for the ADX indicator
- DeMarker Period: Calculation period for the DeMarker indicator
Conclusion
The Advanced Bollinger Pressure Oscillator is a comprehensive tool designed to identify price squeeze phases and signal the beginning of strong market moves.
It generates signals based on histogram color changes, where green bars indicate a bullish trend, red bars represent a bearish trend, and blue bars highlight periods of Bollinger Band squeeze.
Versatile in application, this indicator can be effectively used across all markets, including cryptocurrencies, stocks, Forex, andcommodities.
Bollinger Squeeze Advanced MT4 PDF
Bollinger Squeeze Advanced MT4 PDF
Click to download Bollinger Squeeze Advanced MT4 PDFWhat do the blue bars indicate?
Blue histograms signify Bollinger Band compression and low market volatility.
Does the Advanced Bollinger Pressure Oscillator generate buy/sell signals?
Not directly, but it effectively highlights optimal entry and exit zones.


