![Bulls Eye Forecaster Indicator for MetaTrader 4 Download - [TradingFinder]](https://cdn.tradingfinder.com/image/435024/2-94-en-bulls-eye-forecaster-indicator-mt4-1.webp)
![Bulls Eye Forecaster Indicator for MetaTrader 4 Download - [TradingFinder] 0](https://cdn.tradingfinder.com/image/435024/2-94-en-bulls-eye-forecaster-indicator-mt4-1.webp)
![Bulls Eye Forecaster Indicator for MetaTrader 4 Download - [TradingFinder] 1](https://cdn.tradingfinder.com/image/435013/2-94-en-bulls-eye-forecaster-indicator-mt4-2.webp)
![Bulls Eye Forecaster Indicator for MetaTrader 4 Download - [TradingFinder] 2](https://cdn.tradingfinder.com/image/435025/2-94-en-bulls-eye-forecaster-indicator-mt4-3.webp)
The Bulls Eye Forecaster Indicator is a tool designed for predicting trend reversals and detecting momentum in financial markets such as Forex and cryptocurrencies.
This MetaTrader 4 indicator uses red dotted lines over the price chart to display potential trend reversal zones, continuation areas, and suitable regions for trade entries and exits.
Bulls Eye Forecaster Indicator Table
The general specifications of the Bulls Eye Forecaster Trend Prediction Indicator are summarized in the table below:
Indicator Categories: | Currency Strength MT4 Indicators Trading Assist MT4 Indicators Momentum Indicators in MT4 |
Platforms: | MetaTrader 4 Indicators |
Trading Skills: | Intermediate |
Indicator Types: | Reversal MT4 Indicators |
Timeframe: | Multi-Timeframe MT4 Indicators |
Trading Style: | Intraday MT4 Indicators |
Trading Instruments: | Share Stocks MT4 Indicators Indices Market MT4 Indicators Commodity Market MT4 Indicators Stock Market MT4 Indicators Cryptocurrency MT4 Indicators Forex MT4 Indicators |
Indicator Overview
The Bulls Eye Forecaster indicator operates based on price analysis and the behavior of buyers and sellers.
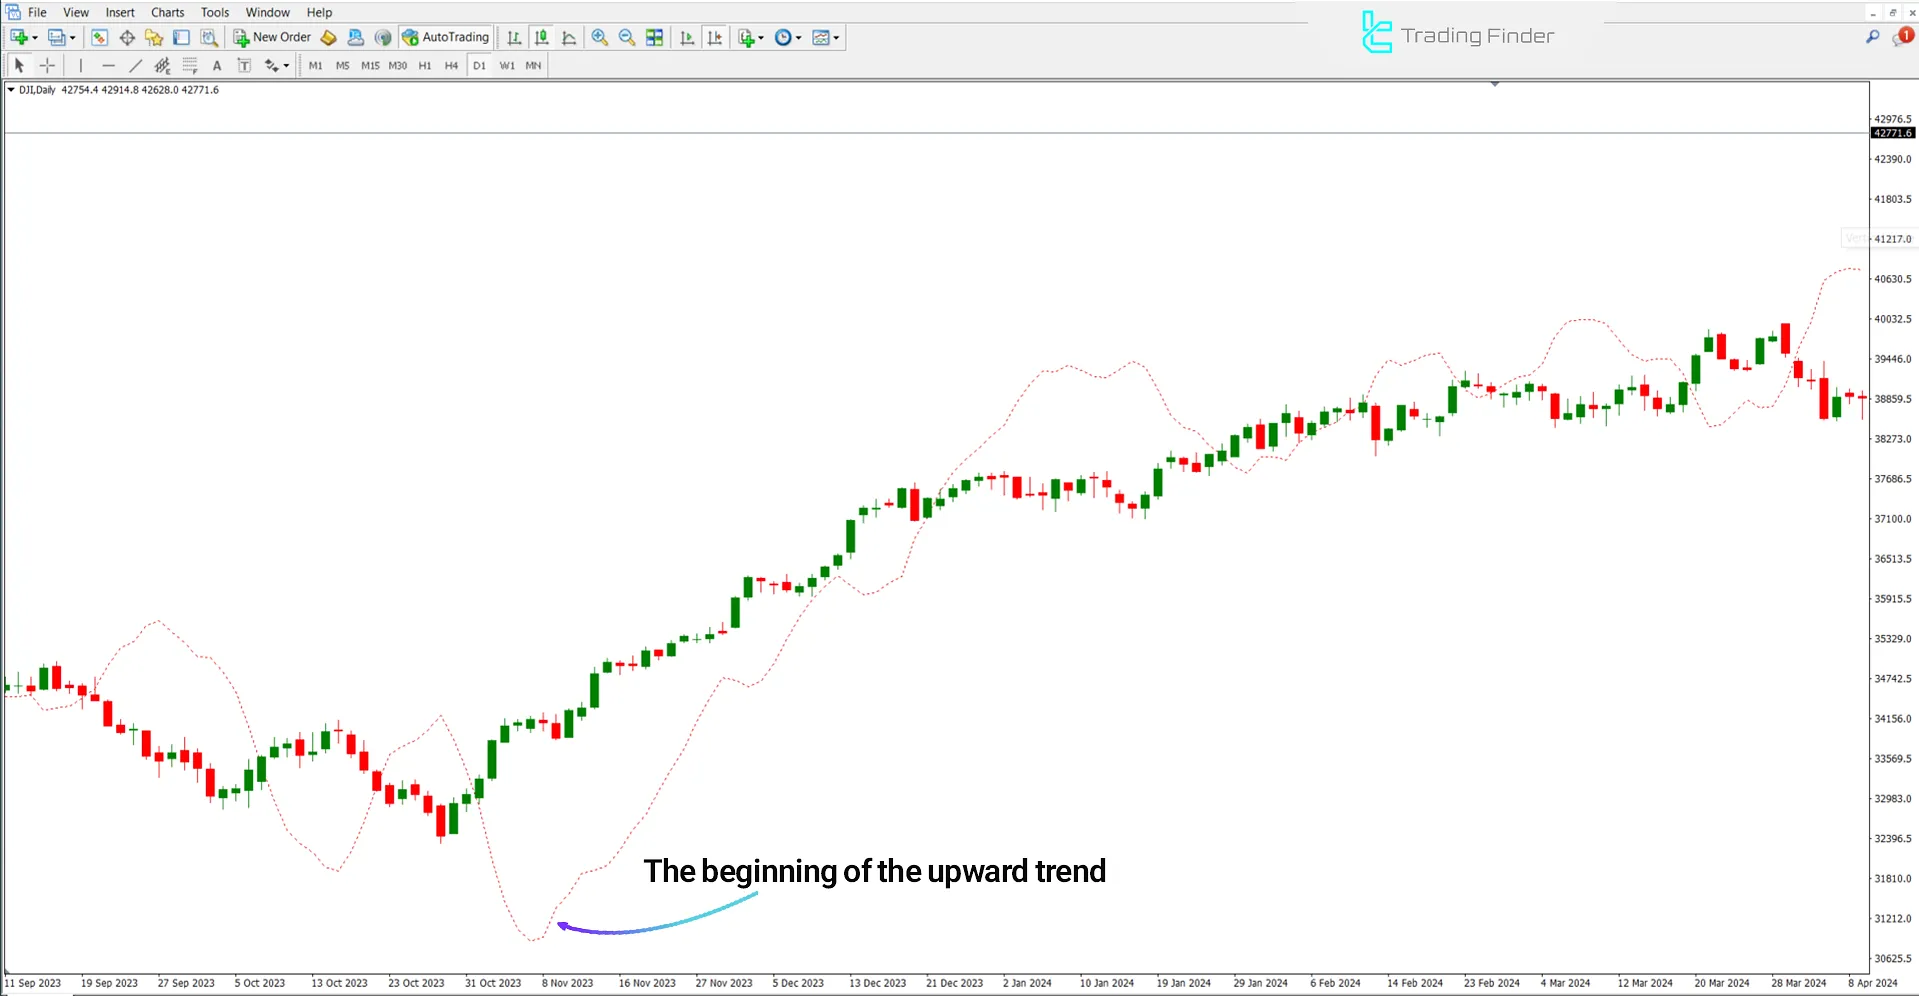
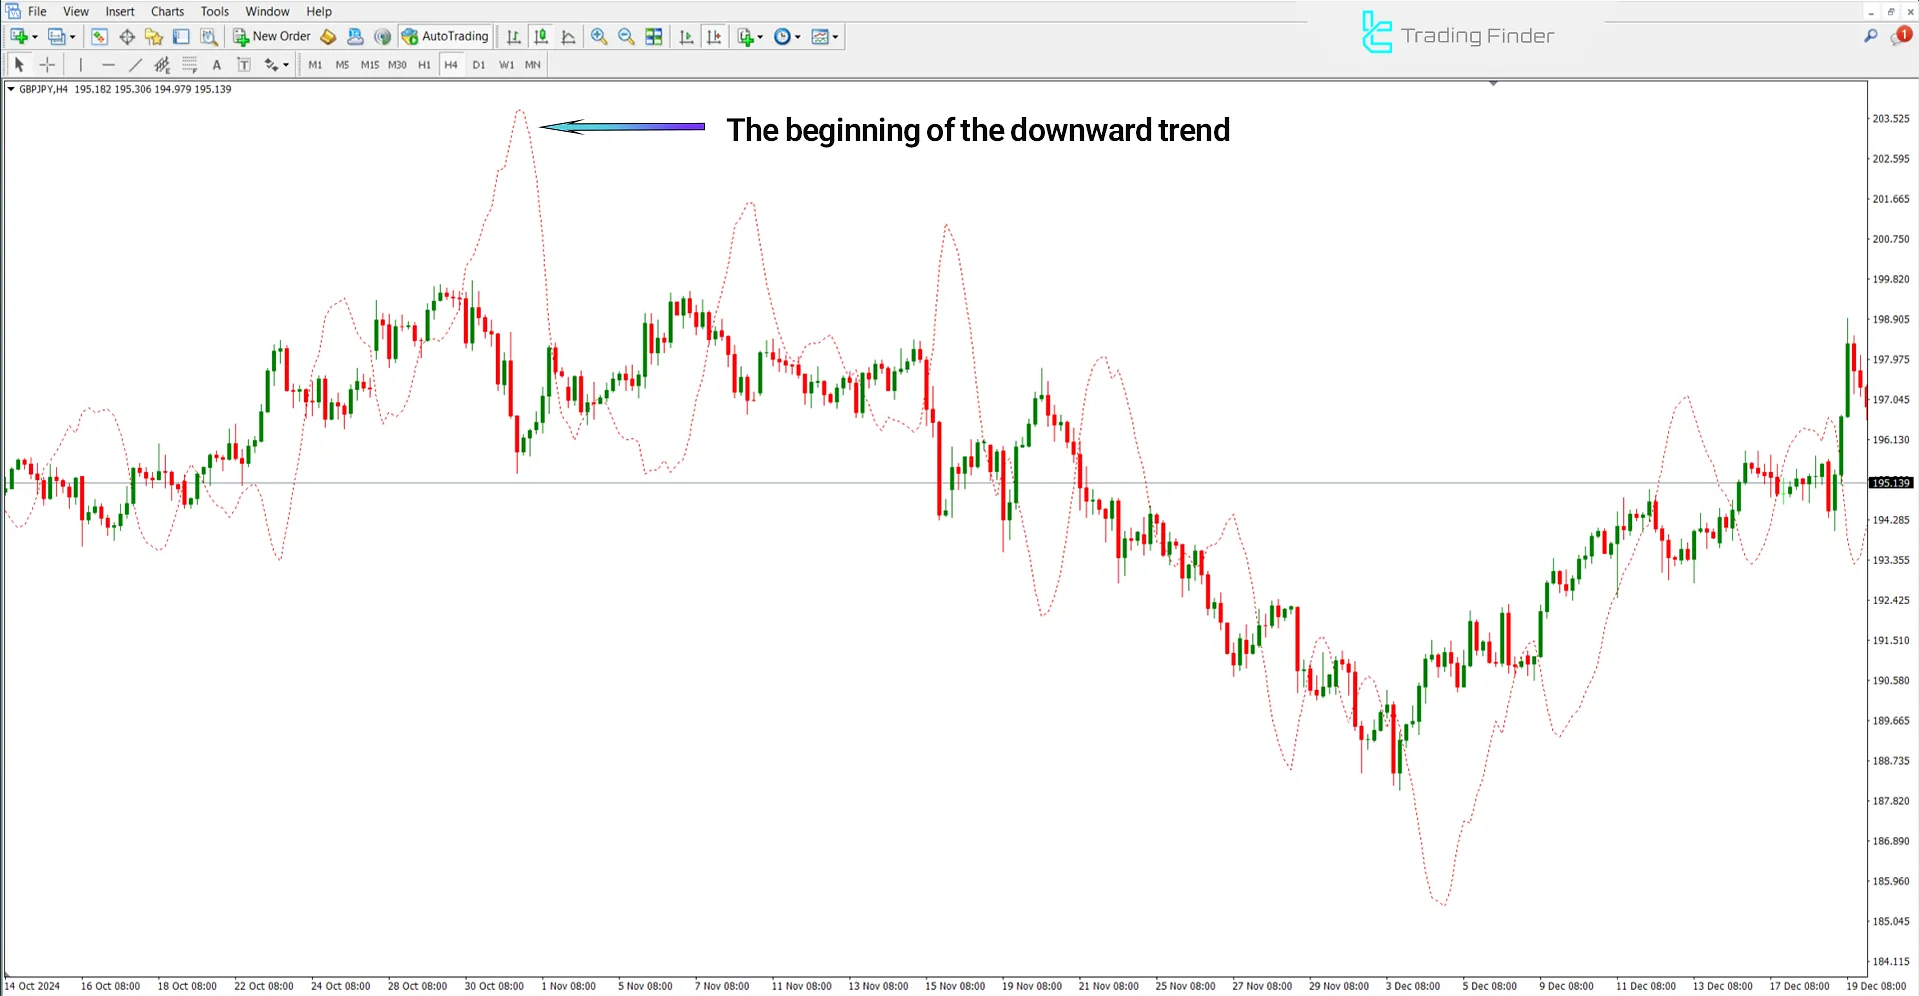
When dotted lines appear below the candlesticks, it signals a bullish market tendency. Conversely, when these lines are placed above the price, it indicates a bearish trend.
One of the key features of the Bulls Eye Forecaster is its high capability in quickly identifying trend changes in the market.
Uptrend Conditions
The image below shows the daily chart of the Dow Jones Index (DJI). When the indicator’s red dotted line moves below the candles and has notable depth, this indicates strong bullish momentum.
In such conditions, the generated zone can be considered a suitable area for buy trade entries.

Downtrend Conditions
The chart below shows the 4-hour price chart of the British Pound vs. Japanese Yen (GBP/JPY) currency pair.
When the red dotted line appears above the candles and the distance between them increases, it signals rising selling pressure and strengthening bearish momentum, making it a good area for sell trade entries.

Conclusion
The Bulls Eye Forecaster trend prediction indicator is a technical analysis tool that identifies potential trend reversals and momentum shifts by evaluating the position of lines relative to the price.
It highlights ideal trade entry and exit zones directly on the chart.
Bulls Eye Forecaster MT4 PDF
Bulls Eye Forecaster MT4 PDF
Click to download Bulls Eye Forecaster MT4 PDFIs the Bulls Eye Forecaster Indicator effective in ranging markets?
No: This trading tool is not effective in ranging (sideways) markets.
How can the Bulls Eye Forecaster Indicator be used to set stop-loss levels?
In buy positions, the stop-loss is placed below the last low before the indicator line. In sell positions, it is placed above the last high before the line.


