![Buy Sell Pressure Indicator for MetaTrader 4 Download - Free - [TradingFinder]](https://cdn.tradingfinder.com/image/238774/4-19-en-buy-sell-pressure-mt4-1.webp)
![Buy Sell Pressure Indicator for MetaTrader 4 Download - Free - [TradingFinder] 0](https://cdn.tradingfinder.com/image/238774/4-19-en-buy-sell-pressure-mt4-1.webp)
![Buy Sell Pressure Indicator for MetaTrader 4 Download - Free - [TradingFinder] 1](https://cdn.tradingfinder.com/image/238753/4-19-en-buy-sell-pressure-mt4-3.webp)
![Buy Sell Pressure Indicator for MetaTrader 4 Download - Free - [TradingFinder] 2](https://cdn.tradingfinder.com/image/238752/4-19-en-buy-sell-pressure-mt4-2.webp)
![Buy Sell Pressure Indicator for MetaTrader 4 Download - Free - [TradingFinder] 3](https://cdn.tradingfinder.com/image/238741/4-19-en-buy-sell-pressure-mt4-4.webp)
The Buy Sell Pressure Indicator is a practical tool in MetaTrader 4 indicators, allowing traders to identify market momentum effectively.
By analyzing real-time market momentum, this indicator displays buying pressure and selling pressure within its oscillator window. Due to its simple trading rules and ease of use, it is considered a suitable option for beginner traders.
Indicator Specifications
The key features of this indicator are explained in the table below:
Indicator Categories: | Price Action MT4 Indicators Oscillators MT4 Indicators Currency Strength MT4 Indicators |
Platforms: | MetaTrader 4 Indicators |
Trading Skills: | Elementary |
Indicator Types: | Trend MT4 Indicators Reversal MT4 Indicators |
Timeframe: | Daily & Weekly Timeframe MT4 Indicators |
Trading Style: | Day Trading MT4 Indicators |
Trading Instruments: | Share Stocks MT4 Indicators Forward Market MT4 Indicators Stock Market MT4 Indicators Cryptocurrency MT4 Indicators Forex MT4 Indicators |
Overview of the Indicator
The Buy-Sell Pressure Indicator is an efficient tool for scalpers, enabling quick market momentum identification. The indicator uses a blue line to display buy pressure momentum and a red line to show sell pressure momentum.
Additionally, the overbought and oversold points are updated automatically in real time, making it a practical feature for quick decision-making in volatile markets.
The Indicator in an Uptrend
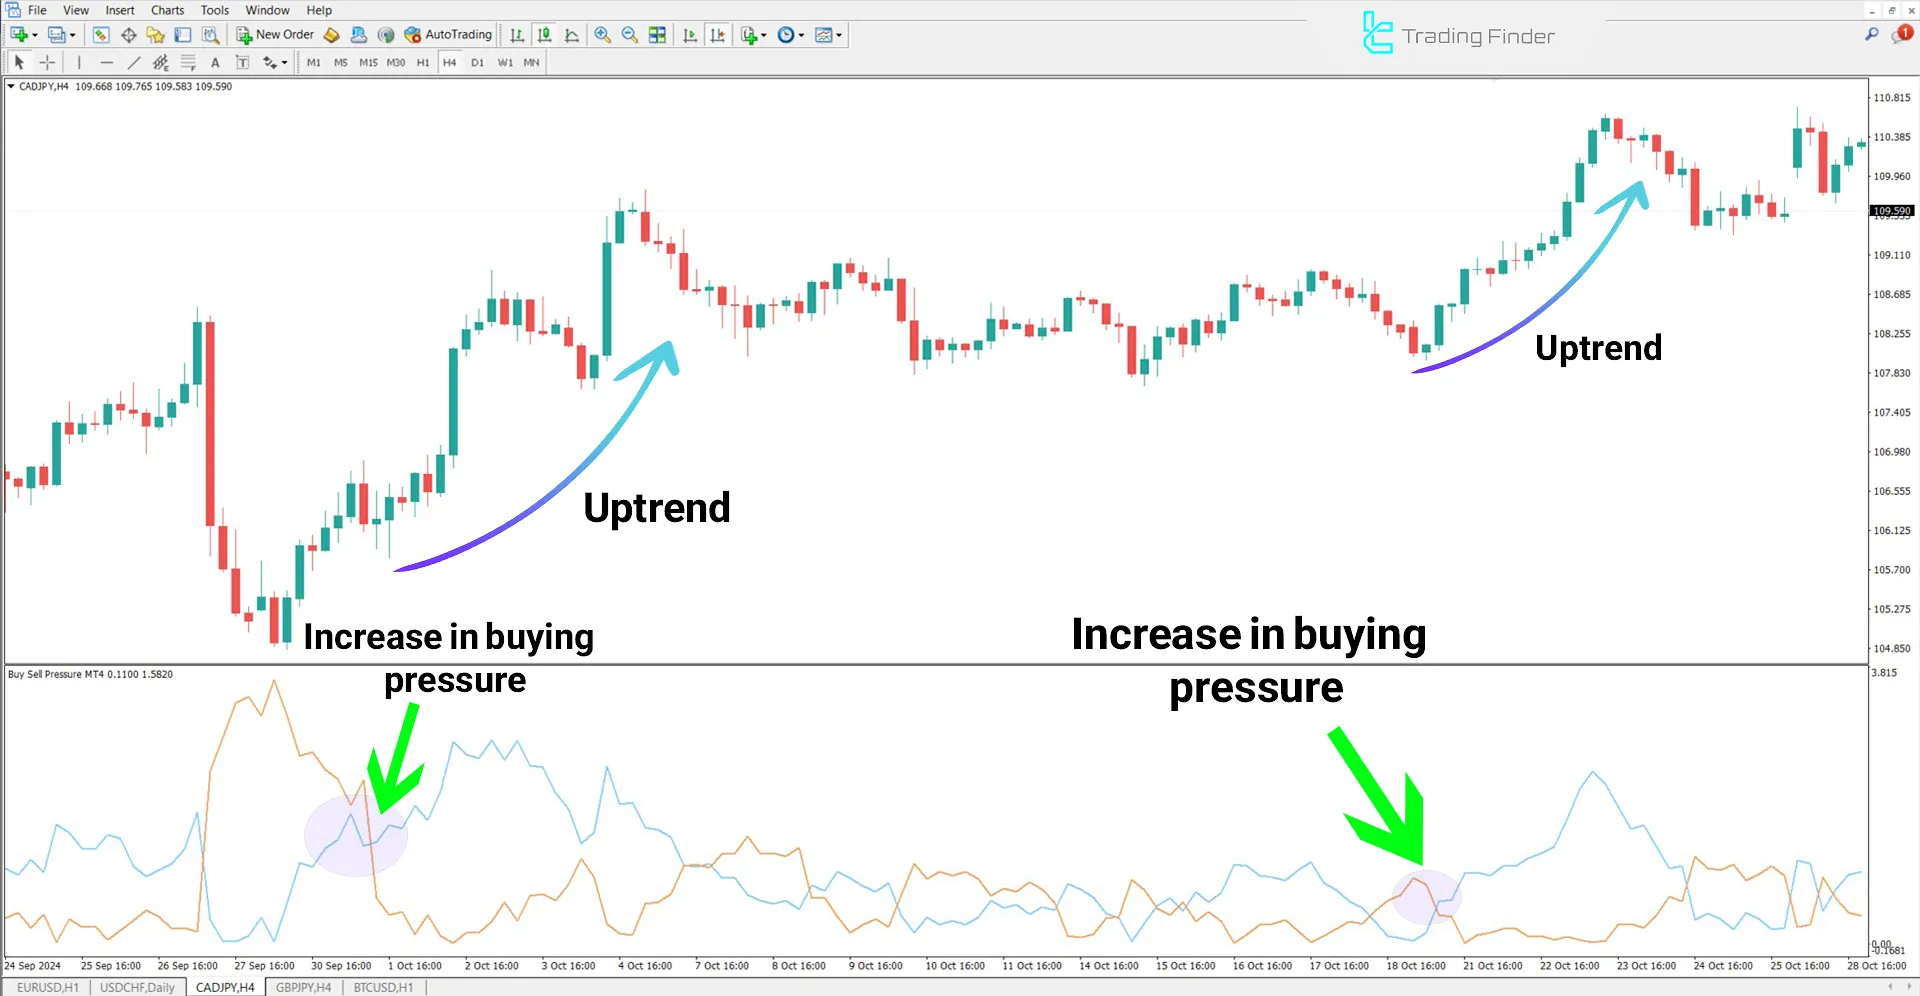
The chart below represents the CAD/JPY currency pair in a 4-hour time frame. In this analysis, the blue line indicates the buying pressure index.
An increase in this pressure has initiated an uptrend, and as the value of this index rises, the likelihood of the continuation of the uptrend also increases.

The Indicator in a Downtrend
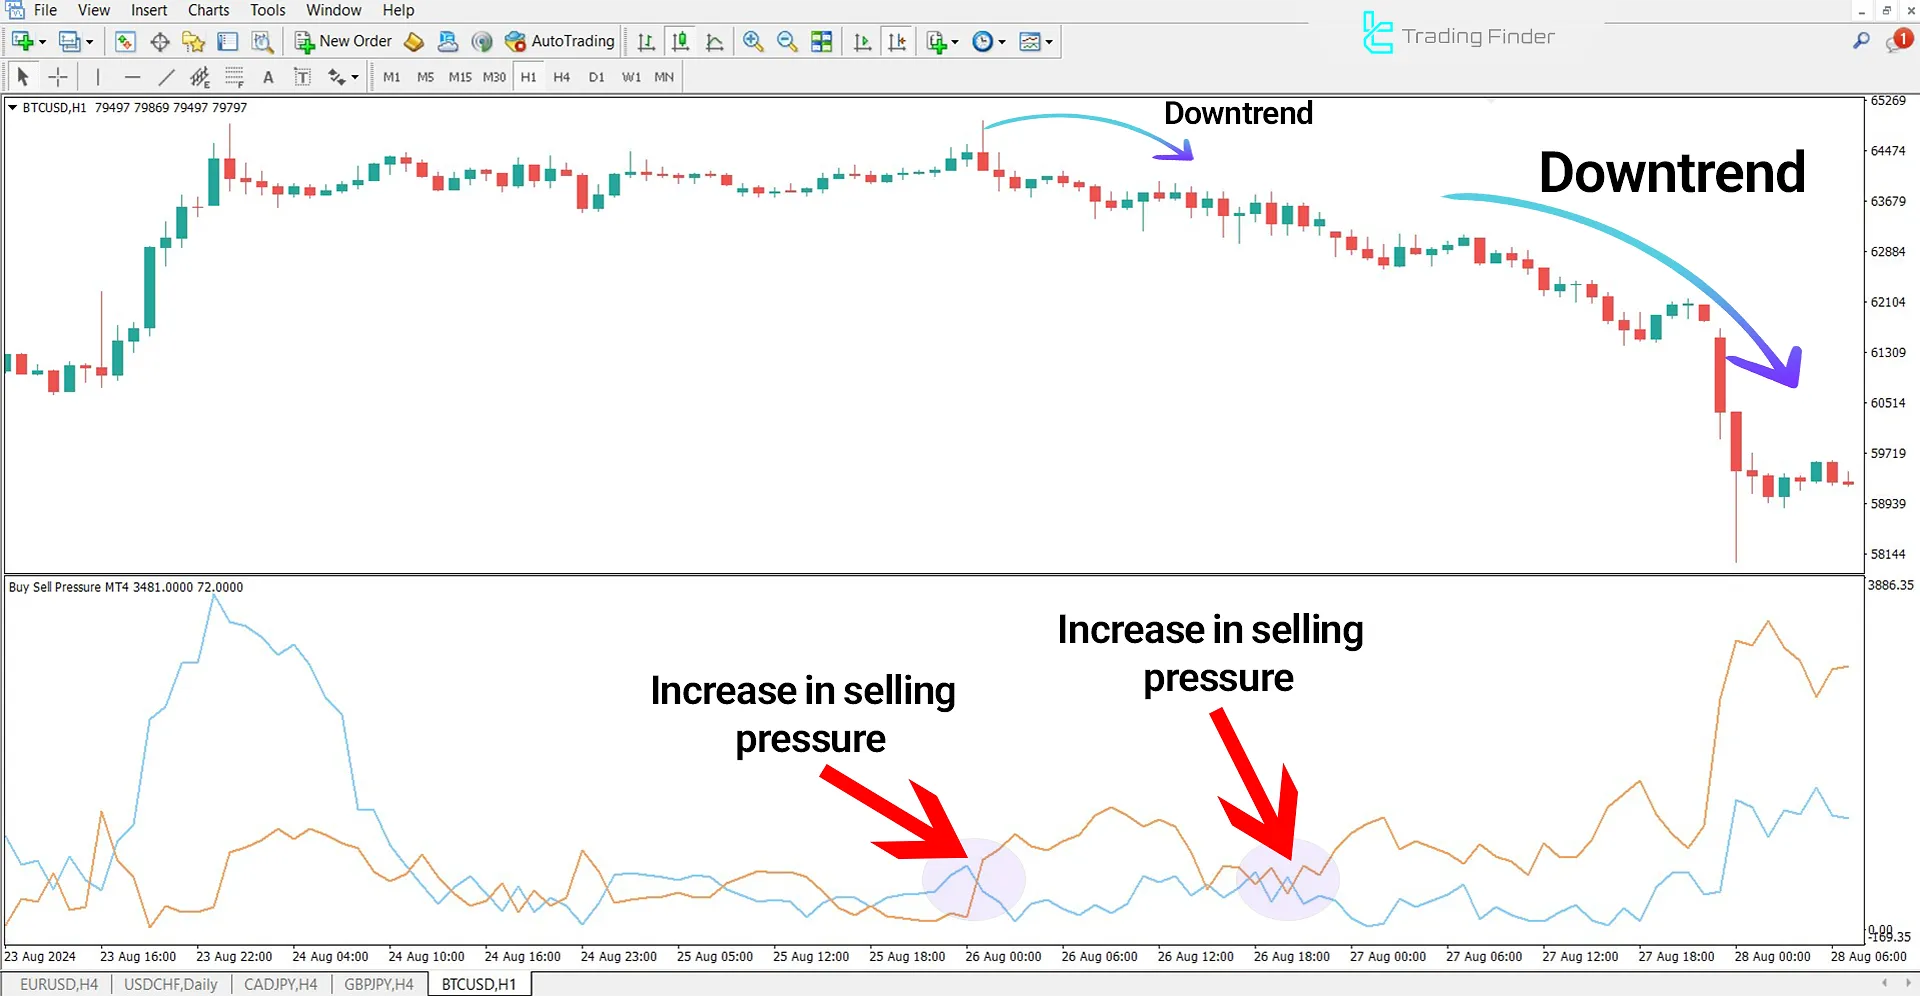
The chart below illustrates the price movement of Bitcoin (BTC) in a 1-hour time frame.
After the blue line crossed below the orange line, weakness in the uptrend became evident. Simultaneously, with the increase in selling pressure, the price has declined.

Indicator Settings
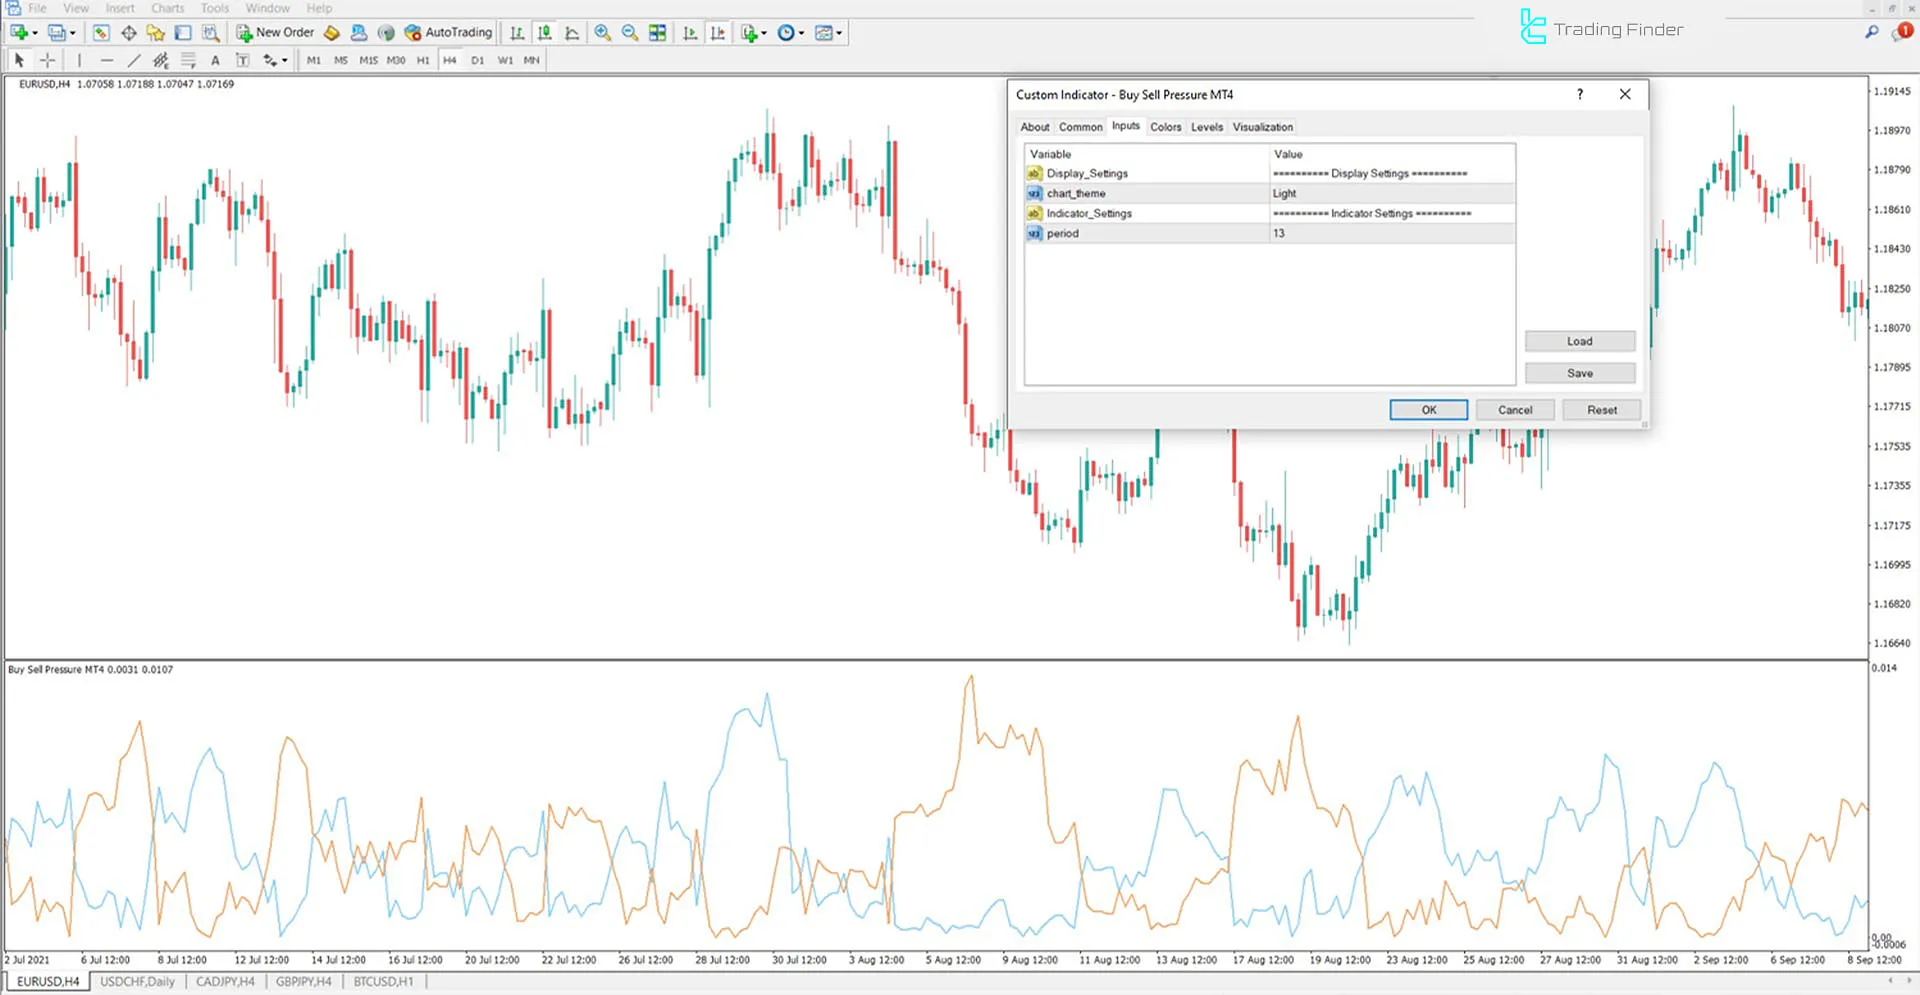
The image below pertains to the adjustable parameters of the indicator:

- Chart Theme: Background color of the chart;
- Period: The calculation period for candles (default is 13).
Conclusion
By utilizing the Buy Sell Pressure Indicator, traders can execute trend-based trading strategies with high precision and greater efficiency.
This indicator allows traders to visually interpret market momentum and strength in a simplified manner on the chart.
Additionally, buying and selling pressure zones in this indicator dynamically adjust in real-time, serving as key points for trade entry decisions.
Buy Sell Pressure MT4 PDF
Buy Sell Pressure MT4 PDF
Click to download Buy Sell Pressure MT4 PDFWhen can this indicator be used?
This indicator can be used anytime and for various Forex pairs and stocks, especially when trends require further confirmation.
Is this indicator only suitable for beginners?
No, this indicator is not just for beginners. Its real-time momentum analysis and precise identification of overbought and oversold zones make it suitable for use in advanced strategies.
THANK YOU ALL GOOD , PLEASE MORE


