![Buy Sell Volume Indicator for MetaTrader 4 Download - [TradingFinder]](https://cdn.tradingfinder.com/image/396638/2-71-en-buy-sell-volume-mt4-1.webp)
![Buy Sell Volume Indicator for MetaTrader 4 Download - [TradingFinder] 0](https://cdn.tradingfinder.com/image/396638/2-71-en-buy-sell-volume-mt4-1.webp)
![Buy Sell Volume Indicator for MetaTrader 4 Download - [TradingFinder] 1](https://cdn.tradingfinder.com/image/396635/2-71-en-buy-sell-volume-mt4-2.webp)
![Buy Sell Volume Indicator for MetaTrader 4 Download - [TradingFinder] 2](https://cdn.tradingfinder.com/image/396636/2-71-en-buy-sell-volume-mt4-3.webp)
![Buy Sell Volume Indicator for MetaTrader 4 Download - [TradingFinder] 3](https://cdn.tradingfinder.com/image/396637/2-71-en-buy-sell-volume-mt4-4.webp)
The Buy-Sell Volume indicator is a trend oscillator in technical analysis that, by separating and analyzing volume data, identifies the strength of buyers and sellers and thus determines the direction of price movement.
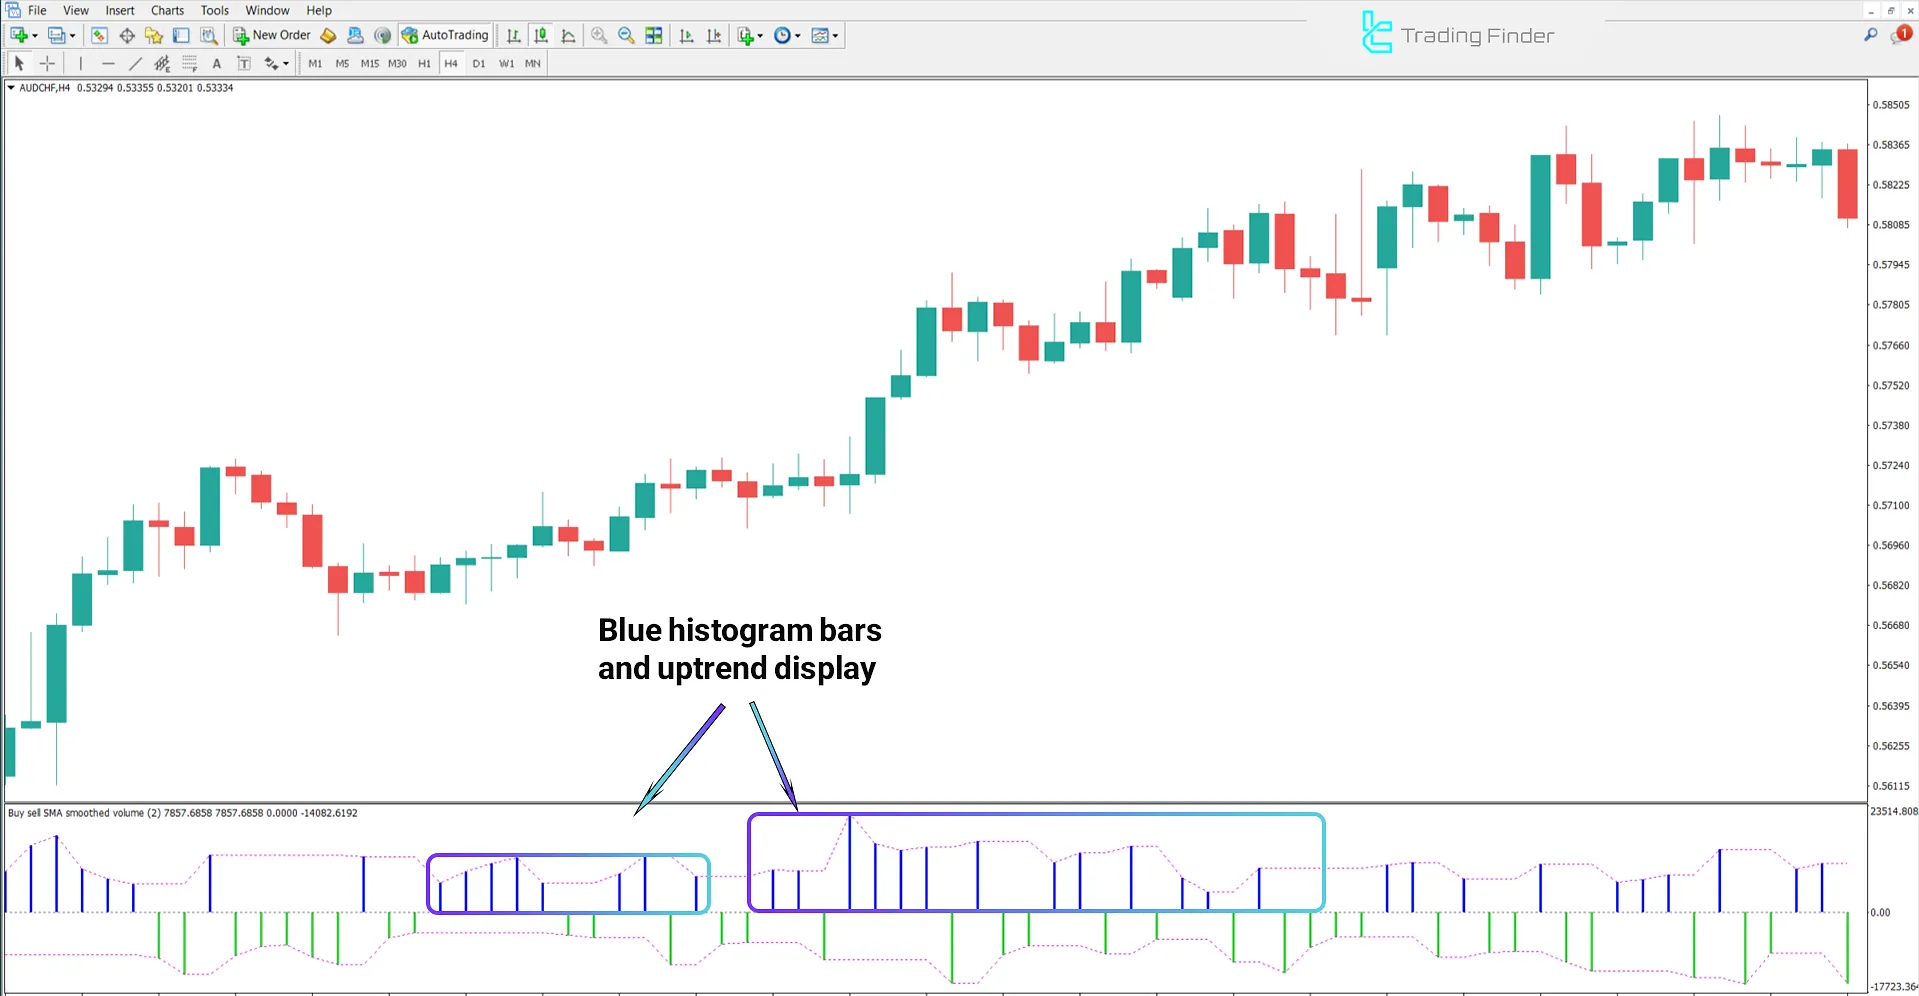
In the MetaTrader 4 platform, this indicator is displayed as a histogram around the Zero Line:
- Green bars represent an increase in Buy Volume pressure during each time interval.
- Blue bars indicate the Sell Volume pressure during each time interval.
Buy Sell Volume Specifications Table
The general specifications of the Buy Sell Volume Trading tools are presented in the table below:
Indicator Categories: | Volume MT4 Indicators Oscillators MT4 Indicators Trading Assist MT4 Indicators |
Platforms: | MetaTrader 4 Indicators |
Trading Skills: | Intermediate |
Indicator Types: | Reversal MT4 Indicators |
Timeframe: | Multi-Timeframe MT4 Indicators |
Trading Style: | Intraday MT4 Indicators |
Trading Instruments: | Share Stocks MT4 Indicators Forward Market MT4 Indicators Indices Market MT4 Indicators Commodity Market MT4 Indicators Stock Market MT4 Indicators Cryptocurrency MT4 Indicators Forex MT4 Indicators |
Indicator Overview
In the Buy Sell Volume indicator, Buy and Sell Volume are first calculated separately.
Then, by comparing these two values, if Buy Volume pressure increases, the histogram plots positive values (bars above the zero line); and if Sell Volume dominates, the histogram plots negative values (bars below the zero line).
Uptrend Conditions
On the AUD/CHF chart, Whenever the oscillator bars move into high positive areas, and other bullish technical signals are confirmed, this indicator defines a potential entry point for buy trades.

Downtrend Conditions
The image below shows the price chart of USD/JPY on a 15-minute time frame.
When the histogram bars fall below the Zero Line and their height exceeds the average volume of previous periods, it may indicate a suitable condition to enter sell positions.

Buy-Sell Volume Indicator Settings
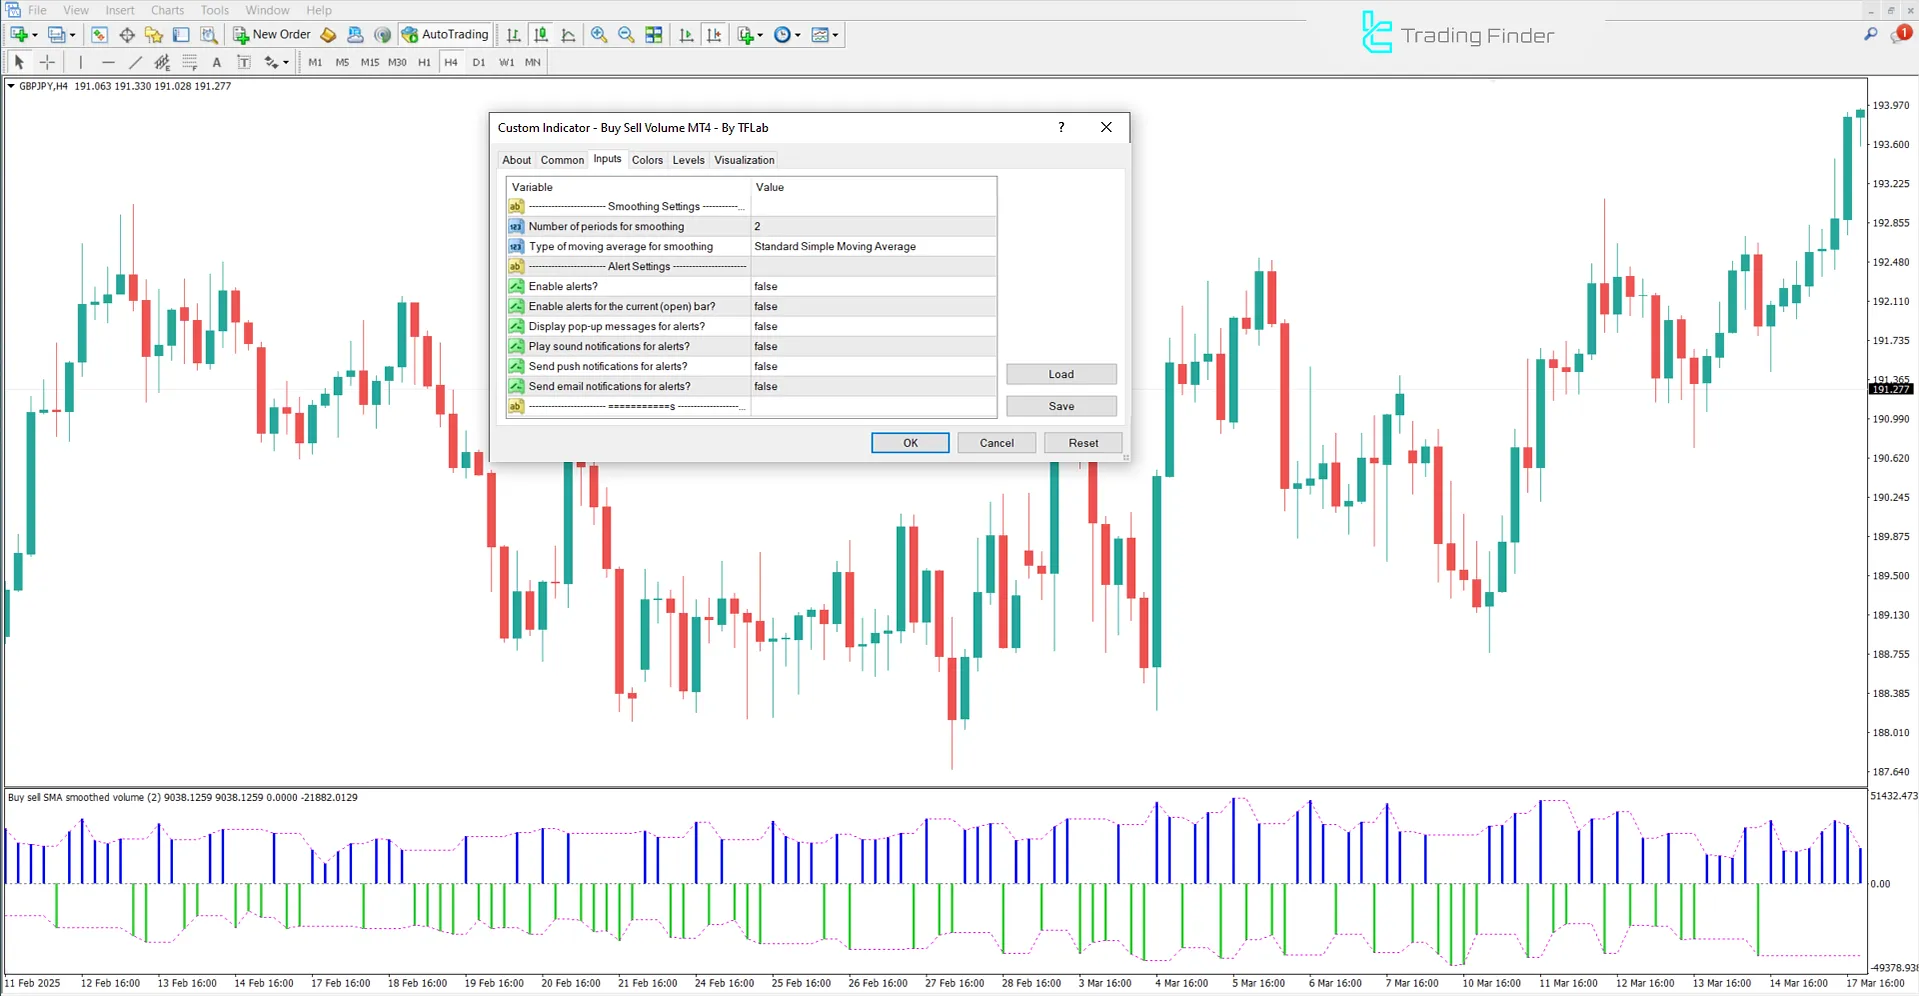
The settings panel of the Buy Sell Volume Indicator is shown in the image below:

- Number of periods for smoothing: Display Number of periods for smoothing
- Moving average for smoothing: Type of moving average used
- Enable alerts: Activate alerts
- Enable alerts for the current (open) bar: Activate alerts for the current (open) candle
- Display pop-up messages for alerts: Show pop-up alert messages
- Play sound notifications for alerts: Play sound alerts
- Send push notifications for alerts: Send push alerts
- Send email notifications for alerts: Send email notifications
Conclusion
The Buy Sell Volume indicator separates the volume of each candle into Buy and Sell and displays the dominance of buyers (positive bars above zero) or sellers (negative bars below zero) in the form of a trend histogram around the zero line.
Buy Sell Volume MT4 PDF
Buy Sell Volume MT4 PDF
Click to download Buy Sell Volume MT4 PDFWhat is the calculation basis of the Buy-Sell Volume Indicator?
This oscillator separates each candle's volume into "Buy Volume" and "Sell Volume", then calculates their difference around the zero axis for volume trend analysis.
In which financial markets can the Buy Sell Volume Indicator be used?
The Buy Sell Volume trading tool can be used in all financial markets, including Forex, Cryptocurrencies, Stocks, and Commodities.


