![Buyside and Sellside Liquidity Indicator for MT4 Download – [TradingFinder]](https://cdn.tradingfinder.com/image/586172/11-120-en-buyside-and-sellside-liquidity-mt4-01.webp)
![Buyside and Sellside Liquidity Indicator for MT4 Download – [TradingFinder] 0](https://cdn.tradingfinder.com/image/586172/11-120-en-buyside-and-sellside-liquidity-mt4-01.webp)
![Buyside and Sellside Liquidity Indicator for MT4 Download – [TradingFinder] 1](https://cdn.tradingfinder.com/image/586171/11-120-en-buyside-and-sellside-liquidity-mt4-02.webp)
![Buyside and Sellside Liquidity Indicator for MT4 Download – [TradingFinder] 2](https://cdn.tradingfinder.com/image/586173/11-120-en-buyside-and-sellside-liquidity-mt4-03.webp)
![Buyside and Sellside Liquidity Indicator for MT4 Download – [TradingFinder] 3](https://cdn.tradingfinder.com/image/586170/11-120-en-buyside-and-sellside-liquidity-mt4-04.webp)
The Buyside and Sellside Liquidity Indicator is a specialized tool for ICT and Smart Money traders in MetaTrader 4. It provides analysts with a deeper understanding of market liquidity flow.
Forex traders can use this indicator to identify sell-side (SSL) and buy-side (BSL) liquidity levels on charts, enabling more professional market analysis.
Buyside and Sellside Liquidity Indicator Table
Below is the information related to the Buyside and Sellside Liquidity Indicator:
Indicator Categories: | ICT MT4 Indicators Smart Money MT4 Indicators Liquidity MT4 Indicators |
Platforms: | MetaTrader 4 Indicators |
Trading Skills: | Intermediate |
Indicator Types: | Breakout MT4 Indicators Entry and Exit MT4 Indicators Reversal MT4 Indicators |
Timeframe: | Multi-Timeframe MT4 Indicators |
Trading Style: | Day Trading MT4 Indicators Intraday MT4 Indicators Scalper MT4 Indicators |
Trading Instruments: | Share Stocks MT4 Indicators Indices Market MT4 Indicators Stock Market MT4 Indicators Cryptocurrency MT4 Indicators Forex MT4 Indicators |
Buyside and Sellside Liquidity Indicator at a Glance
The Buyside and Sellside Liquidity Indicator is a practical tool for detecting liquidity levels in the market.
Based on ICT and Smart Money concepts, it identifies key Buy Stop and Sell Stop levels, showing liquidity zones directly on the chart.
By running this indicator and analyzing liquidity zones, traders can understand market movement and institutional liquidity collection.
Using liquidity-based trading strategies, they can identify trading opportunities and enter buy or sell positions.
Uptrend in the Buyside and Sellside Liquidity Indicator
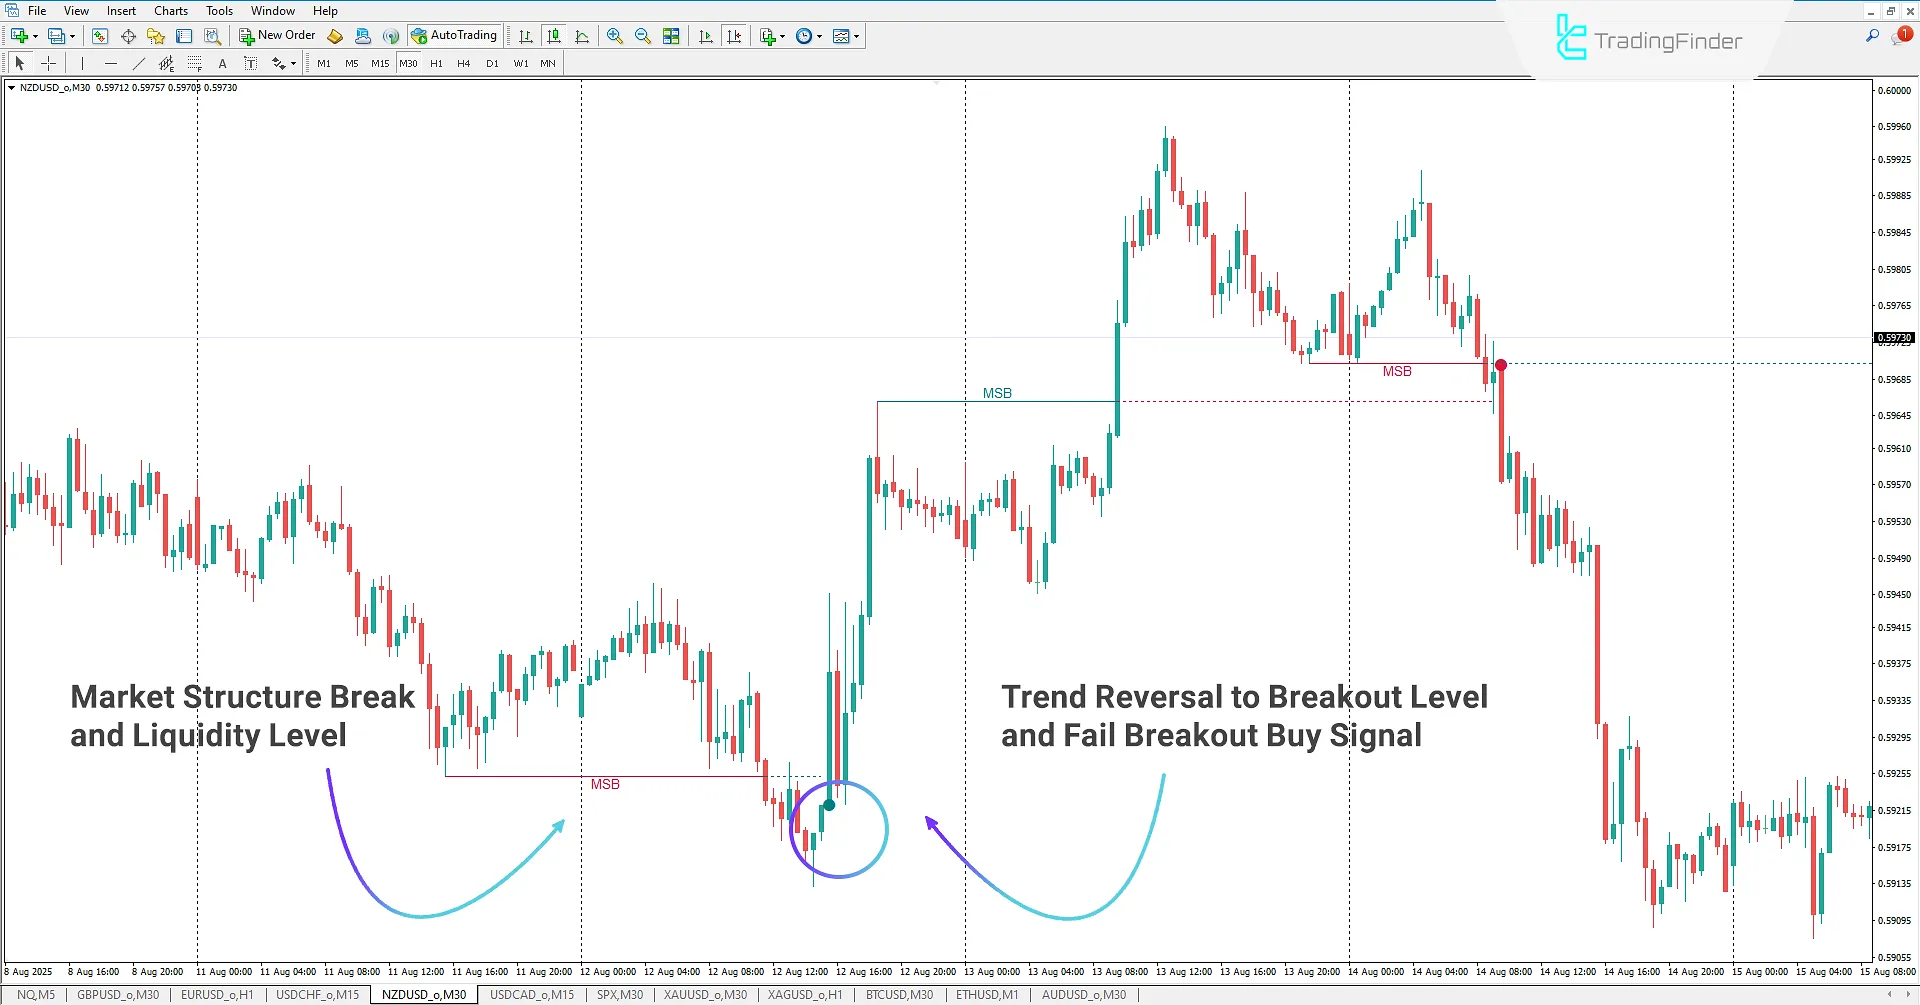
On the 30-minute NZD/USD chart, the indicator highlights sell-side liquidity levels in red.
These zones mark key areas ICT traders monitor. In case of a liquidity sweep and price returning above the red level, the indicator generates a buy signal, providing an opportunity to enter a long trade.
In this setup, price first performed a Market Structure Break (MSB) downward, collecting liquidity below the breakout. This signaled the completion of liquidity collection and preparation for a new bullish phase.
As price moved back above the broken level, the indicator issued a buy signal, confirming a long entry aligned with the uptrend.

Downtrend in the Buyside and Sellside Liquidity Indicator
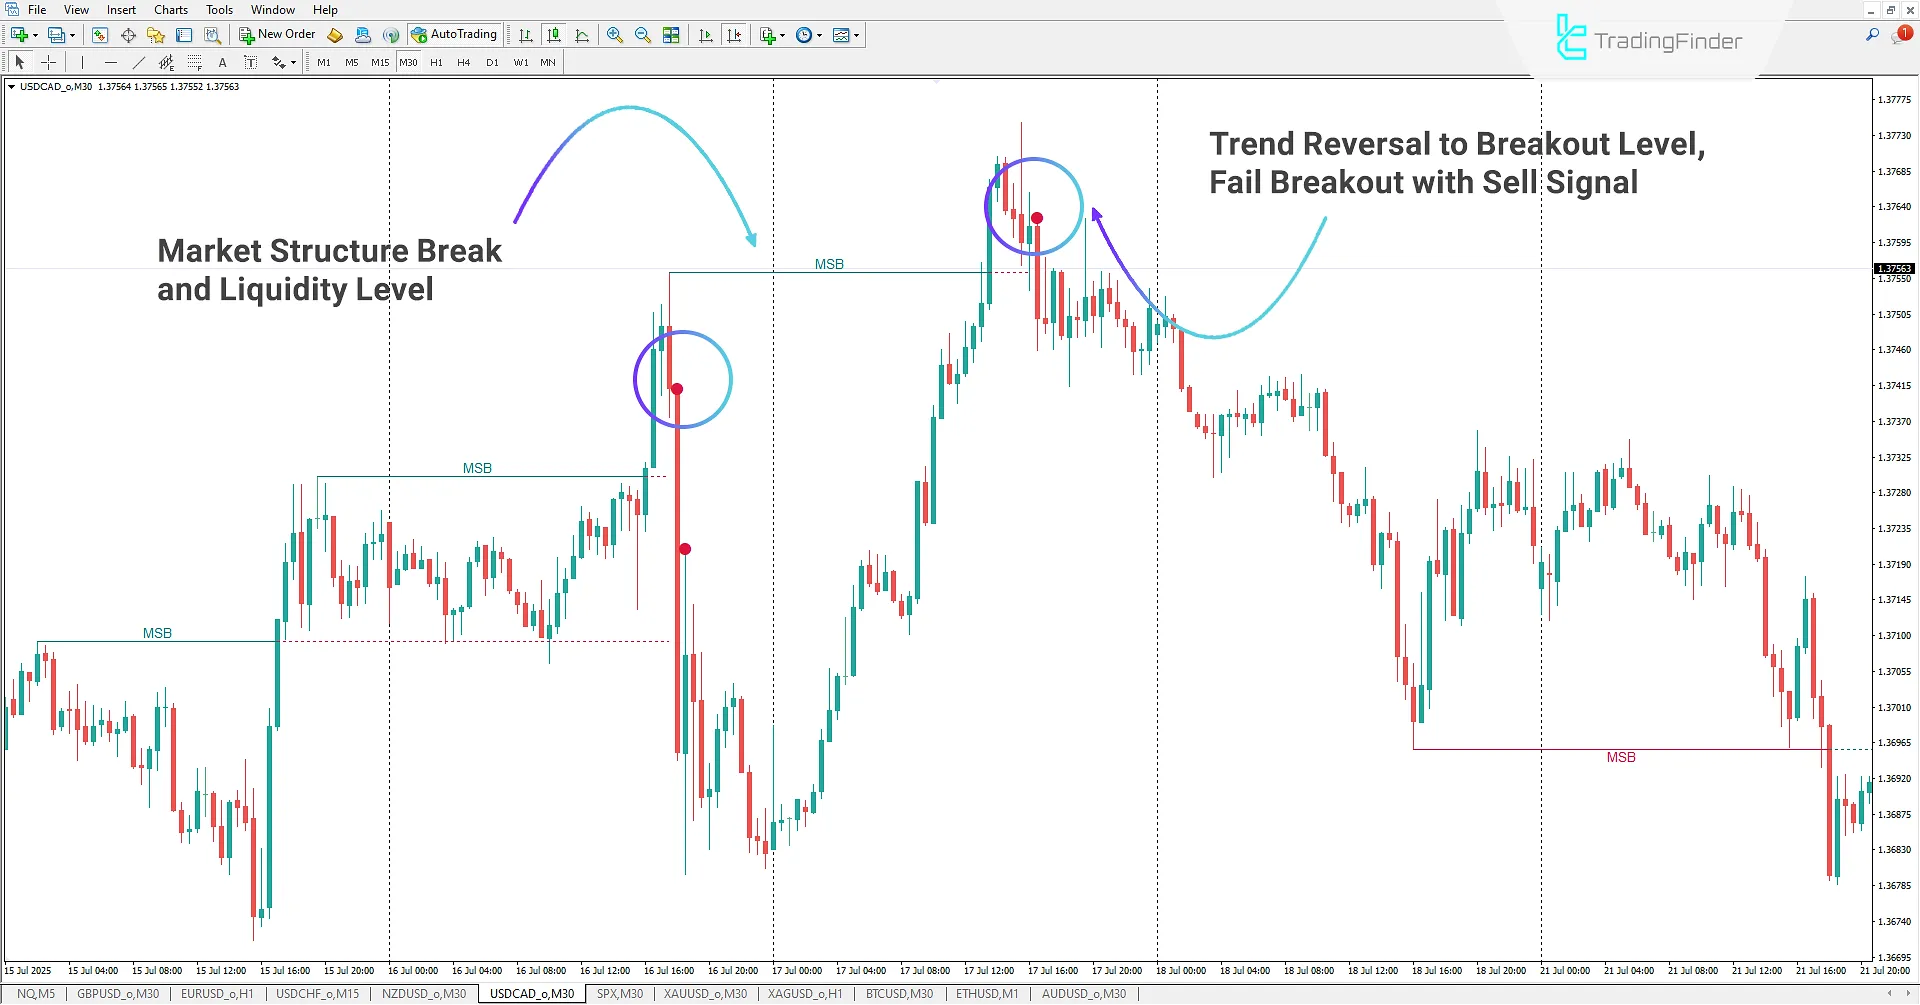
On the 30-minute USD/CAD chart, price broke structure to the upside, sweeping buyside liquidity at the highs.
After liquidity was collected at the top, price retraced below the breakout level. The indicator then generated a sell signal, providing a valid short entry opportunity.

Buyside and Sellside Liquidity Indicator Settings
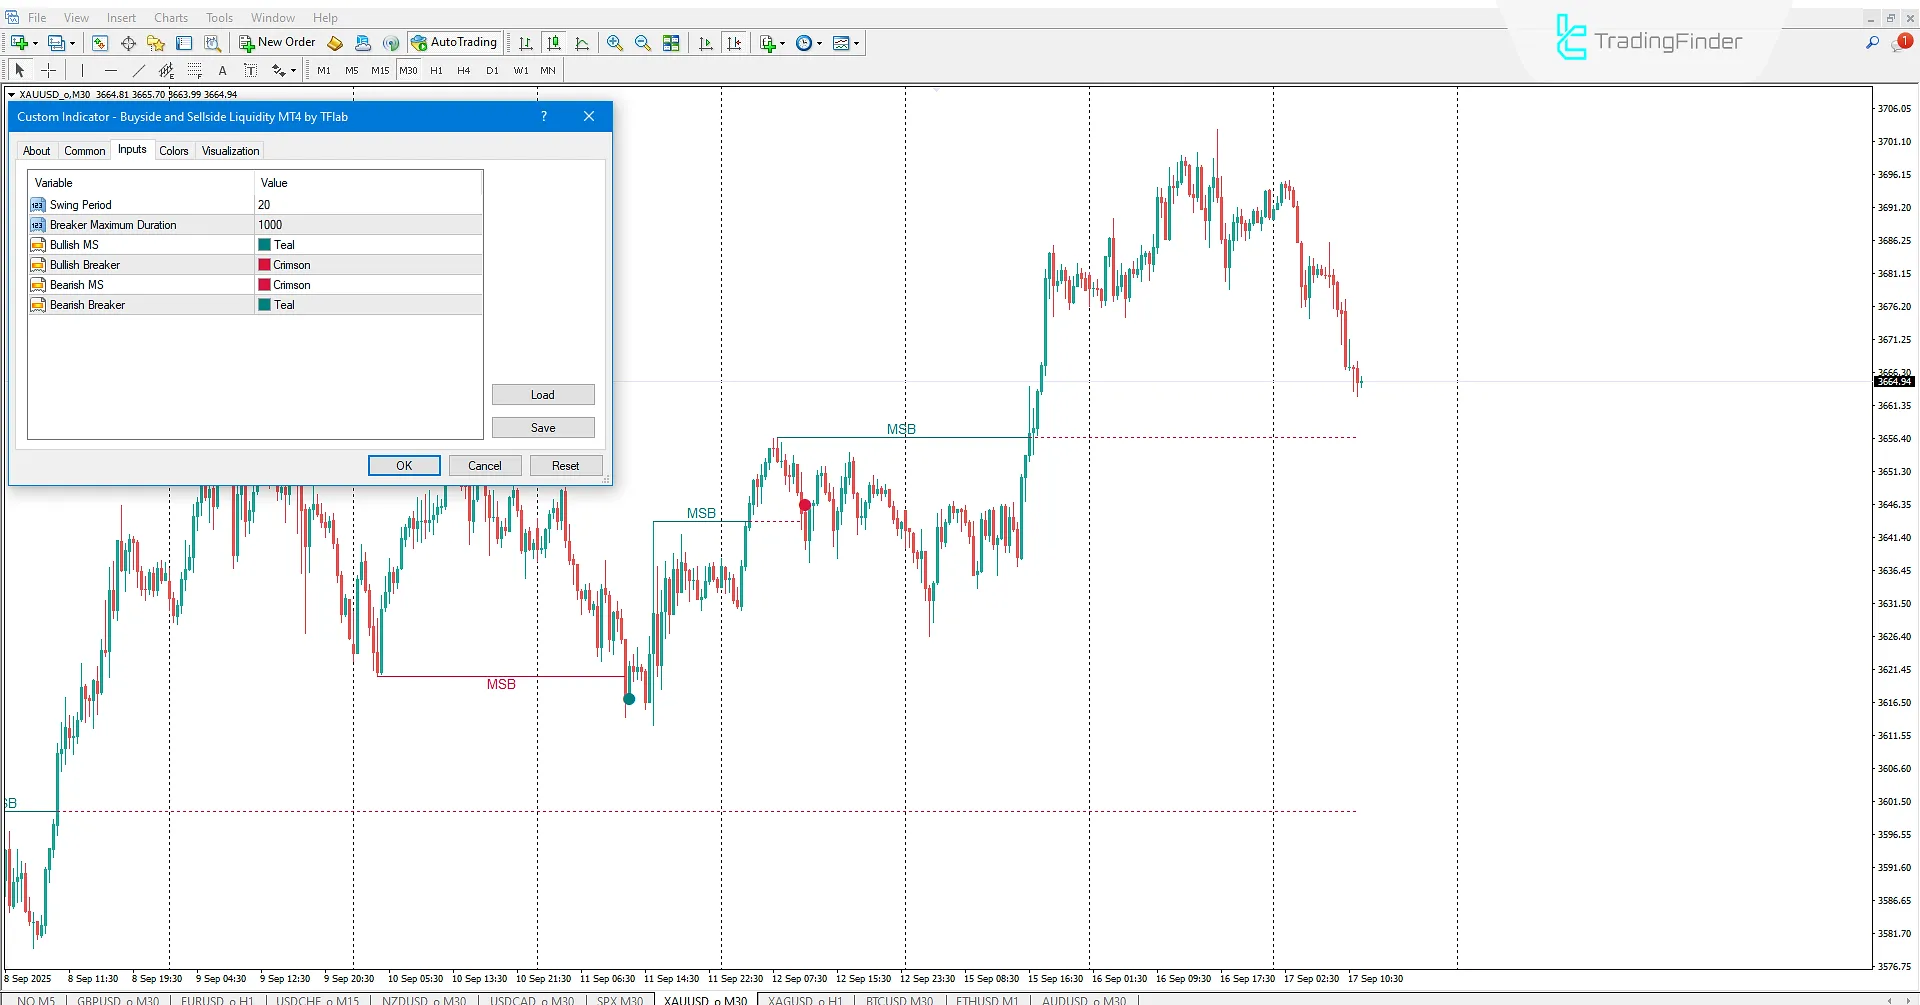
Below are the settings for the Buyside and Sellside Liquidity Indicator:

- Swing Period: Defines the swing calculation period;
- Breaker Maximum Duration: Defines the number of candles liquidity levels extend after a breakout;
- Bullish MS: Sets color for bullish market structure;
- Bullish Breaker: Sets color for bullish structure after breakout;
- Bearish MS: Sets color for bearish market structure;
- Bearish Breaker: Sets color for bearish structure after breakout.
Conclusion
The Buyside and Sellside Liquidity Indicator is a specialized tool for Smart Money and ICT traders.
It helps identify key liquidity zones in Forex and crypto markets, giving traders a professional edge in analysis.
By detecting liquidity collection at highs and lows, traders can anticipate potential reversals or trend continuations, improving entry and exit precision.
This indicator reveals where institutions and market makers gather liquidity, making it an essential tool for understanding order flow and Smart Money behavior.
Buyside and Sellside Liquidity Indicator for MT4 PDF
Buyside and Sellside Liquidity Indicator for MT4 PDF
Click to download Buyside and Sellside Liquidity Indicator for MT4 PDFWhat is the Buyside and Sellside Liquidity Indicator?
It is a specialized tool for ICT and Smart Money traders in MetaTrader 4, designed to identify buyside (BSL) and sellside (SSL) liquidity levels.
What is the main purpose of this indicator?
It helps traders understand liquidity flow, detect institutional liquidity collection zones, and identify precise entry/exit points.


