![Candle Range in pips Indicator for MetaTrader 4 Download - [TradingFinder]](https://cdn.tradingfinder.com/image/520236/2-127-en-candle-range-in-pips-mt4-1.webp)
![Candle Range in pips Indicator for MetaTrader 4 Download - [TradingFinder] 0](https://cdn.tradingfinder.com/image/520236/2-127-en-candle-range-in-pips-mt4-1.webp)
![Candle Range in pips Indicator for MetaTrader 4 Download - [TradingFinder] 1](https://cdn.tradingfinder.com/image/520229/2-127-en-candle-range-in-pips-mt4-2.webp)
![Candle Range in pips Indicator for MetaTrader 4 Download - [TradingFinder] 2](https://cdn.tradingfinder.com/image/520233/2-127-en-candle-range-in-pips-mt4-3.webp)
The Candle Range in pips indicator is designed to accurately display the actual range of each candlestick (difference between High and Low).
This trading tool shows price fluctuations as a bar histogram at the bottom of the chart, where each bar represents the volatility of a single candle.
In this oscillator, green bars represent bullish candles and red bars represent bearish candles, making market movement trends clearly recognizable.
Candle Range in pips Indicator Table
The general features of the Candle Range in pips indicator are presented in the table below.
Indicator Categories: | Oscillators MT4 Indicators Trading Assist MT4 Indicators Momentum Indicators in MT4 |
Platforms: | MetaTrader 4 Indicators |
Trading Skills: | Elementary |
Indicator Types: | Reversal MT4 Indicators |
Timeframe: | Multi-Timeframe MT4 Indicators |
Trading Style: | Intraday MT4 Indicators |
Trading Instruments: | Stock Market MT4 Indicators Cryptocurrency MT4 Indicators Forex MT4 Indicators |
Candle Range in pips at a Glance
In the Candle Range in pips indicator, the change in histogram bar height provides useful information about market volatility, the probability of breaking key levels, and potential shifts in momentum.
This indicator is also used in trading strategies such as Price Action, Scalping, and Technical Breakout trades, serving as a time filter to determine entry and exit points.
Indicator in an Uptrend
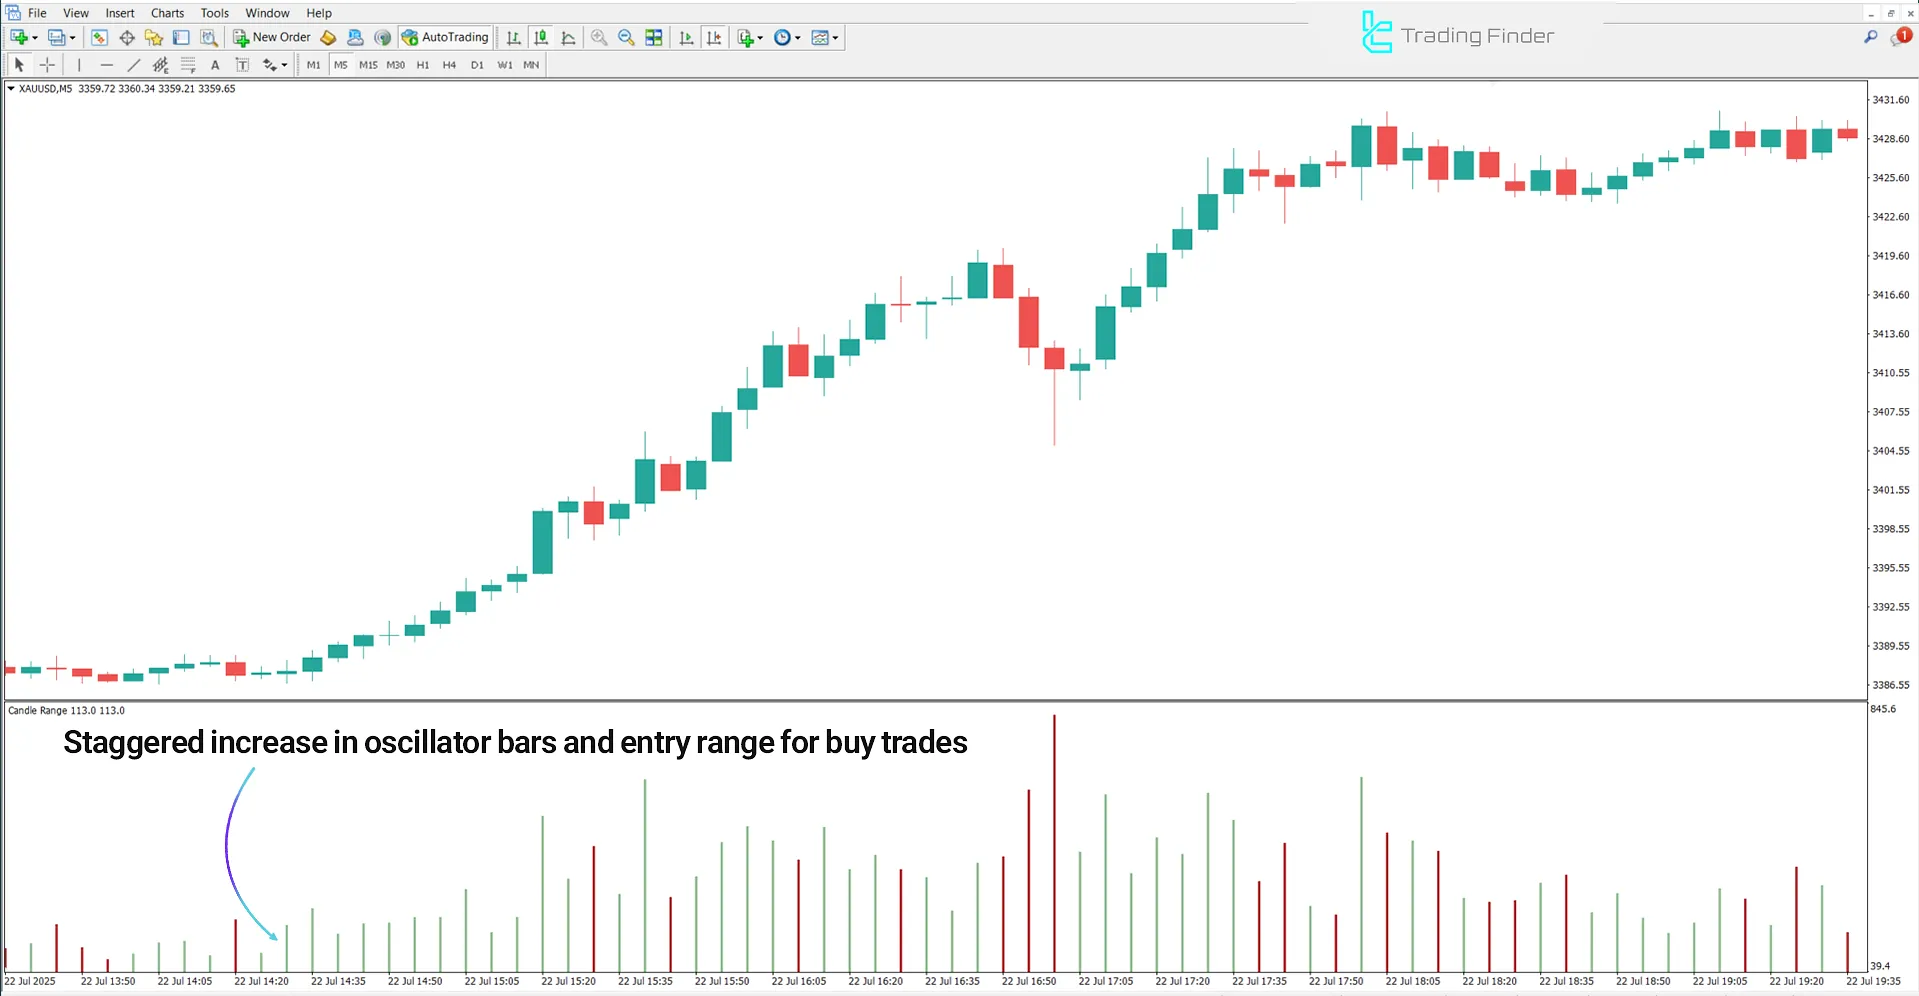
The chart below shows the Gold Spot Index (XAU/USD) on the 5-minute timeframe. With a gradual increase in histogram bar height and the price surpassing previous resistance levels accompanied by a bullish breakout and wider volatility range, these conditions can be seen as a sign of buyer strengthening and the potential continuation of the uptrend.

Indicator in a Downtrend
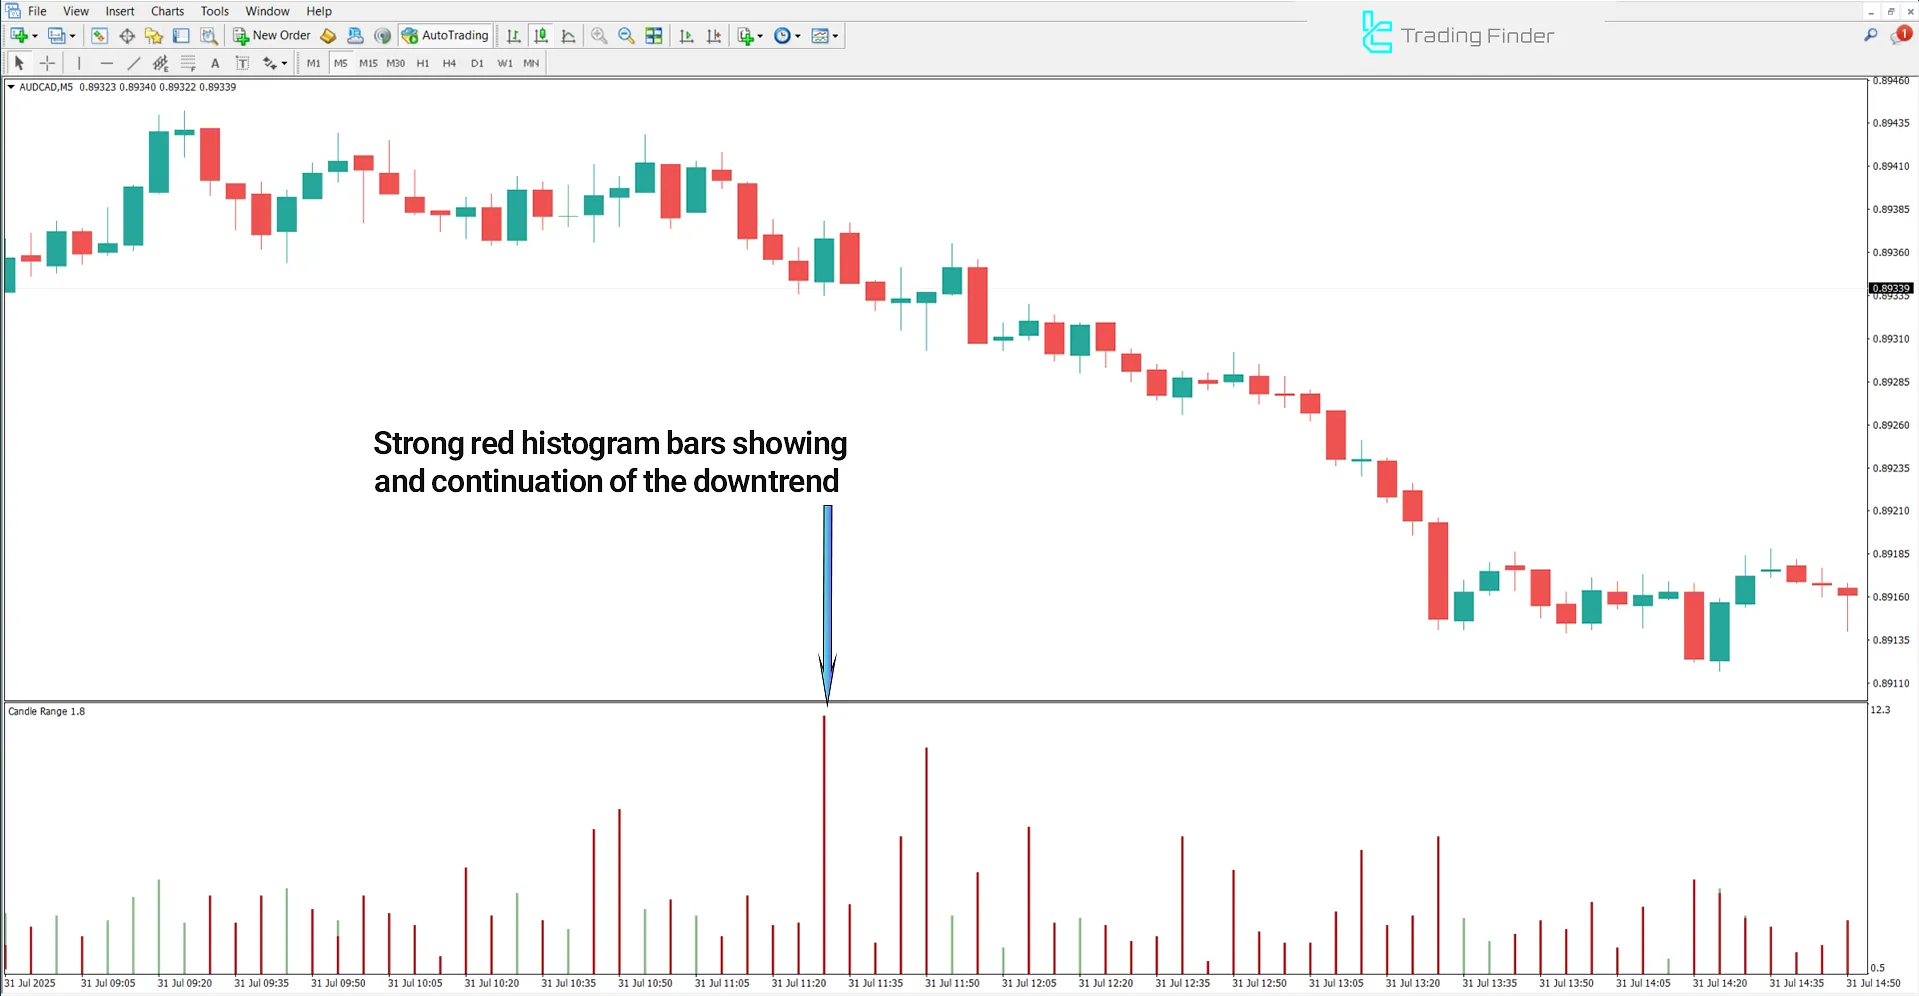
The following chart shows the AUD/CAD currency pair on the 5-minute timeframe. In this indicator, following a breakdown of the support level, accompanied by a significant rise in volatility and the formation of long candles with upper shadows, signs emerge of increasing selling pressure and the intensification of the downtrend.
If these conditions occur after a range-bound (consolidation) phase, it indicates a shift in market sentiment from neutral to bearish.

Conclusion
The Candle Range in pips Oscillator is a specialized tool for measuring the real volatility of candlesticks.
Analyzing the price movement range provides precise information about momentum strength and the potential for trend continuation or reversal in technical analysis.
Consistent increases or decreases in candlestick ranges, especially at key price levels, illustrate market phase transitions.
Candle Range in pips Indicator for MetaTrader 4 PDF
Candle Range in pips Indicator for MetaTrader 4 PDF
Click to download Candle Range in pips Indicator for MetaTrader 4 PDFWhat is the main purpose of the Candle Range in pips indicator?
It is a tool for analyzing price volatility and momentum strength, used to identify situations such as rising volatility, consolidation, price breakouts, or potential trend reversals.
Does the Candle Range in pips indicator generate buy or sell signals?
No, This indicator does not produce direct trading signals, but it plays an important role as a powerful filter within technical strategies.


