![Cap Channel Trading Indicator for MetaTrader 4 Download - [TradingFinder]](https://cdn.tradingfinder.com/image/190430/2-1-en-cap-channel-trading-mt4-1.webp)
![Cap Channel Trading Indicator for MetaTrader 4 Download - [TradingFinder] 0](https://cdn.tradingfinder.com/image/190430/2-1-en-cap-channel-trading-mt4-1.webp)
![Cap Channel Trading Indicator for MetaTrader 4 Download - [TradingFinder] 1](https://cdn.tradingfinder.com/image/190439/2-1-en-cap-channel-trading-mt4-2.webp)
![Cap Channel Trading Indicator for MetaTrader 4 Download - [TradingFinder] 2](https://cdn.tradingfinder.com/image/190443/2-1-en-cap-channel-trading-mt4-3.webp)
![Cap Channel Trading Indicator for MetaTrader 4 Download - [TradingFinder] 3](https://cdn.tradingfinder.com/image/190442/2-1-en-cap-channel-trading-mt4-4.webp)
The Cap Channel Trading Indicator is a tool based on the Triangular Moving Average (TMA). This MT4 Volatility indicator is designed for conditions where the market isranging, making it difficult for traders to identify trends.
The tool identifies suitable entry and exit points and determines uptrends or downtrends.The indicator consists of three lines.
The middle line represents theTriangular Moving Average (TMA). The other two lines are positioned at a specified distance above and below the middle line.
Cap Channel Trading Specifications Table
Table below examines the general features of the Cap Channel Trading indicator:
Indicator Categories: | Volatility MT4 Indicators Currency Strength MT4 Indicators Bands & Channels MT4 Indicators |
Platforms: | MetaTrader 4 Indicators |
Trading Skills: | Intermediate |
Indicator Types: | Range MT4 Indicators Breakout MT4 Indicators |
Timeframe: | Multi-Timeframe MT4 Indicators |
Trading Style: | Day Trading MT4 Indicators |
Trading Instruments: | Share Stocks MT4 Indicators Indices Market MT4 Indicators Commodity Market MT4 Indicators Stock Market MT4 Indicators Cryptocurrency MT4 Indicators Forex MT4 Indicators |
Indicator Overview
Buy and sell conditions in the Cap Channel Trading Indicator are created when the lines are broken upwards or downwards.
When a line is broken downward, an uptrend is expected. Conversely, this indicator is effective not only in ranging markets but also in indicating trend reversals.
Uptrend Conditions
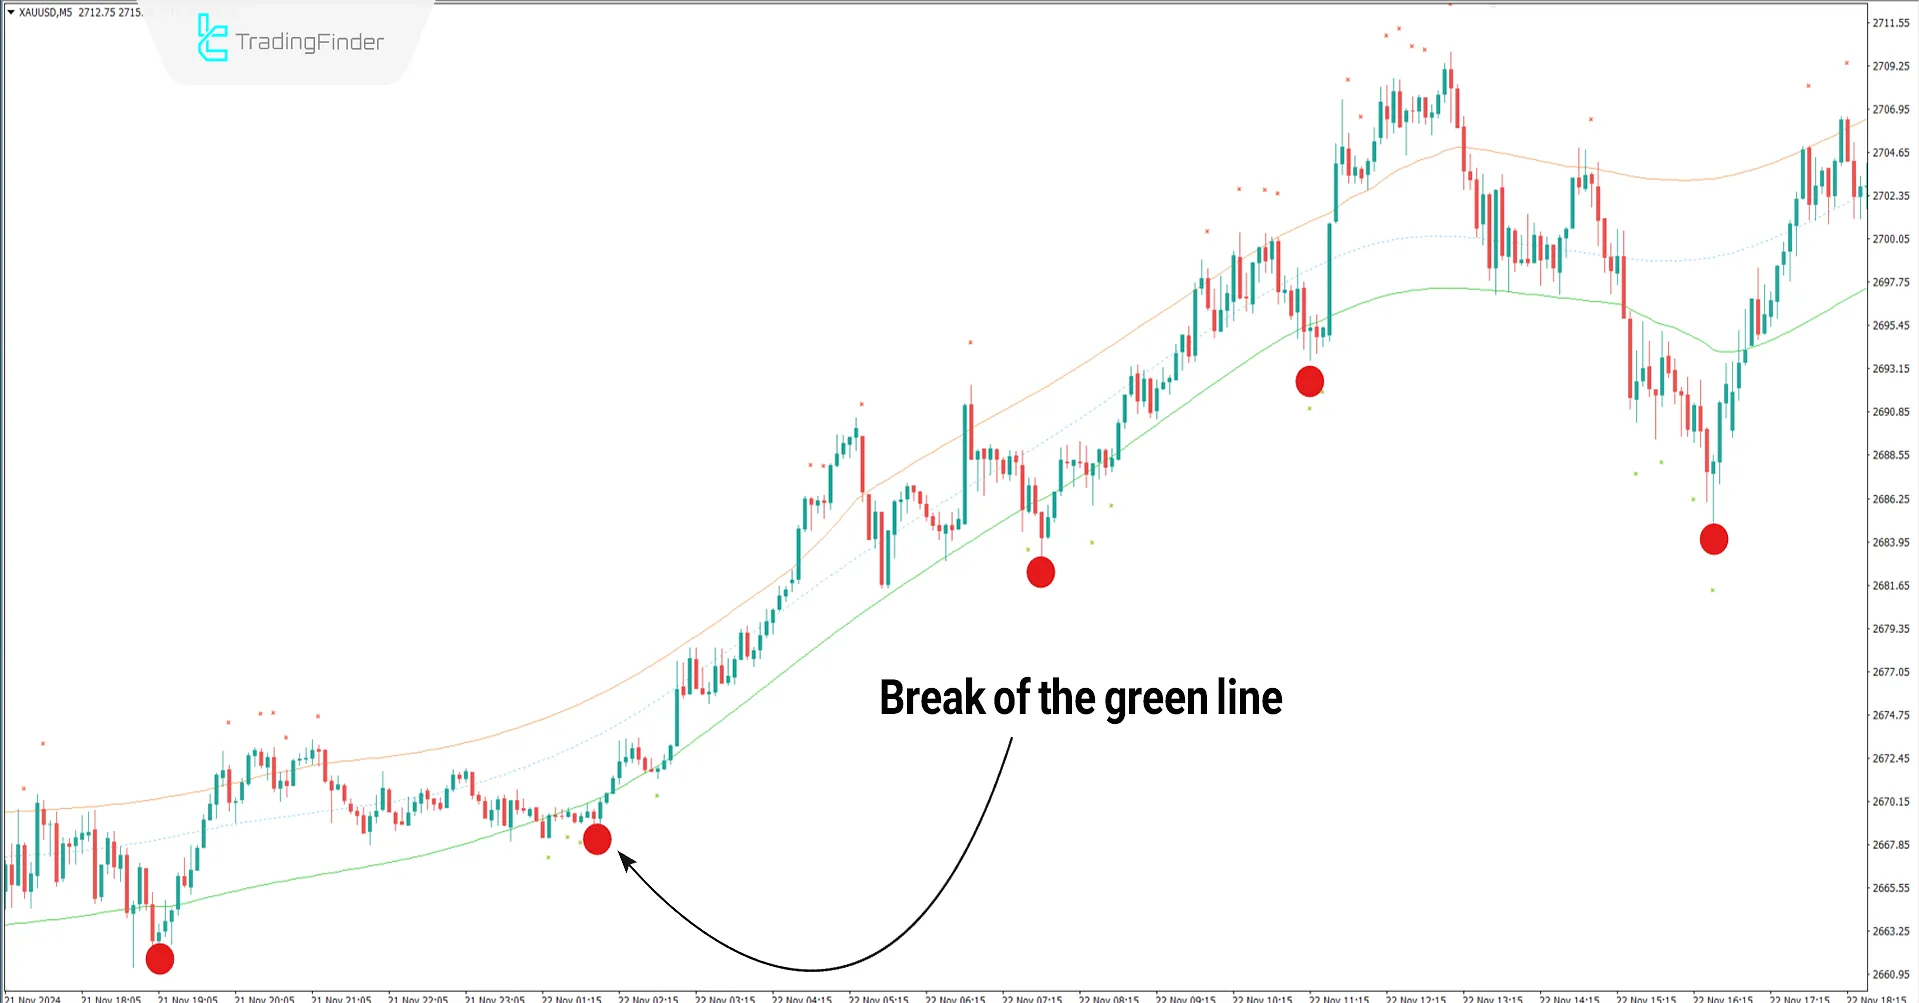
The chart shows the price chart for Gold against the US Dollar (XAU/USD) in a 5-minute timeframe.
Thebullish signal line (green line) is broken downward by the price, resulting in a trend change (red dots indicate the breakpoints).
In such conditions, traders can consider the green line break as an entry signal and open buy positions.

Downtrend Conditions
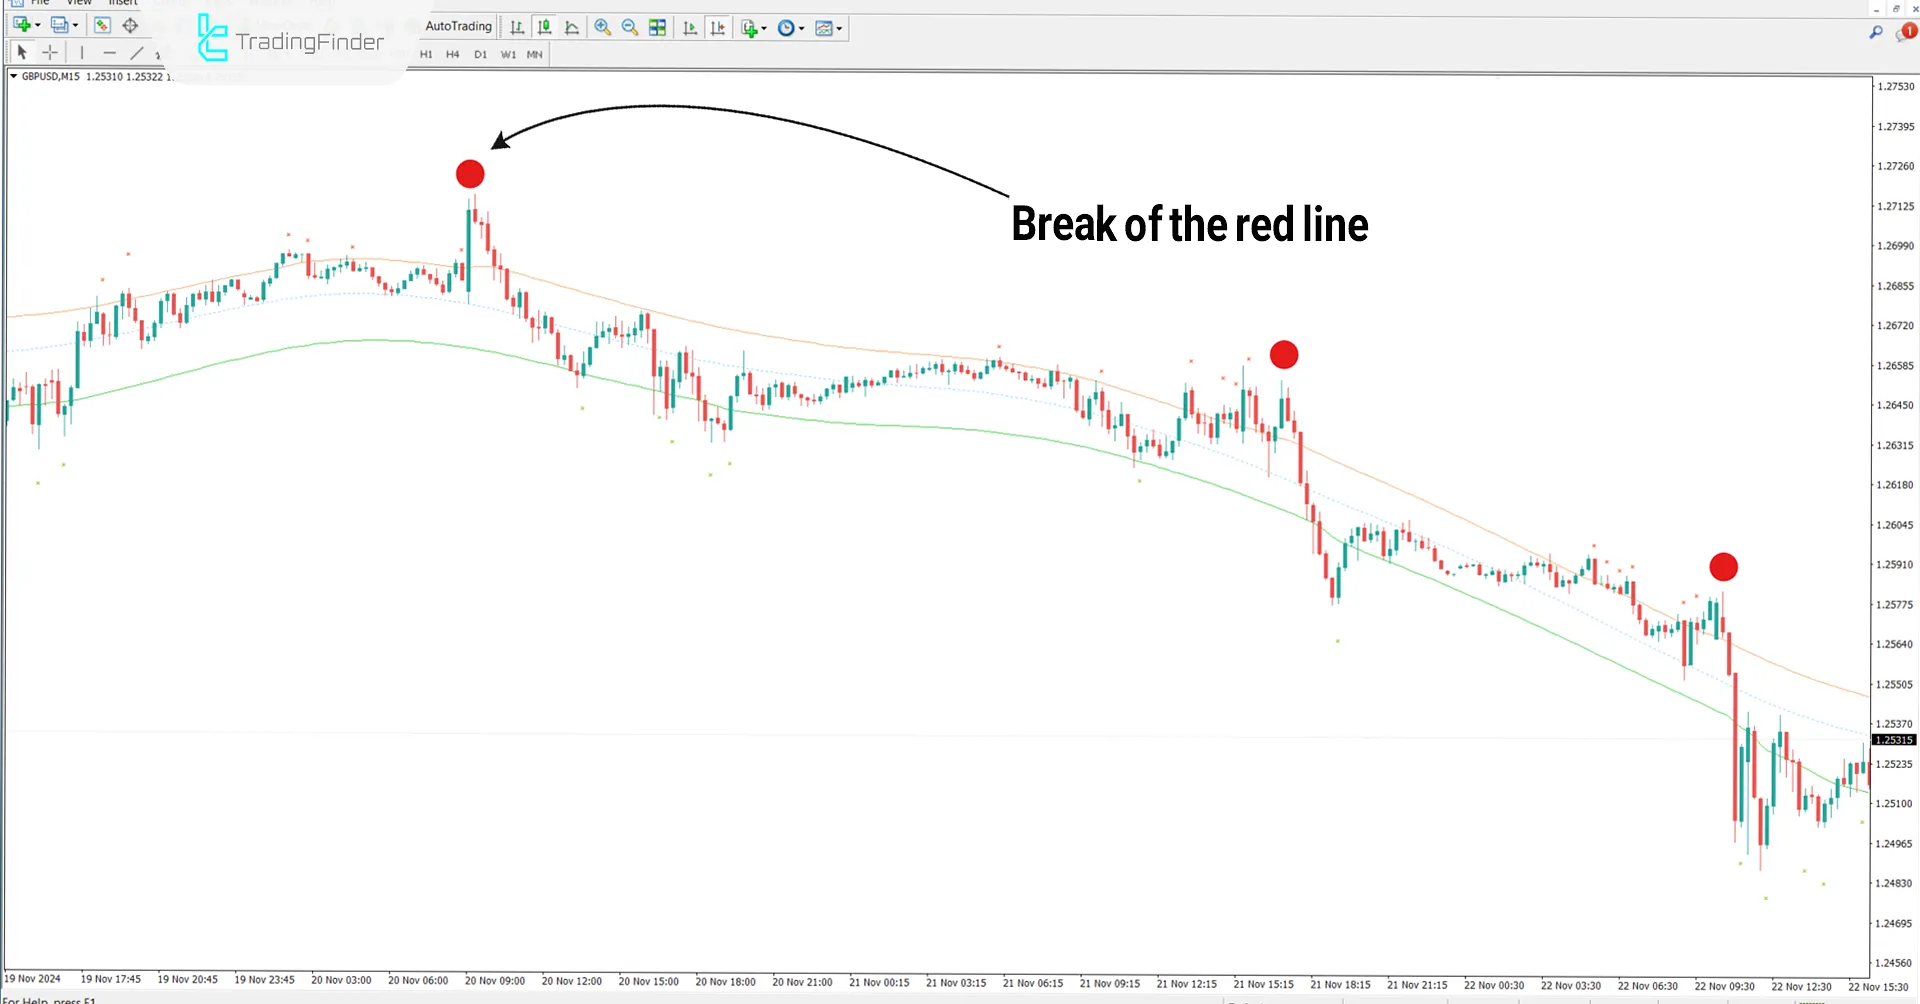
The chart below displays the price chart of (GBP/USD) in a 15-minute timeframe. The bearish signal line (orange) is broken upward, highlighting reversal points.
In such conditions, traders can consider the orange line tobreak an entry signal and open sell positions.

Indicator Settings
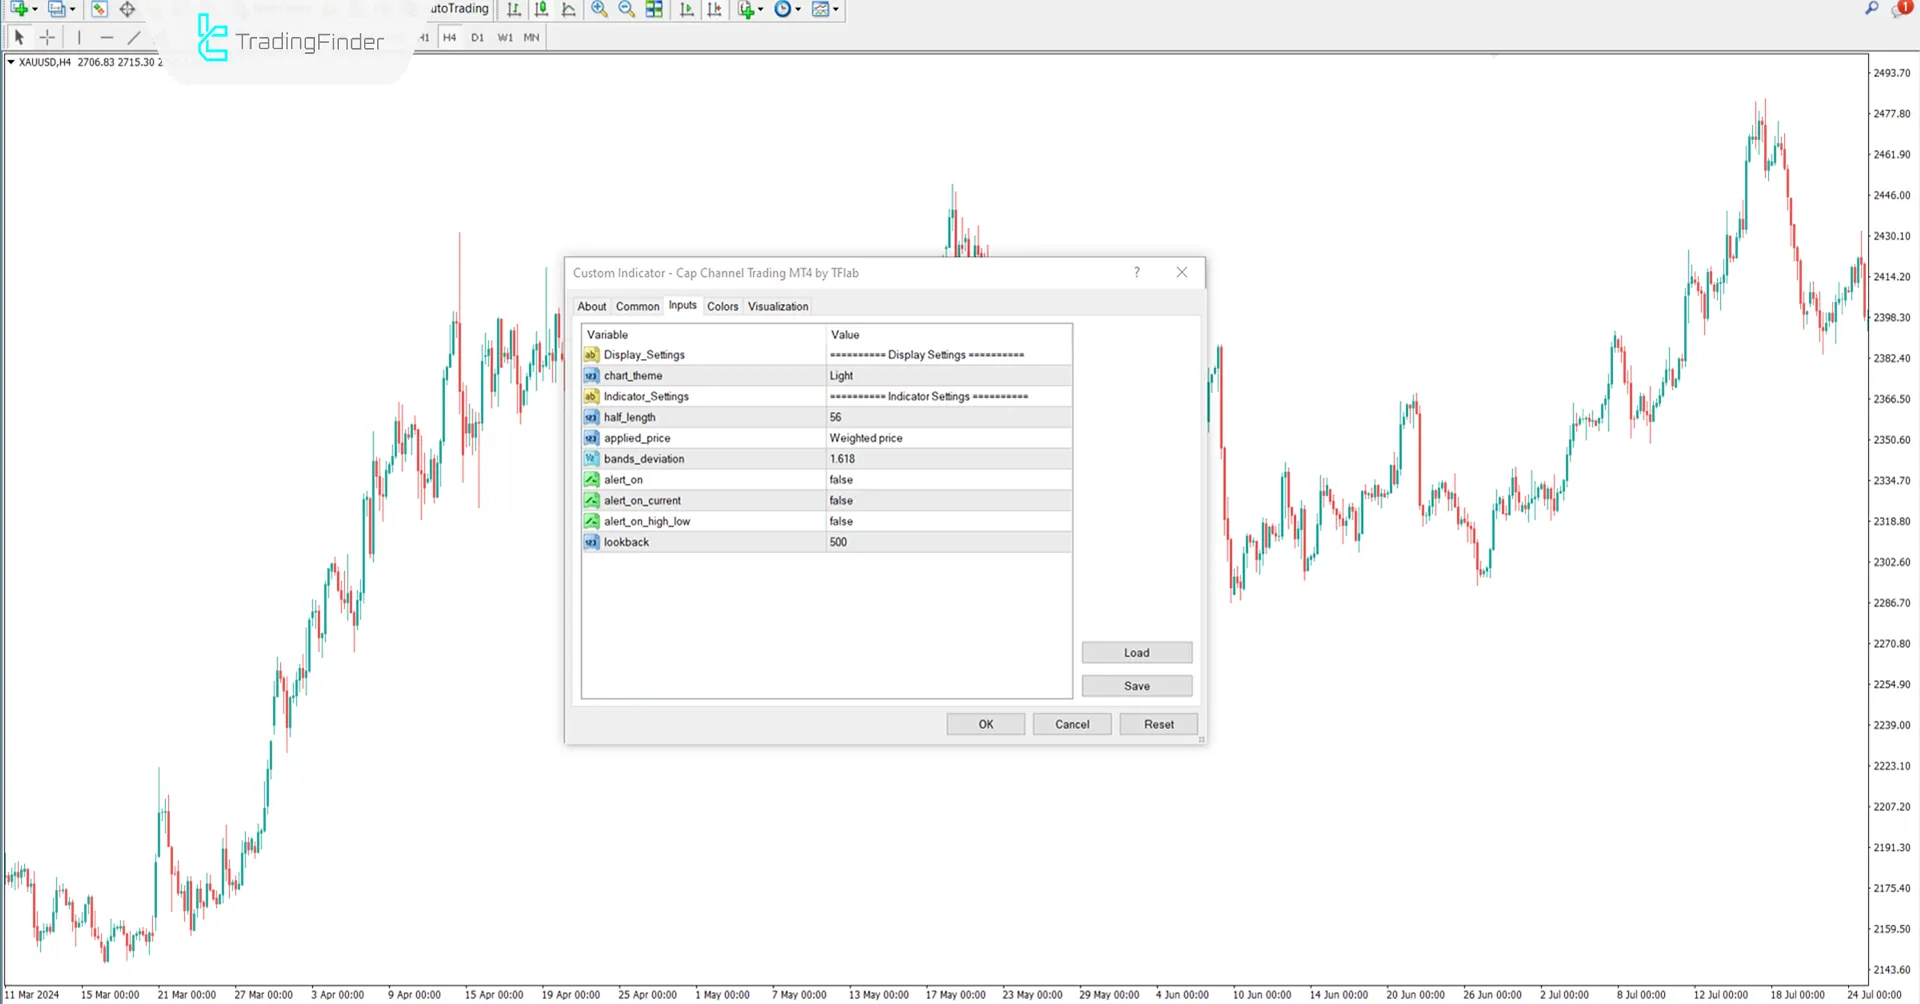
Image below shows the adjustable parameters of the Cap Channel Trading indicator:

- Chart-theme: Configure chart themes;
- Half-length: Set half-distance levels;
- Applied price: Define the applied price;
- Bands-deviation: Set deviation for the bands;
- Alert-on: Enable or disable alerts;
- Alert-on-current: Activate alerts for current positions;
- Alert-on-high-low: Enable alerts for highs and lows;
- Lookback: Define the lookback period.
Conclusion
The Cap Channel Trading Indicator, like the MT4 Currency Strength indicator, is a multi timeframe Trading Tool that enables traders to identify trends during ranging market conditions.
It helps recognize reversal points based on breakout zones and locate optimal entry and exit points .
Cap Channel Trading MT4 PDF
Cap Channel Trading MT4 PDF
Click to download Cap Channel Trading MT4 PDFWhat is the suitable timeframe for using this indicator?
This indicator is multi-timeframe and applicable across all timeframes.
Is this indicator only useful in ranging markets?
No, this indicator is also effective for identifying trend reversals and locating entry zones beyond ranging trends.


