![CCI Divergence Indicator for MetaTrader 4 Download – Free – [TFlab]](https://cdn.tradingfinder.com/image/298855/4-72-en-cci-divergence-mt4-1.webp)
![CCI Divergence Indicator for MetaTrader 4 Download – Free – [TFlab] 0](https://cdn.tradingfinder.com/image/298855/4-72-en-cci-divergence-mt4-1.webp)
![CCI Divergence Indicator for MetaTrader 4 Download – Free – [TFlab] 1](https://cdn.tradingfinder.com/image/298852/4-72-en-cci-divergence-mt4-2.webp)
![CCI Divergence Indicator for MetaTrader 4 Download – Free – [TFlab] 2](https://cdn.tradingfinder.com/image/298854/4-72-en-cci-divergence-mt4-3.webp)
![CCI Divergence Indicator for MetaTrader 4 Download – Free – [TFlab] 3](https://cdn.tradingfinder.com/image/298853/4-72-en-cci-divergence-mt4-4.webp)
On June 22, 2025, in version 2, alert/notification functionality was added to this indicator
The CCI Divergence Indicator is an efficient tool within the MetaTrader 4 oscillators, designed to detect price divergences and identify overbought and oversold conditions.
This tool is based on Commodity Channel Index (CCI) changes and analyzes trend reversal points.
In this oscillator structure, bullish divergence is marked by an orange line, while bearish divergence is represented by a pink line, indicating potential price direction changes.
CCI Divergence Indicator Specifications
The key features of this indicator are summarized in the table below:
Indicator Categories: | Oscillators MT4 Indicators Signal & Forecast MT4 Indicators Trading Assist MT4 Indicators |
Platforms: | MetaTrader 4 Indicators |
Trading Skills: | Elementary |
Indicator Types: | Leading MT4 Indicators Reversal MT4 Indicators |
Timeframe: | Multi-Timeframe MT4 Indicators |
Trading Style: | Day Trading MT4 Indicators |
Trading Instruments: | Share Stocks MT4 Indicators Forward Market MT4 Indicators Stock Market MT4 Indicators Cryptocurrency MT4 Indicators Forex MT4 Indicators |
Indicator Overview
The combination of divergence lines with overbought and oversold zones in the CCI Divergence Indicator allows for early trend change detection.
- CCI above +100: Market enters the overbought zone, signaling a potential price correction or the start of a bearish trend
- CCI below -100: Indicates an oversold condition, warning of a bullish reversal and a possible uptrend
Indicator in an Uptrend
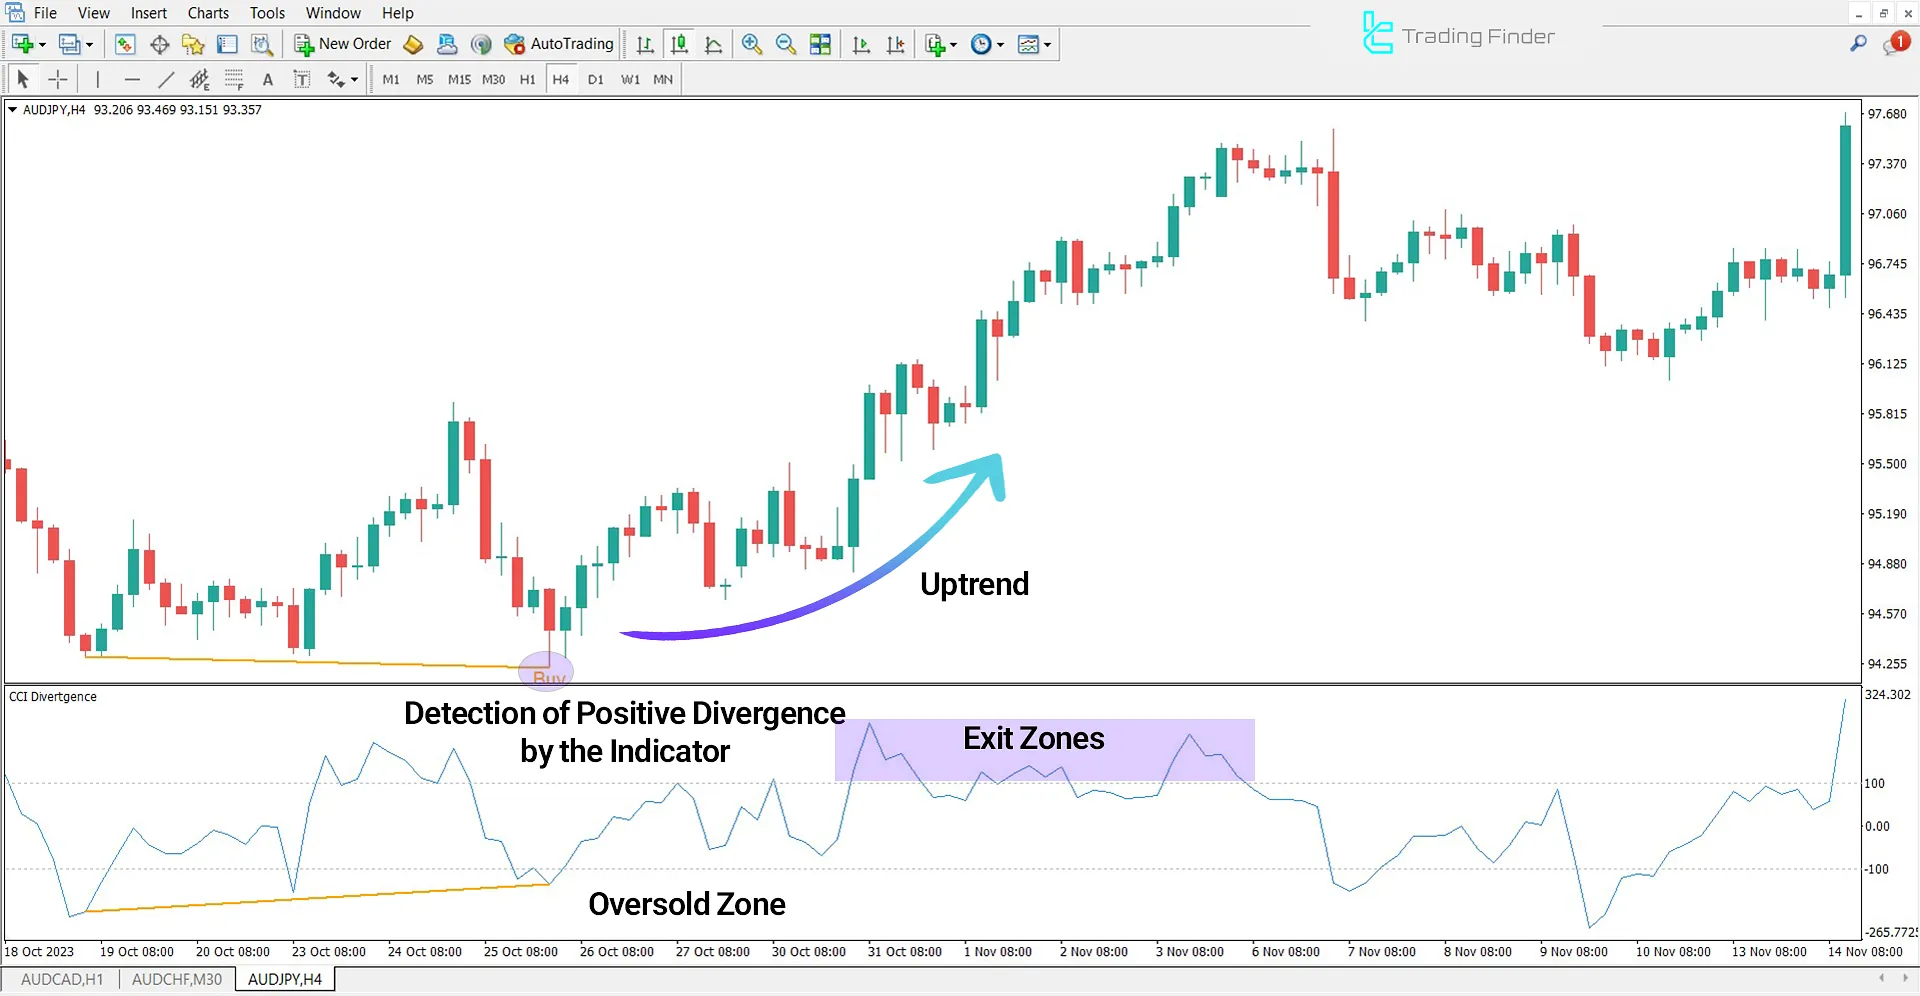
In the 4-hour AUD/JPY chart, the CCI Divergence Indicator identifies a divergence and plots a buy signal line.
Traders can confirm this signal when CCI falls below -100. A drop below this level and subsequent rebound strengthens the buy signal.

Indicator in a Downtrend
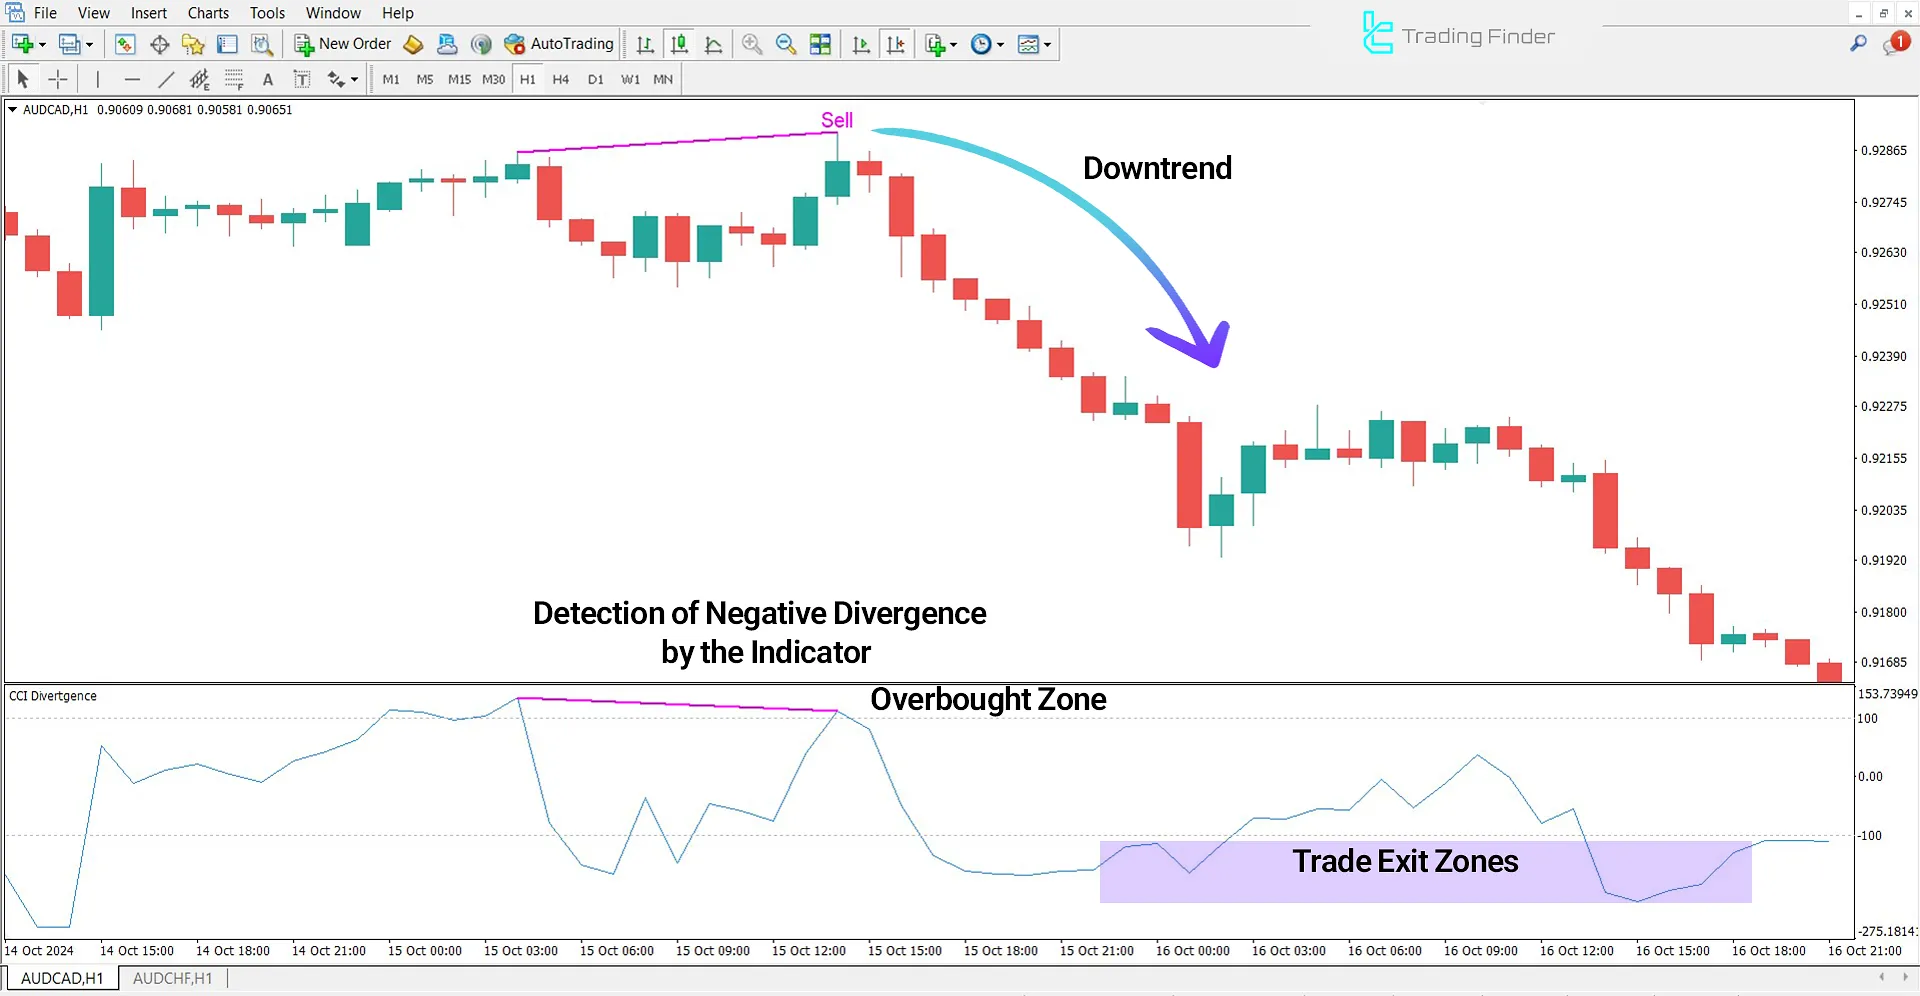
In the 1-hour AUD/CAD chart, the CCI Divergence Indicator identifies price divergence and marks it with a pink line.
If CCI crosses below -100, it signals an overbought condition, indicating potential price stagnation or the start of a bearish correction.

CCI Divergence Indicator Settings
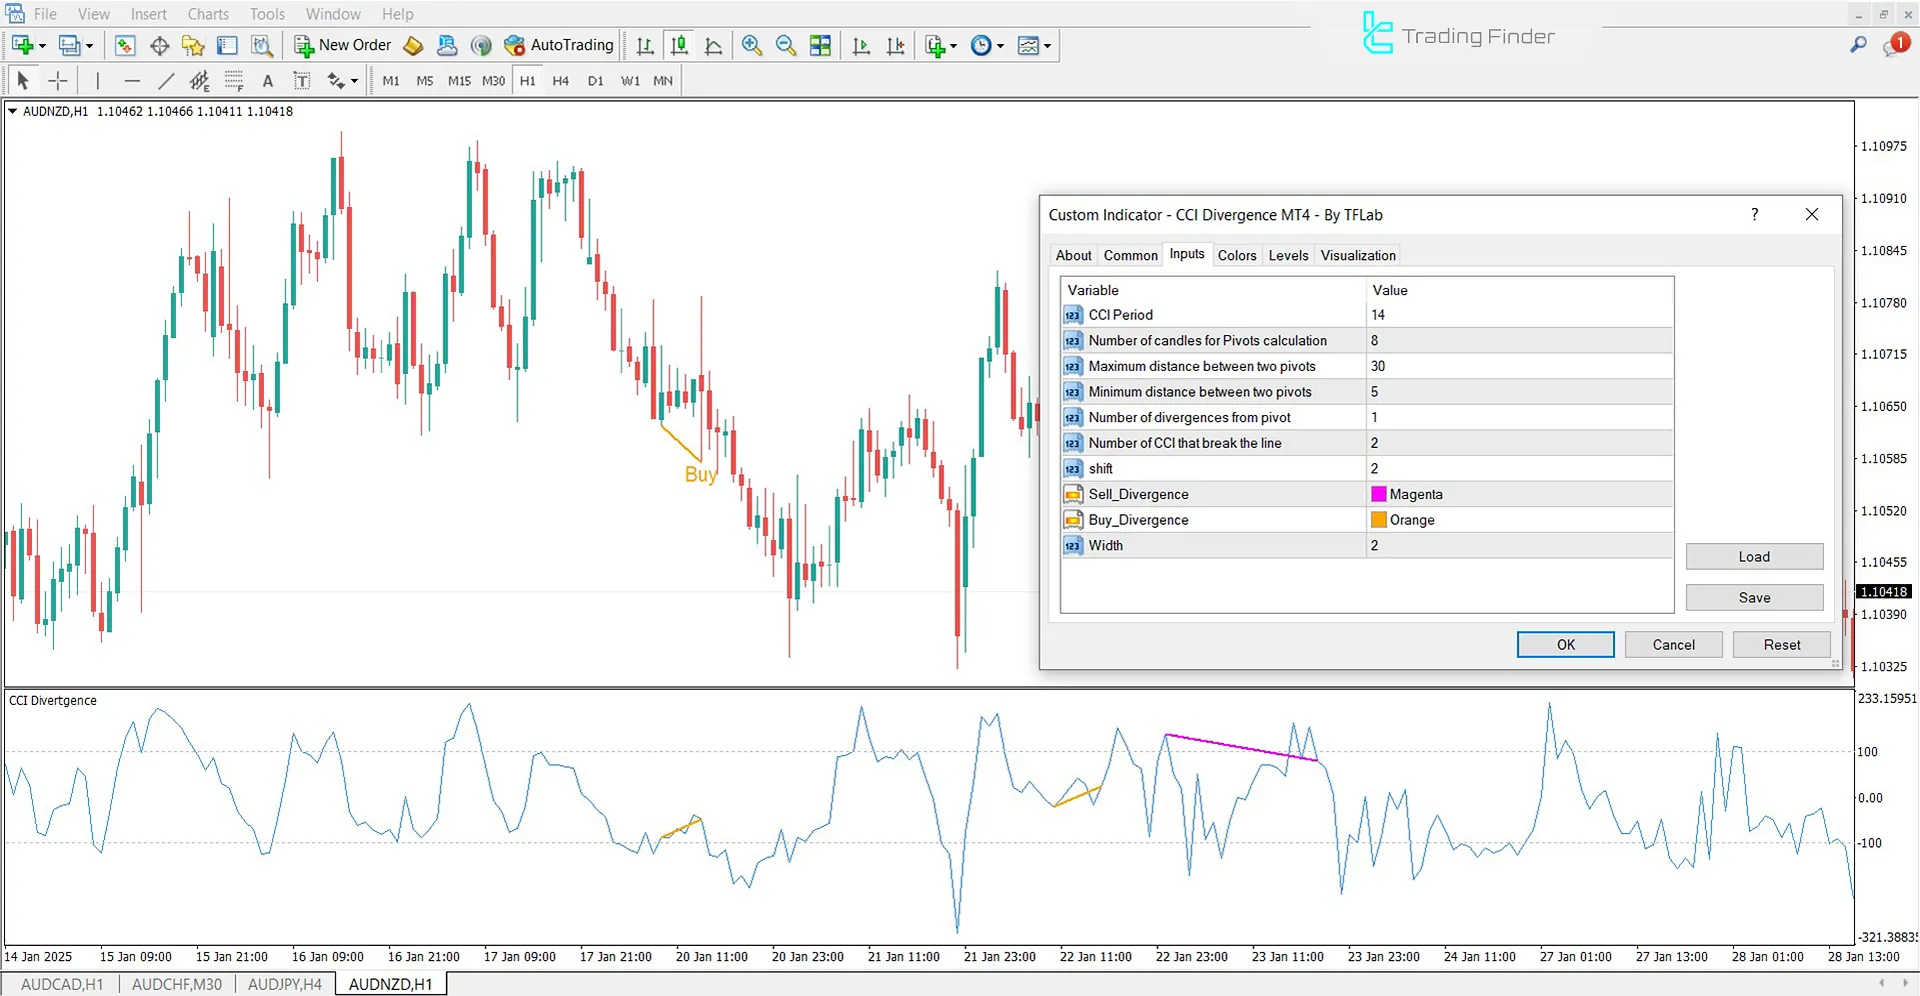
The settings panel for this indicator is displayed in the image below:

- CCI Period: Defines the calculation period for CCI
- Number of candles for Pivots calculation: Specifies the number of candles used for pivot calculation
- Maximum distance between two pivots: Sets the maximum distance between pivots
- Minimum distance between two pivots: Defines the minimum distance between pivots
- Number of divergences from pivot: Determines the number of divergences identified from a pivot
- Number of CCI that break the line: Specifies the number of CCI breaks required to confirm divergence
- Shift: Adjusts the price shift value
- Sell Divergence: Defines the color of the sell divergence signal
- Buy Divergence: Defines the color of the buy divergence signal
- Width: Adjusts the thickness of the divergence lines
Conclusion
The CCI Divergence Oscillator is a tool designed to identify overbought and oversold zones and detect price divergences.
This MetaTrader 4 signal and forecast indicator, by combining divergence signals with overbought and oversold conditions, allows traders to analyze potential trend changes and identify market reversal points.
CCI Divergence MT4 PDF
CCI Divergence MT4 PDF
Click to download CCI Divergence MT4 PDFWhat is the function of the CCI Divergence Indicator in MetaTrader 4?
This indicator is designed to detect price divergences and analyze overbought and oversold zones.
Which timeframes are suitable for the CCI Divergence Indicator?
This indicator is multi-timeframe compatible and suitable for all markets.


