![CCI Histogram indicator for MetaTrader 4 Download – [TradingFinder]](https://cdn.tradingfinder.com/image/205276/2-16-en-cci-histogram-mt4-1.webp)
![CCI Histogram indicator for MetaTrader 4 Download – [TradingFinder] 0](https://cdn.tradingfinder.com/image/205276/2-16-en-cci-histogram-mt4-1.webp)
![CCI Histogram indicator for MetaTrader 4 Download – [TradingFinder] 1](https://cdn.tradingfinder.com/image/205289/2-16-en-cci-histogram-mt4-2.webp)
![CCI Histogram indicator for MetaTrader 4 Download – [TradingFinder] 2](https://cdn.tradingfinder.com/image/205287/2-16-en-cci-histogram-mt4-3.webp)
![CCI Histogram indicator for MetaTrader 4 Download – [TradingFinder] 3](https://cdn.tradingfinder.com/image/205288/2-16-en-cci-histogram-mt4-4.webp)
The CCI Histogram indicator is a modified Commodity Channel Index (CCI) Oscillator version. This MetaTrader 4 indicator detects price fluctuations and generates Buy and Sell signals in financial markets.
CCI Histogram Specification Table
The specifications of the CCI Histogram indicator are presented in the table below:
Indicator Categories: | Oscillators MT4 Indicators Volatility MT4 Indicators Currency Strength MT4 Indicators |
Platforms: | MetaTrader 4 Indicators |
Trading Skills: | Intermediate |
Indicator Types: | Range MT4 Indicators Breakout MT4 Indicators |
Timeframe: | Multi-Timeframe MT4 Indicators |
Trading Style: | Intraday MT4 Indicators |
Trading Instruments: | Share Stocks MT4 Indicators Indices Market MT4 Indicators Commodity Market MT4 Indicators Stock Market MT4 Indicators Cryptocurrency MT4 Indicators Forex MT4 Indicators |
Uptrend Conditions
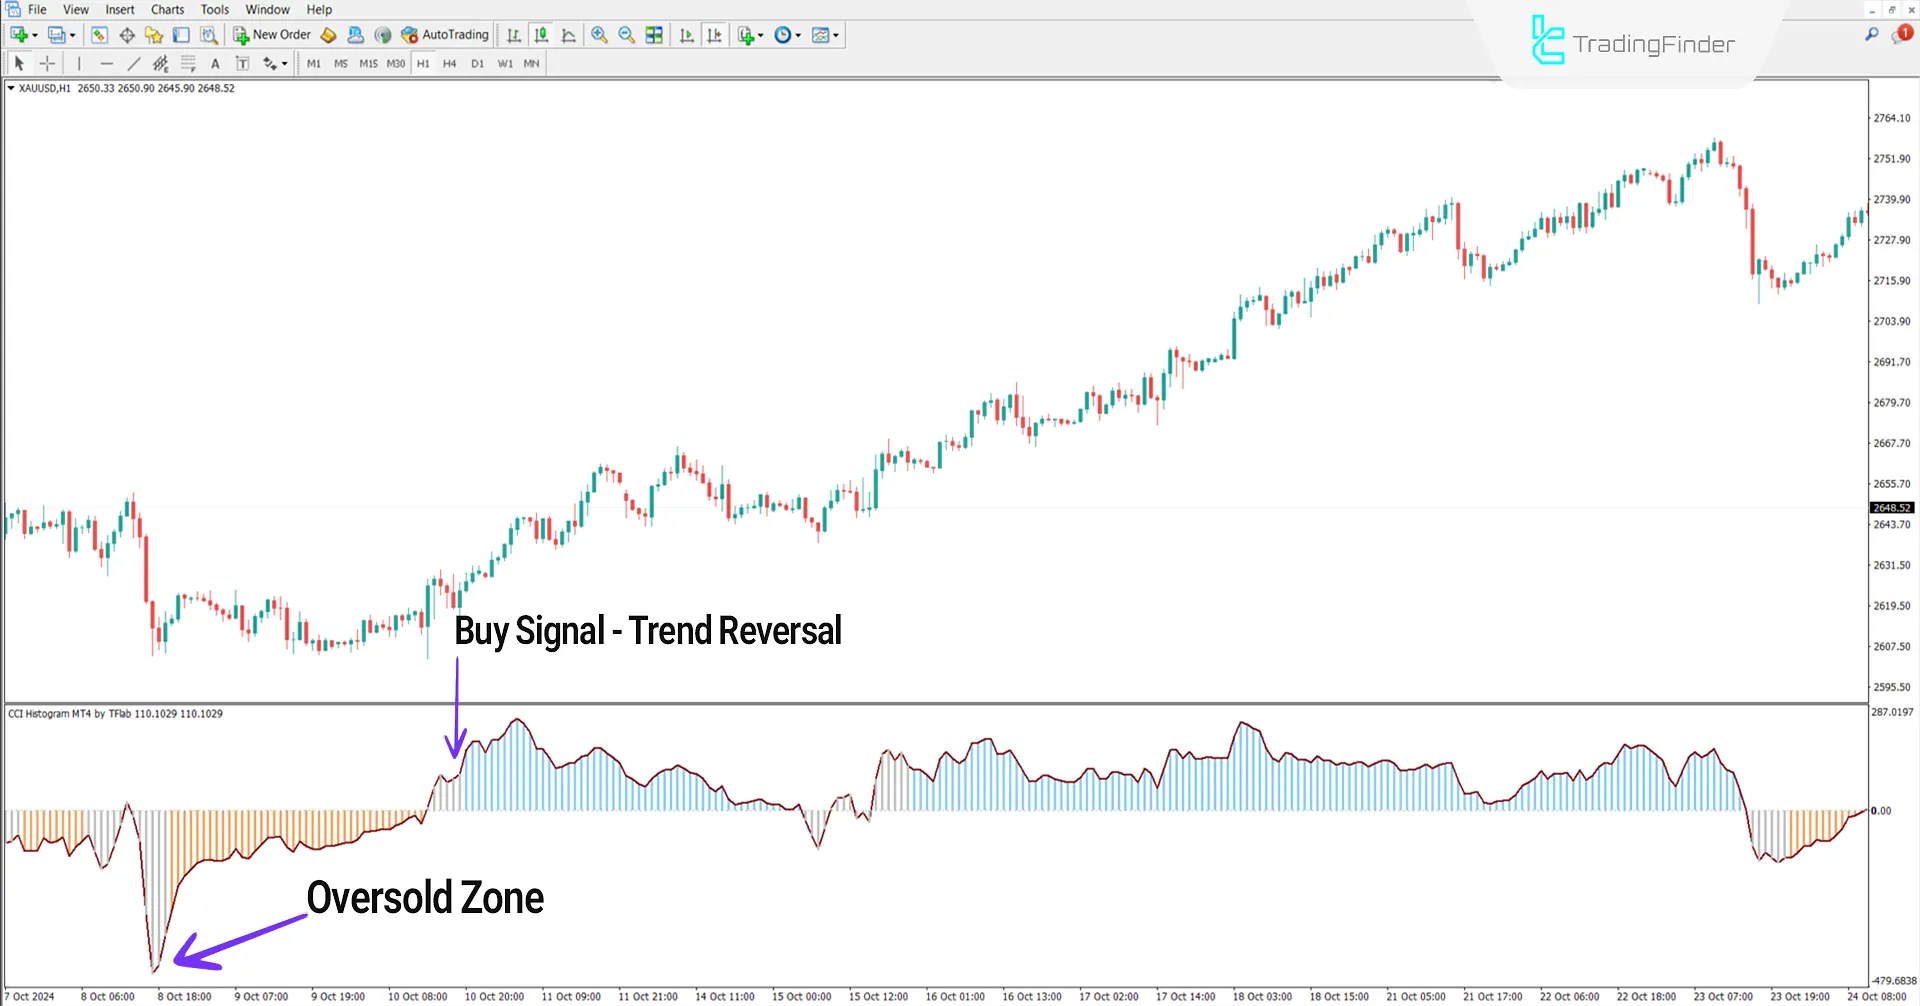
The following price chart shows the global gold price against the US dollar (XAUUSD) in a 1-hour timeframe.
When the orange histogram crosses below the -100 level and then rebounds upward, it indicates an oversold condition in the market, suggesting a potential start of an uptrend.
Therefore, a return above the -100 level can be considered a valid Buy signal.

Downtrend Conditions
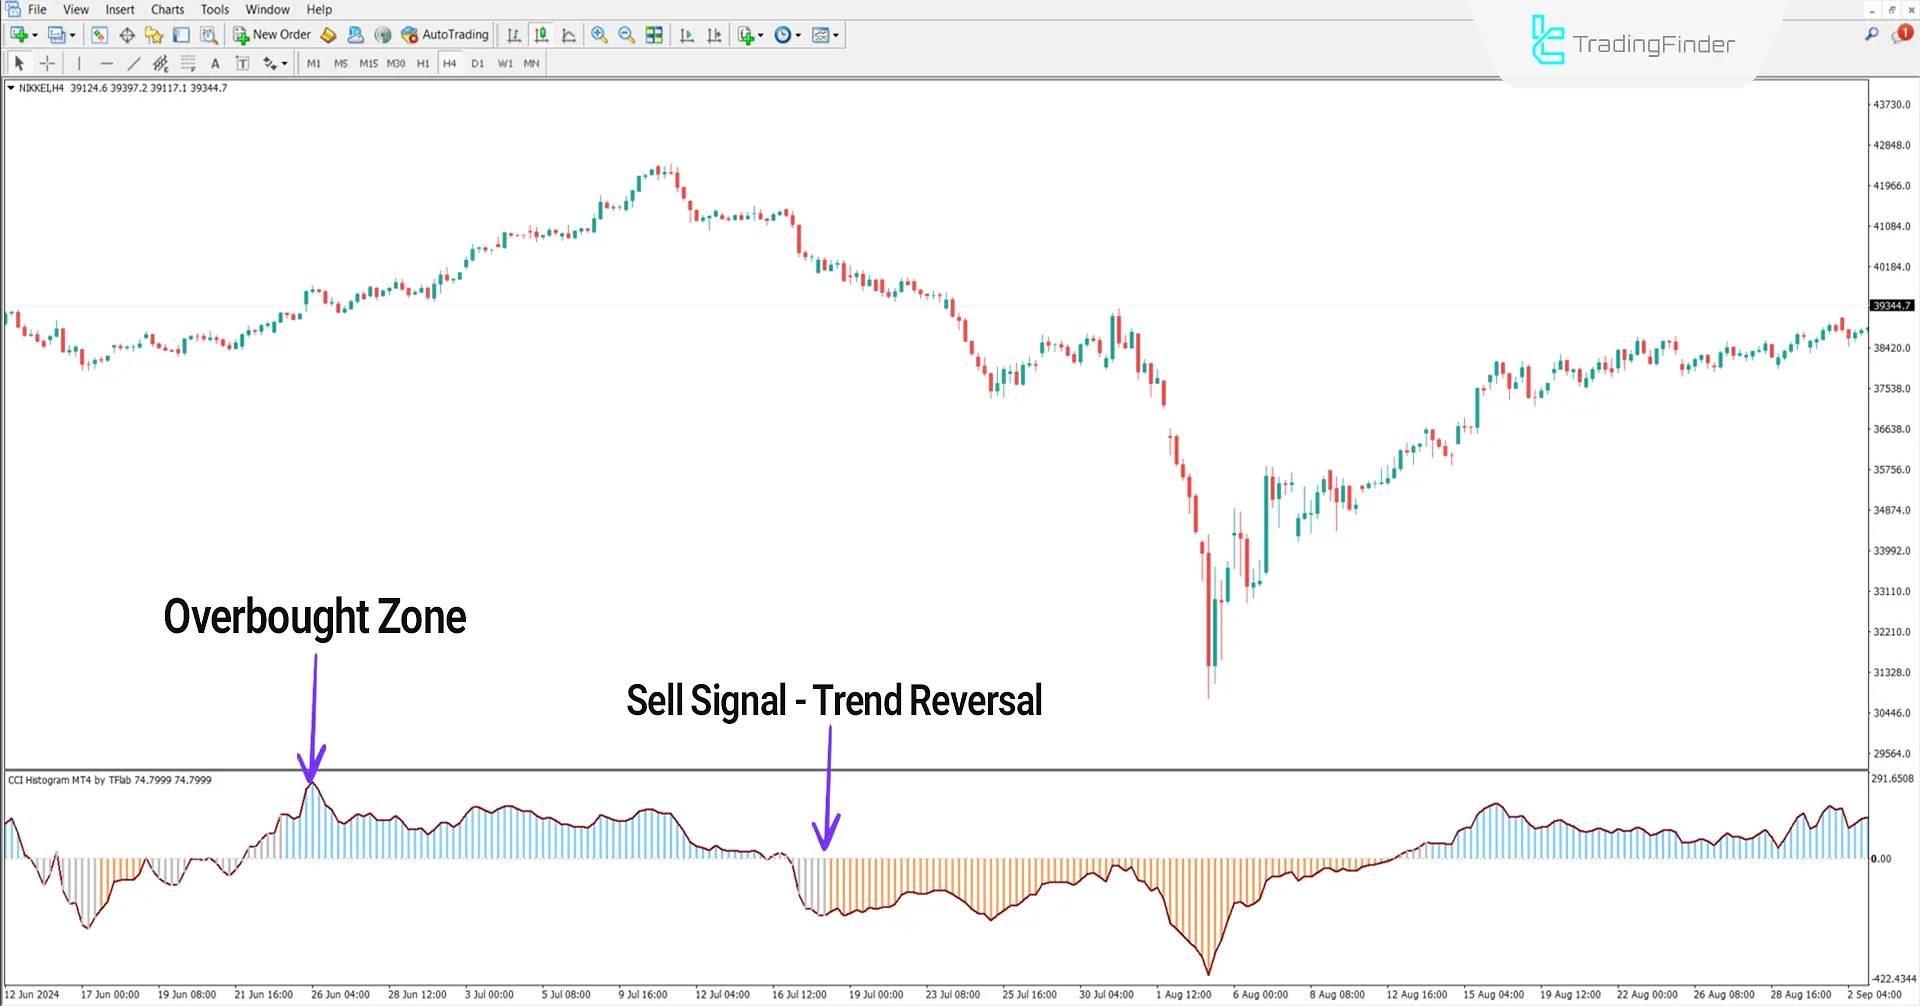
The chart below displays the Nikkei 225 index in a 4-hour timeframe. When the blue histogram exceeds the +100 level and falls below it, the market becomes overbought, indicating a possible start of a downtrend.
Returning from the +100 level and a subsequent downward move can be considered a Sell signal.

Indicator Settings
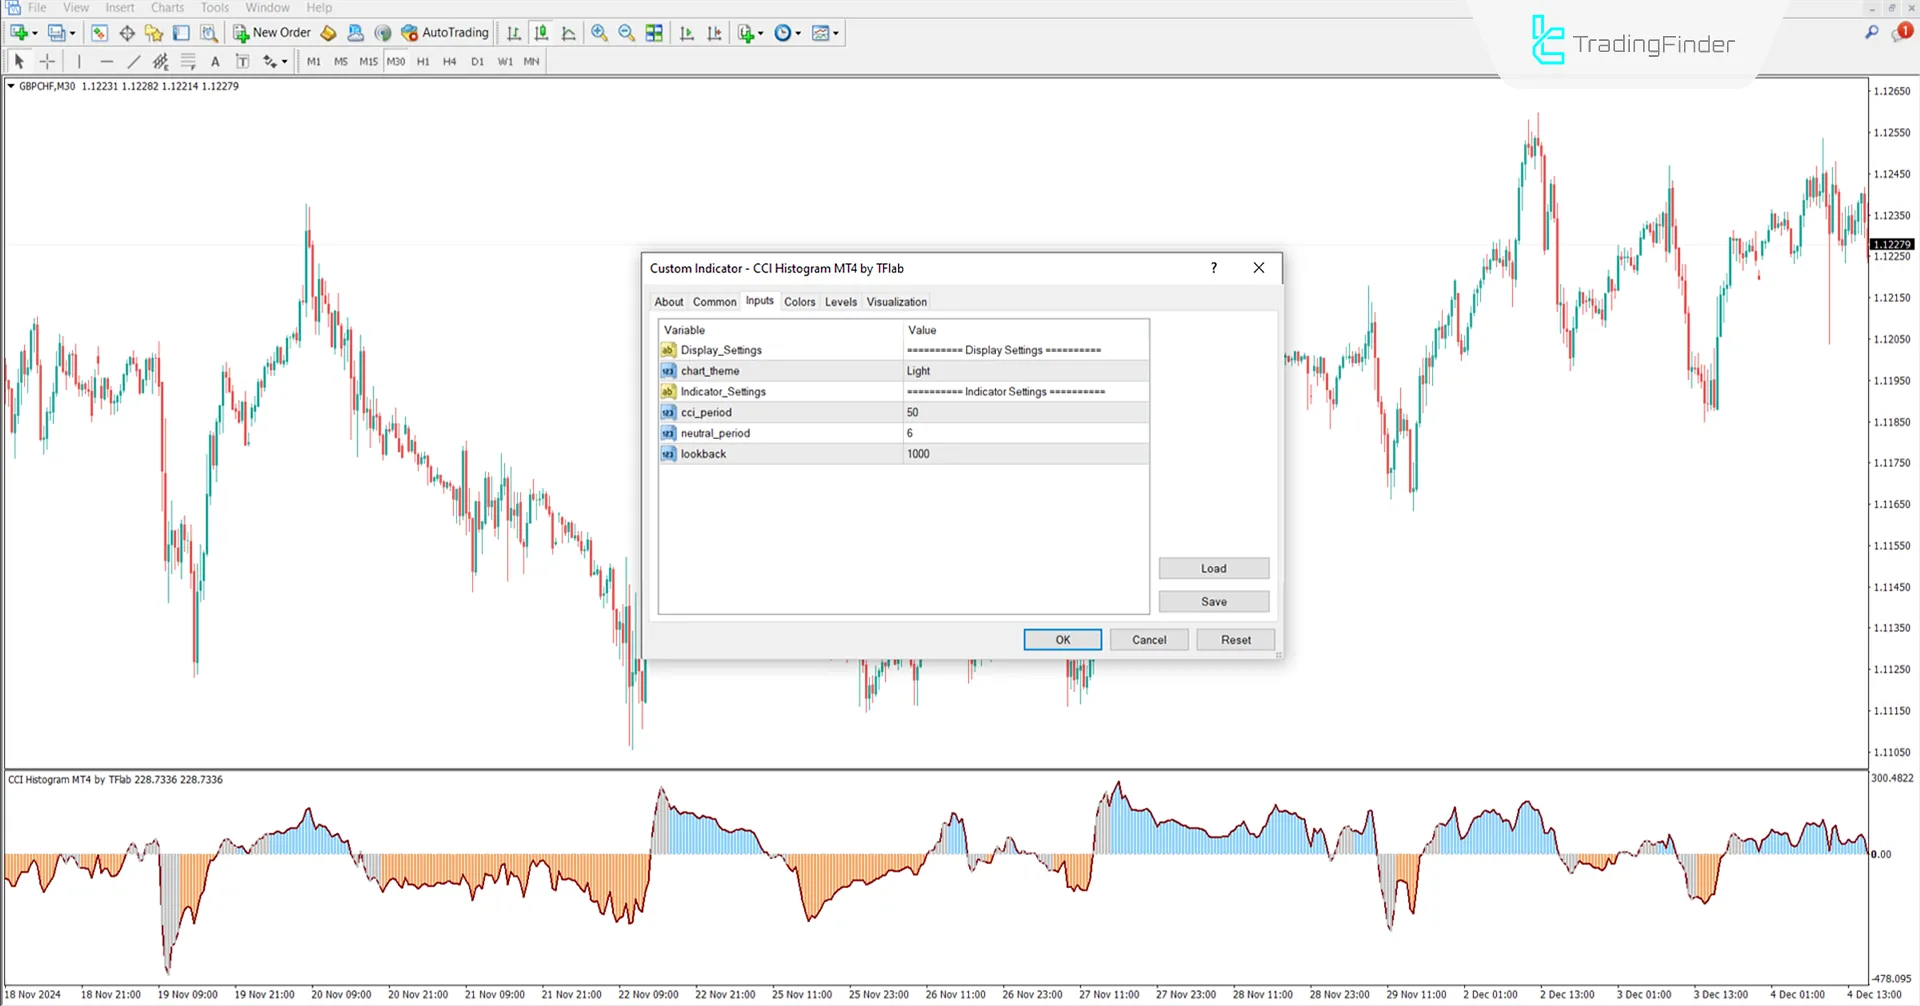
Settings for theCCI Histogram in MetaTrader 4 indicator are as follows:
- Chart theme: Chart appearance style;
- Cci period: CCI calculation period;
- Neutral period: Neutral state duration;
- Lookback: Review past candles.
Conclusion
The CCI Histogram indicator is a powerful indicator for identifying overbought and oversold conditions and reversal points in highly volatile markets.
It is especially effective in conditions with significant price changes.
CCI Histogram indicator Meta MT4 PDF
CCI Histogram indicator Meta MT4 PDF
Click to download CCI Histogram indicator Meta MT4 PDFWhat is the appropriate timeframe for using this indicator?
This indicator is multi-timeframe and can be applied to all timeframes.
Is this indicator only used in ranging markets?
No, this indicator applies to ranging markets and is valuable for detecting trend reversals.


