


![Center of Gravity (COG) Indicator for MetaTrader 4 Download - Free [TradingFinder]](https://cdn.tradingfinder.com/image/111209/11-15-en-center-of-gravity-mt4.webp)
![Center of Gravity (COG) Indicator for MetaTrader 4 Download - Free [TradingFinder] 1](https://cdn.tradingfinder.com/image/111228/11-15-en-center-of-gravity-mt4-2.webp)
![Center of Gravity (COG) Indicator for MetaTrader 4 Download - Free [TradingFinder] 2](https://cdn.tradingfinder.com/image/111239/11-15-en-center-of-gravity-mt4-3.webp)
![Center of Gravity (COG) Indicator for MetaTrader 4 Download - Free [TradingFinder] 3](https://cdn.tradingfinder.com/image/111254/11-15-en-center-of-gravity-mt4-4.webp)
On July 22, 2025, in version 2, alert/notification and signal functionality was added to this indicator
The Center of Gravity (COG) Indicator is a non-lagging MT4 Oscillator that quickly identifies price reversal points.
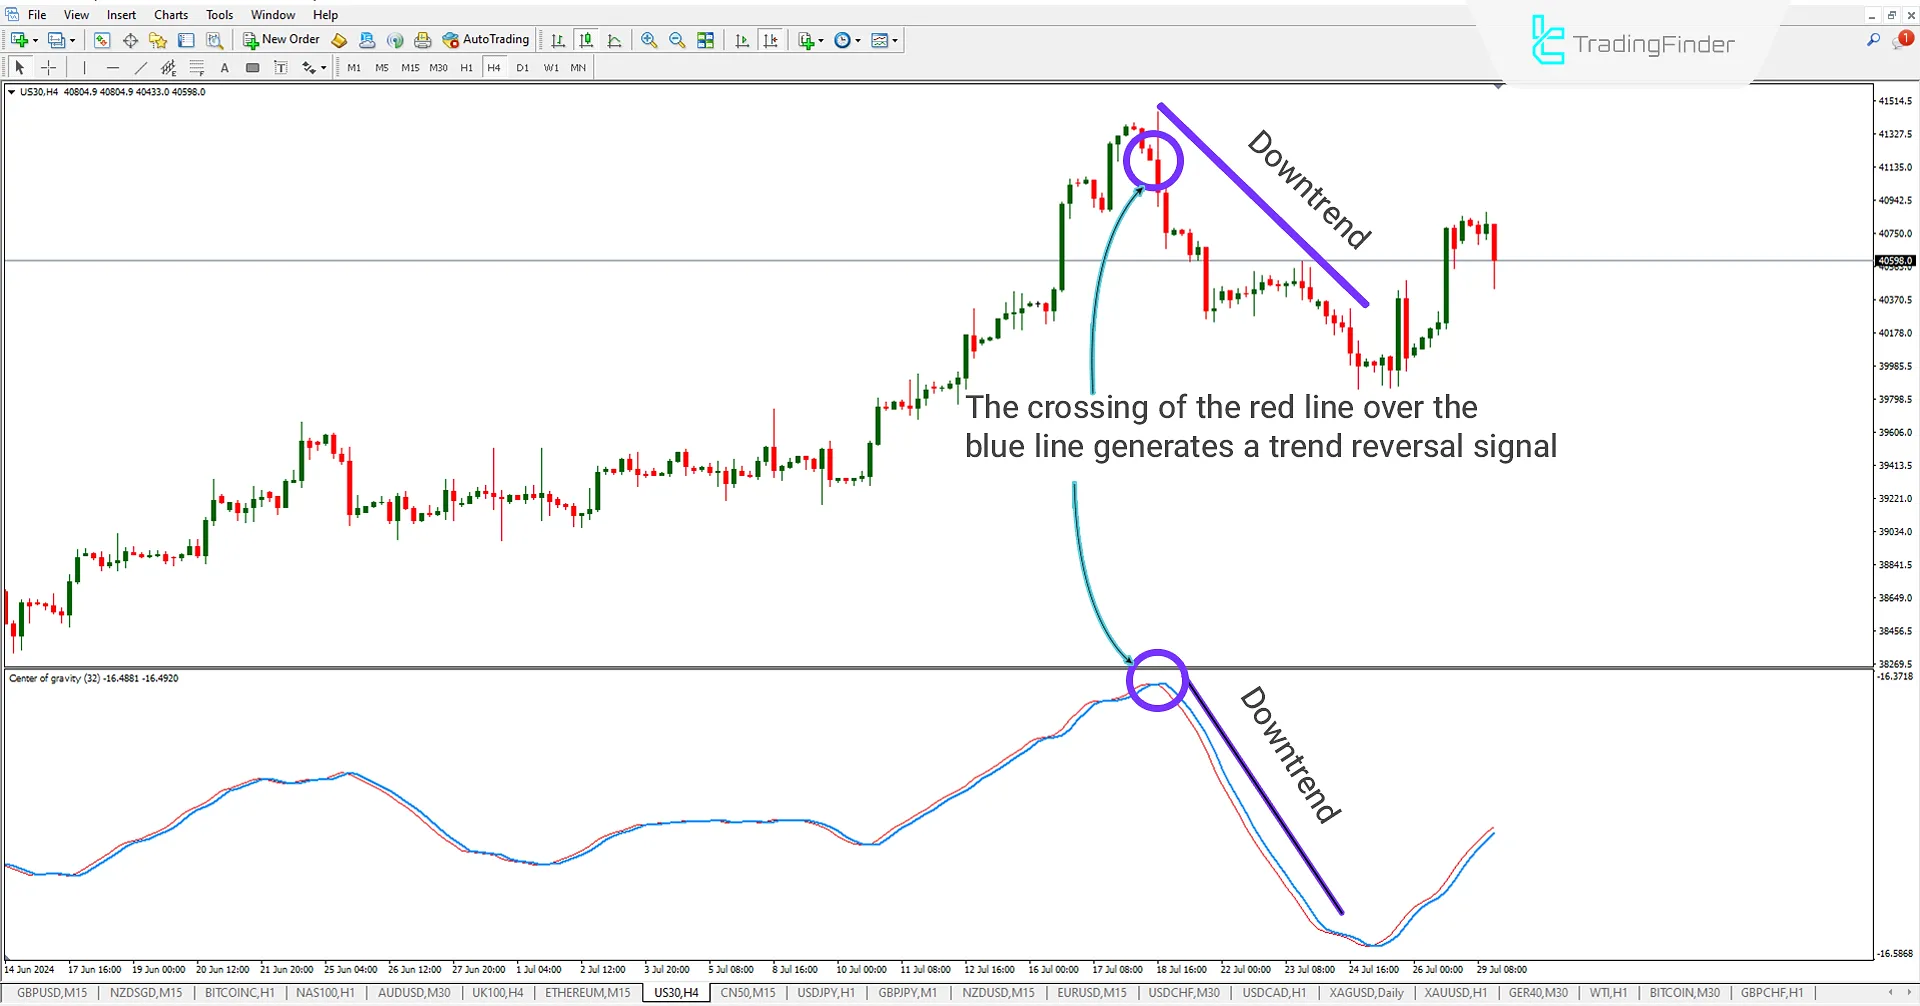
The COG Indicator uses two oscillator lines: a red line that provides a confirmation signal and a blue line that confirms the trend. A trend reversal signal is generated when the red line crosses the blue line.
COG Indicator Table
Indicator Categories: | Oscillators MT4 Indicators Signal & Forecast MT4 Indicators Educational MT4 Indicators |
Platforms: | MetaTrader 4 Indicators |
Trading Skills: | Elementary |
Indicator Types: | Leading MT4 Indicators Reversal MT4 Indicators |
Timeframe: | M1-M5 Time MT4 Indicators M15-M30 Time MT4 Indicators H4-H1 Time MT4 Indicators |
Trading Style: | Day Trading MT4 Indicators Intraday MT4 Indicators Scalper MT4 Indicators |
Trading Instruments: | Indices Market MT4 Indicators Cryptocurrency MT4 Indicators Forex MT4 Indicators |
Indicator at a Glance
The Center of Gravity Indicator is a practical Trading tool that identifies trend reversal points.
This MT4 signal and forecast indicator consists of two oscillating lines: a blue line for trend confirmation and a red signal line that acts as a signal confirmer. Traders can enter buy or sell trades when these two lines cross.
Trend Reversal Signal
In the 4-hour chart of US30, when the red line crosses below the blue line, the COG Indicator issues a trend reversal signal from bullish to bearish.
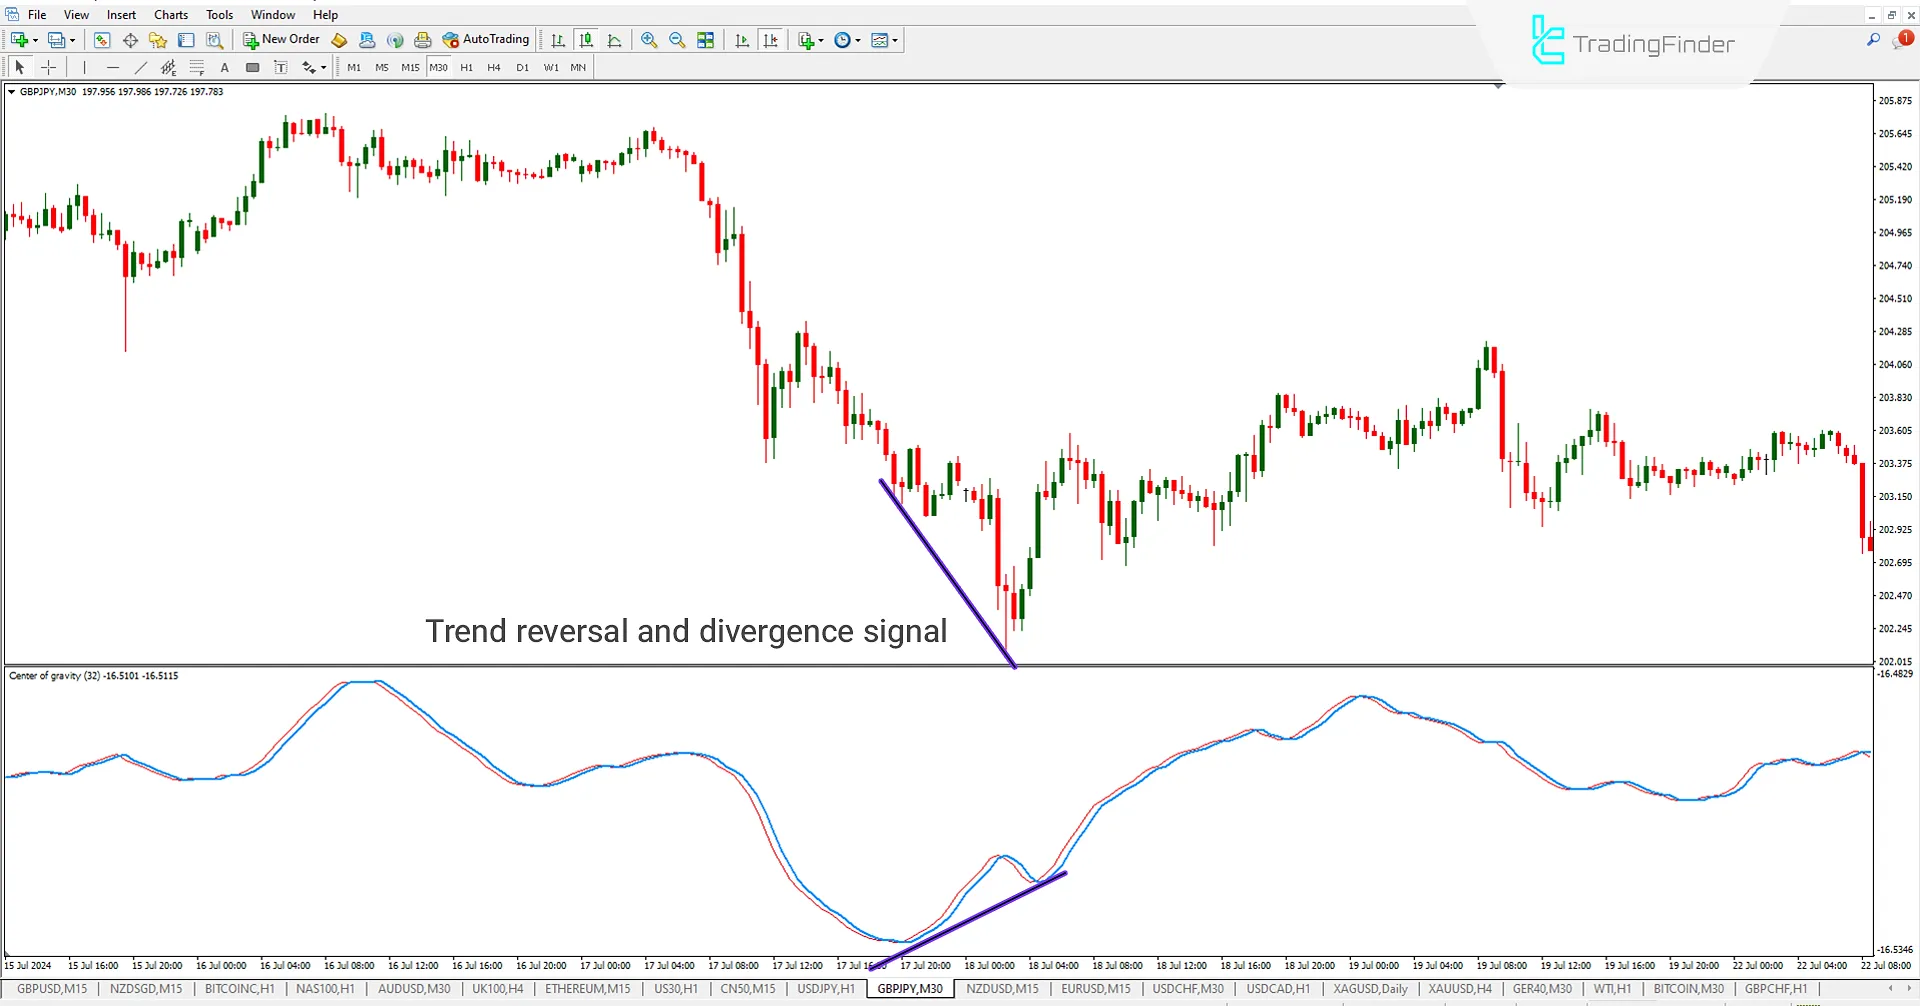
Divergence in the COG Indicator
In the 30-minute chart of GBP/JPY, the price is in a downtrend, and the COG Indicator shows a trend divergence. With the appearance of divergence in the indicator, the market trend changes, and an uptrend forms.
COG Indicator Settings
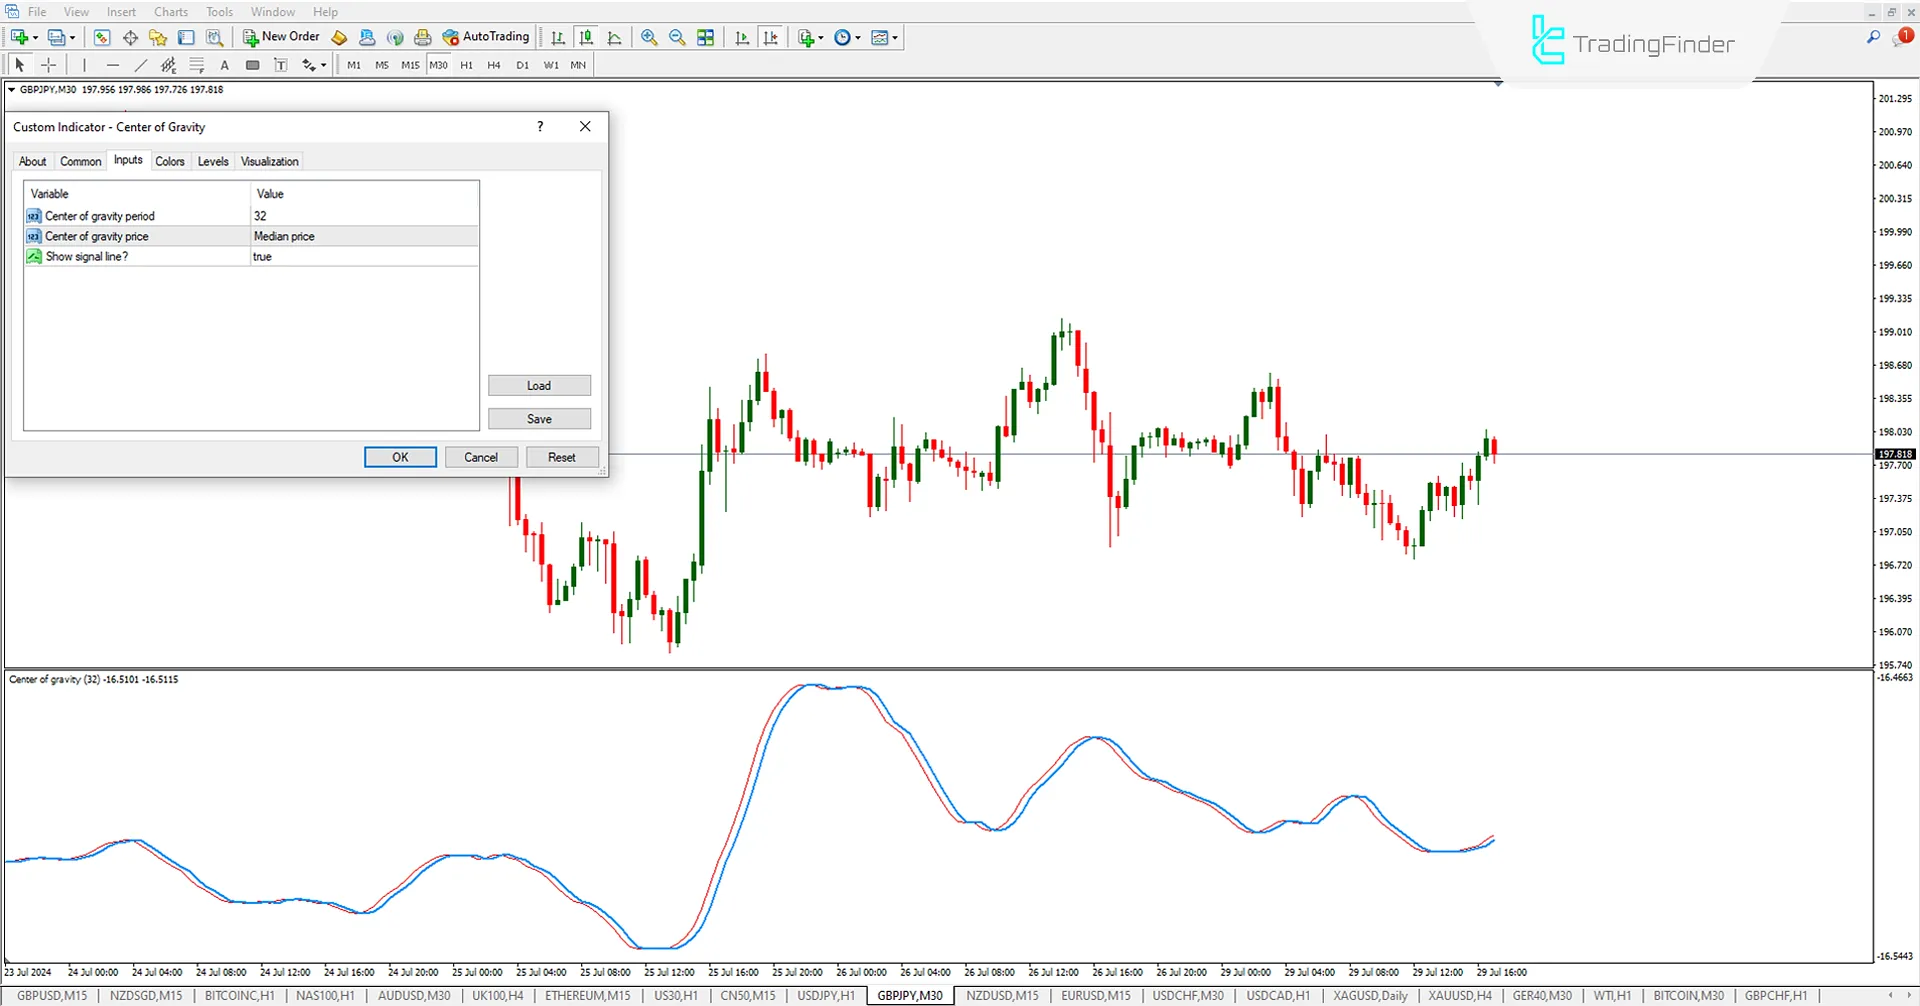
- Centre Of Gravity Period: Period settings;
- Centre Of Gravity Price: Calculation type settings based on moving average;
- Show Signal Line: Display signal.
Conclusion
The Center of Gravity (COG) Indicator operates based on a moving averages indicator and helps traders predict future prices. The COG Indicator can assist in trading decisions by analyzing the price trend or its reversal.
Center Gravity COG MT4 PDF
Center Gravity COG MT4 PDF
Click to download Center Gravity COG MT4 PDFHow does the COG Indicator work?
The COG Indicator functions as an oscillator that oscillates around a central axis. It is calculated using mathematical formulas based on past prices and aims to predict trend reversal points.
What are the advantages of using the COG Indicator?
This indicator provides traders with accurate price reversal points while reducing market noise.


