


On July 1, 2025, in version 2, alert/notification and signal functionality was added to this indicator
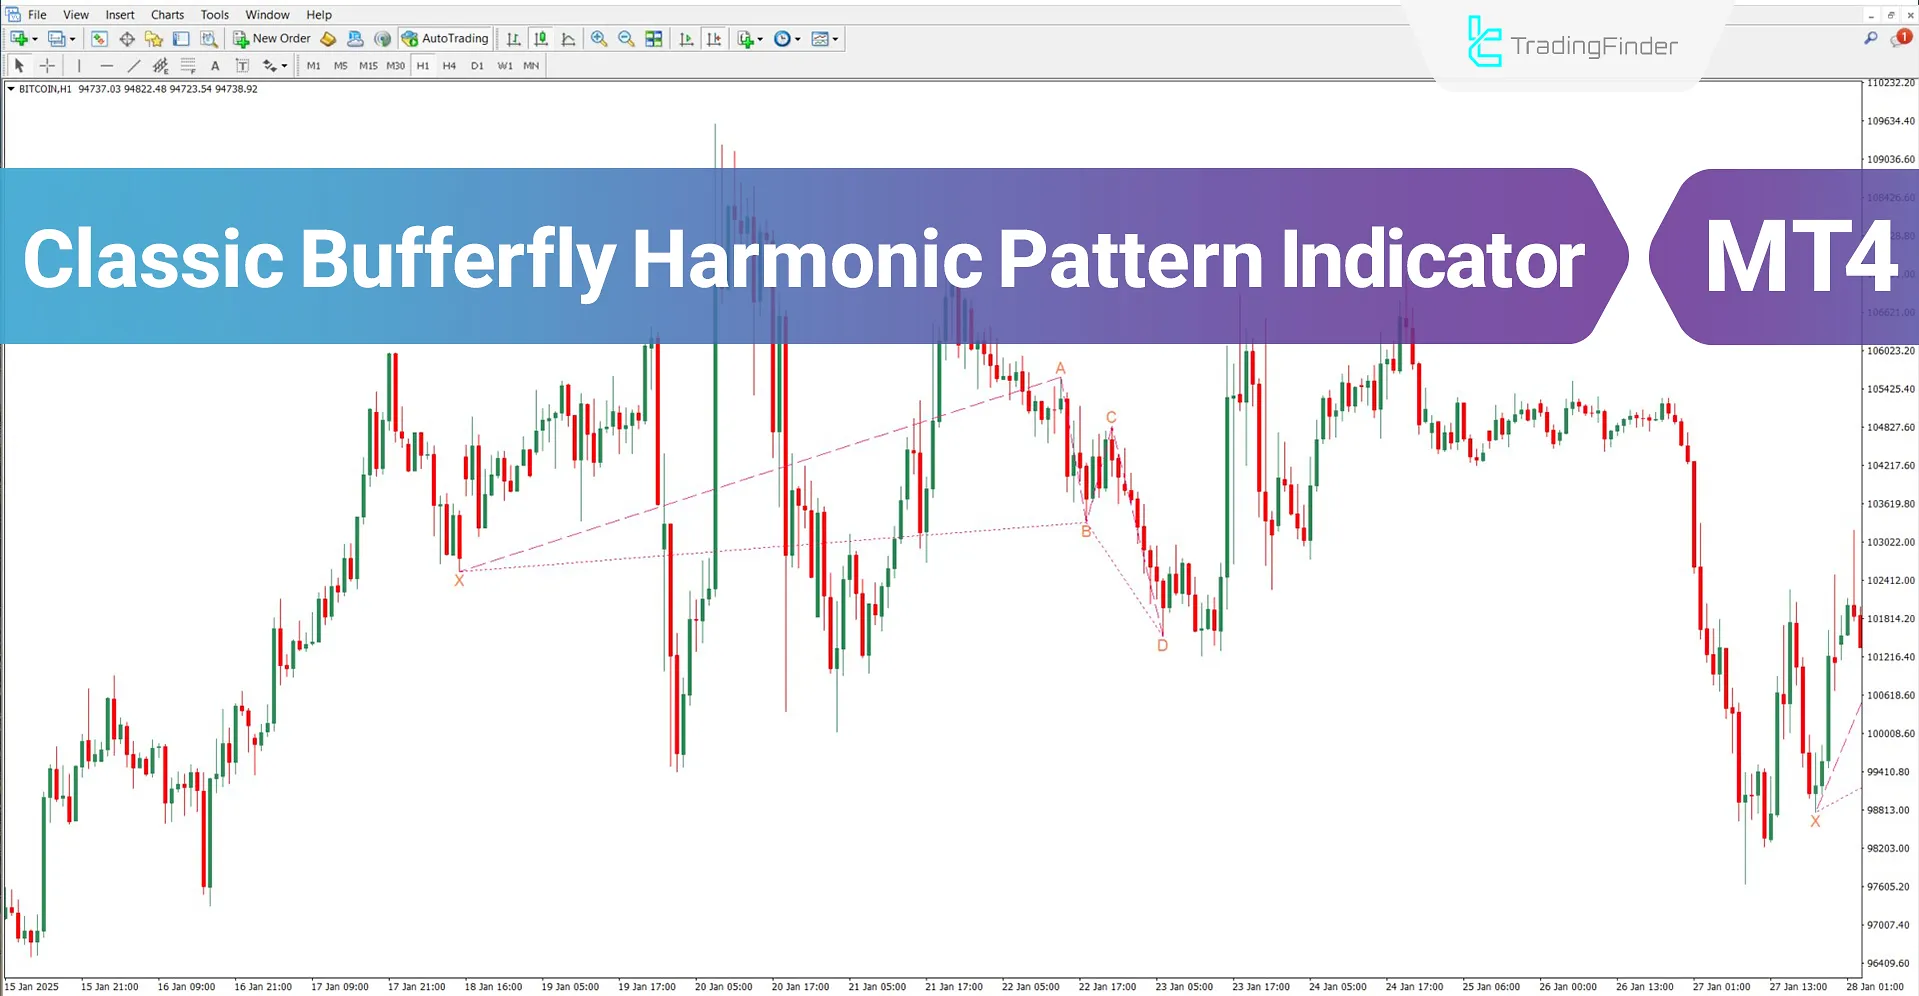
The Classic Butterfly Harmonic Pattern Indicator is designed to visually plot butterfly patterns on the chart to highlight price reversal points. What sets this pattern apart from other harmonic patterns is the placement of point "D" beyond the initial point "X."
Typically, the appearance of this pattern indicates the end of the current trend and the beginning of a new one. This trading tool displays bullish patterns in pink and bearish patterns in blue.
Classic Butterfly Harmonic Pattern Indicator Specifications Table
The table below provides specifications for the Classic Butterfly Harmonic Pattern Indicator:
Indicator Categories: | Chart & Classic MT4 Indicators Harmonic MT4 Indicators Candle Sticks MT4 Indicators |
Platforms: | MetaTrader 4 Indicators |
Trading Skills: | Intermediate |
Indicator Types: | Reversal MT4 Indicators |
Timeframe: | Multi-Timeframe MT4 Indicators |
Trading Style: | Intraday MT4 Indicators |
Trading Instruments: | Share Stocks MT4 Indicators Indices Market MT4 Indicators Commodity Market MT4 Indicators Stock Market MT4 Indicators Cryptocurrency MT4 Indicators Forex MT4 Indicators |
Classic Butterfly Harmonic Pattern Indicator at a Glance
This indicator uses specific Fibonacci ratios to create the Butterfly harmonic pattern:
- Wave AB is typically a 78.6% Fibonacci retracement of wave XA
- Wave BC can be a 38.2% to 88.6% retracement of wave AB
- Wave CD can be a 127.2% or 161.8% Fibonacci extension of wave XA
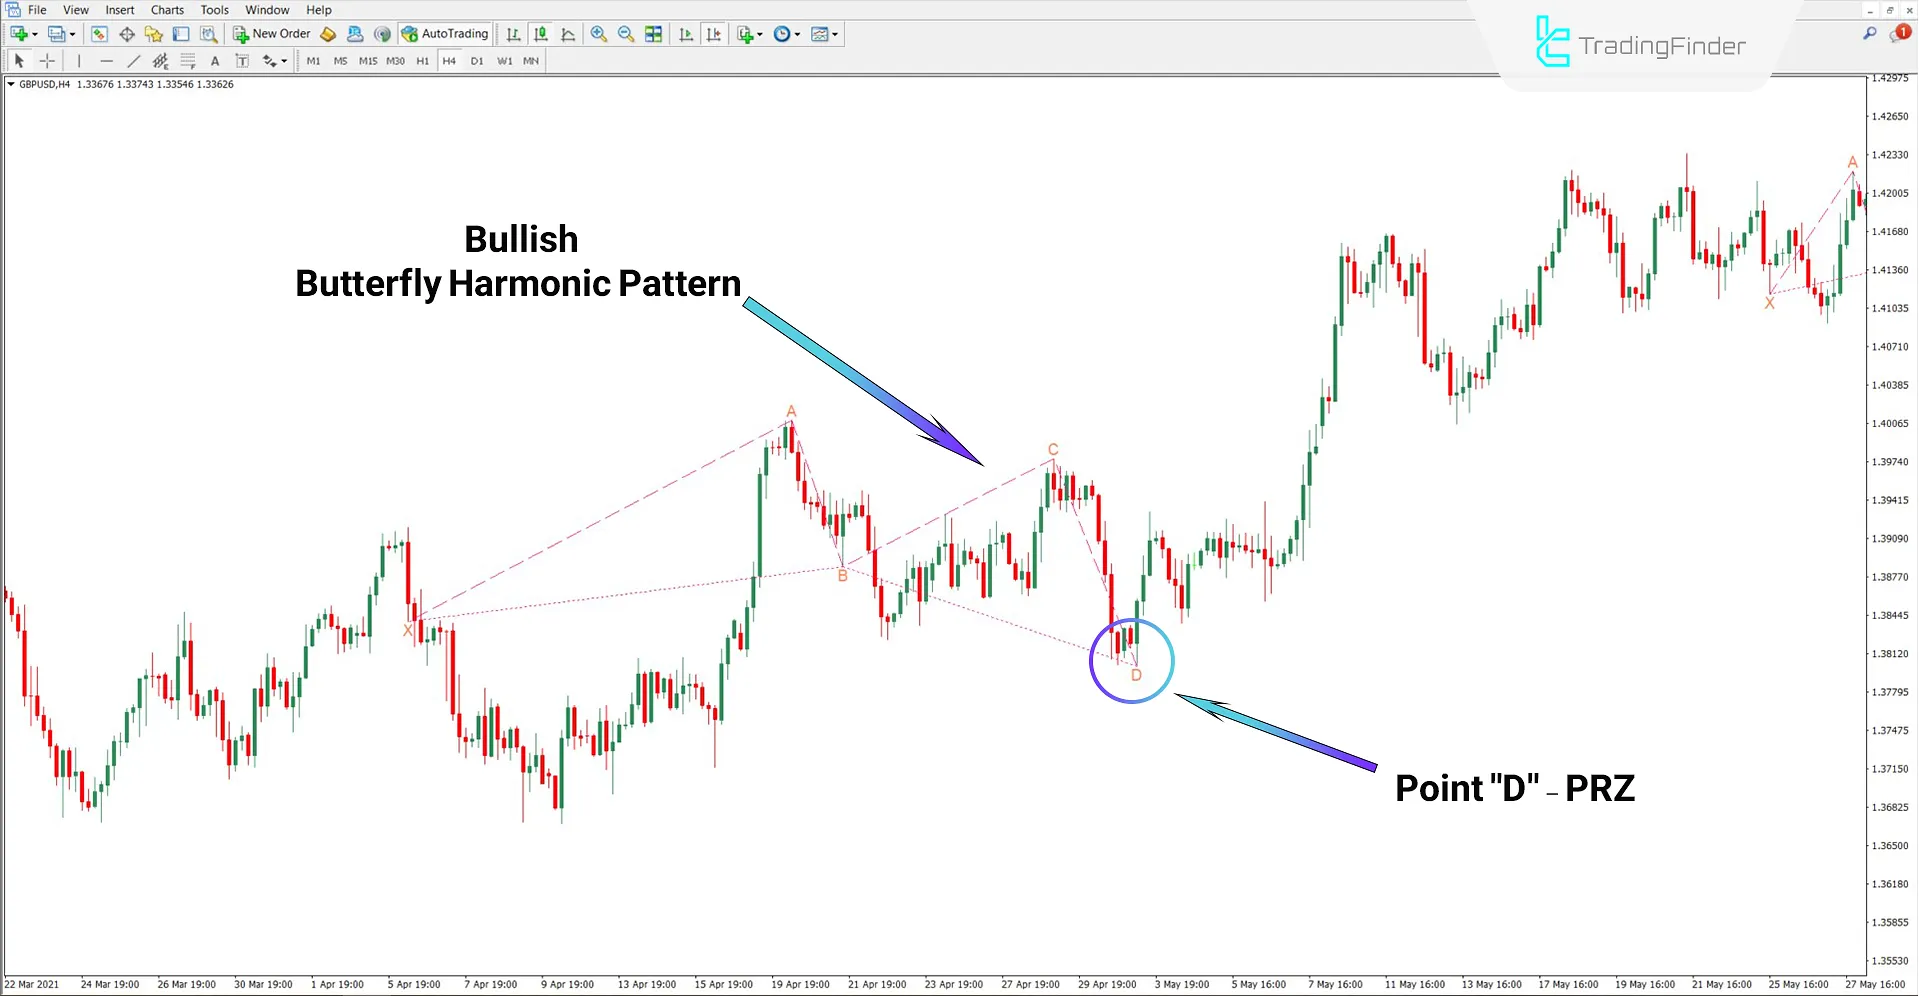
Bullish Trend Conditions
Based on the GBP/USD currency pair chart in the 4-hour time frame, a bullish Butterfly pattern is drawn in the shape of the letter "M" and colored in pink.
As shown in the image, after the pattern completes at point "D," the market reverses direction and moves toward higher price levels.
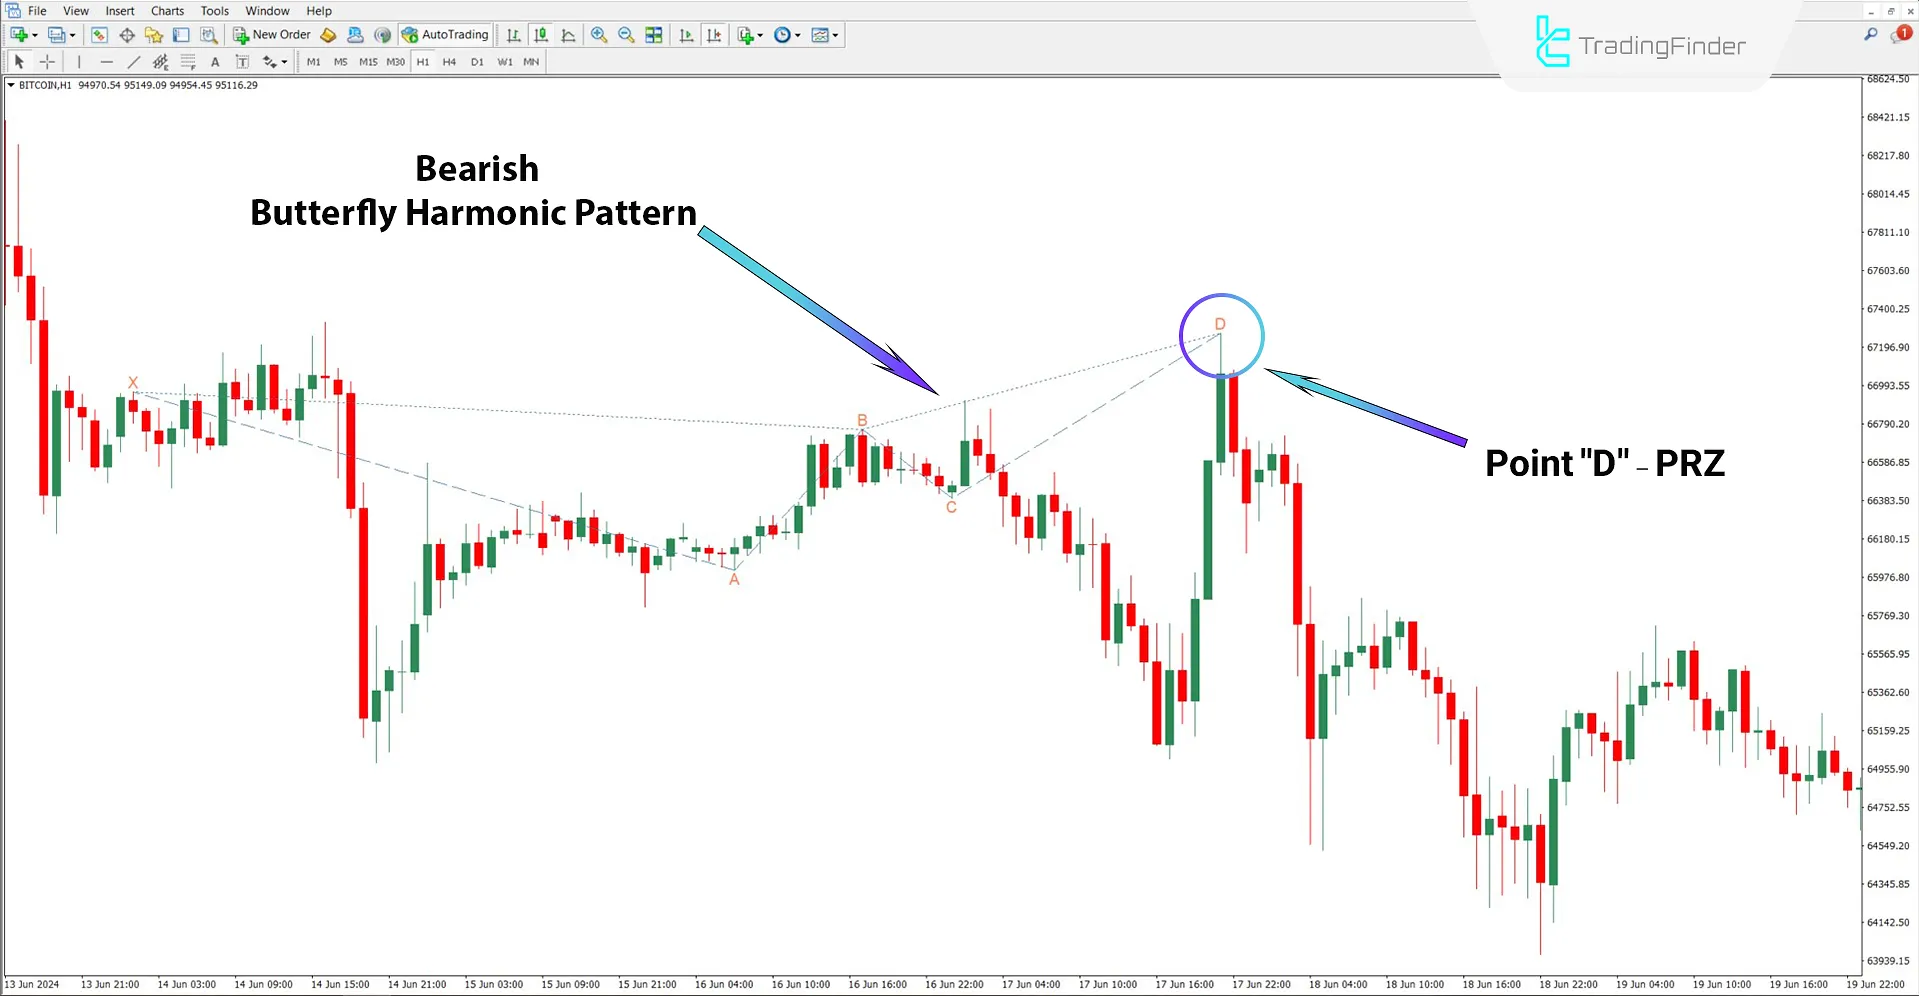
Bearish Trend Conditions
According to the Bitcoin (BTC) chart in the 1-hour time frame, once detected, the indicator plots a bearish Butterfly pattern in the shape of the letter "W" colored in blue.
Price often tends to reverse in such conditions, and point "D" can be a suitable entry for sell trades.
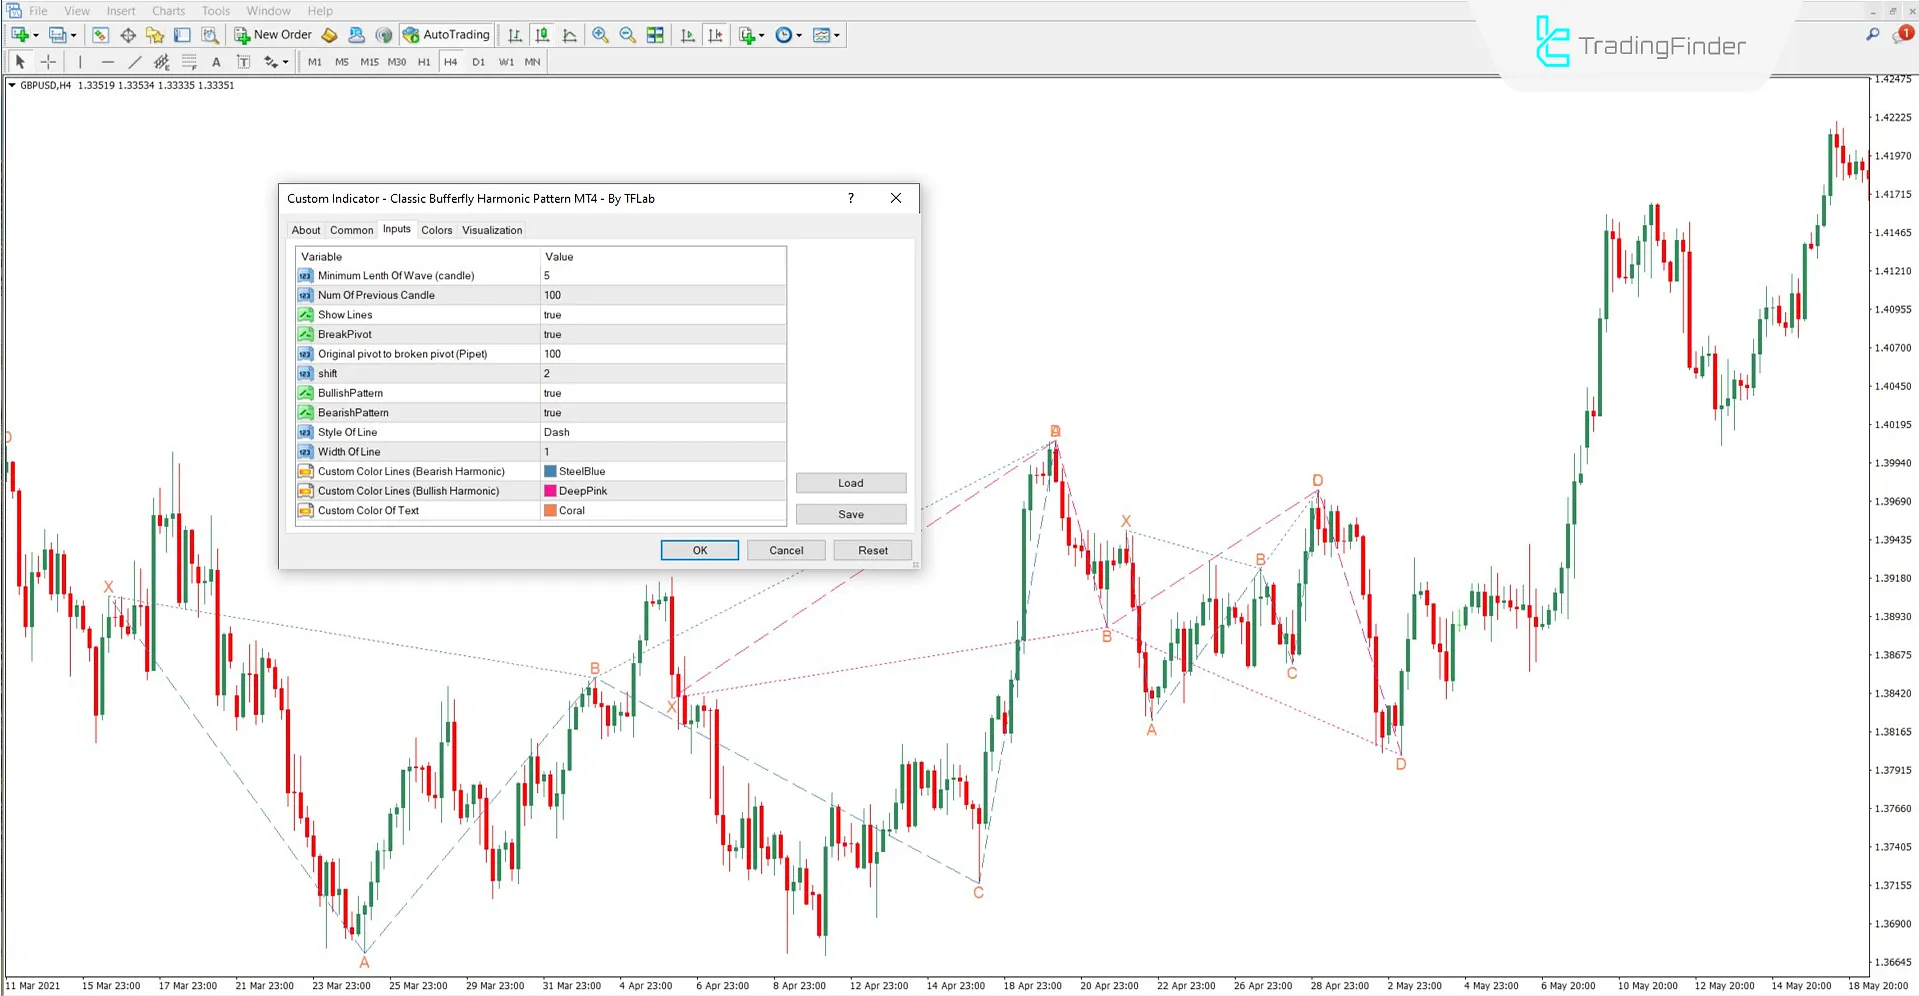
Classic Butterfly Harmonic Pattern Indicator Settings
The image below shows the settings of the Classic Butterfly Harmonic Pattern Indicator:
- Minimum Length of Wave (candle): Minimum number of candles required to form each wave
- Num of Previous Candle: Number of past candles used to identify waves
- Show Lines: Display pattern lines
- Break Pivot: Display or hide broken pivot lines on the chart
- Original pivot to broken pivot (Pipet): Allowed distance between original and broken pivots
- Shift: Move pattern lines forward or backward on the chart
- Bullish Pattern: Display bullish patterns
- Bearish Pattern: Display bearish patterns
- Style of Line: Type of line connecting pattern points
- Width of Line: Thickness of drawn pattern lines
- Custom Color Lines (Bearish Harmonic): Custom line color for bearish patterns
- Custom Color Lines (Bullish Harmonic): Custom line color for bullish patterns
- Custom Color of Text: Text and label color
Conclusion
The Classic Butterfly Harmonic Pattern Indicator effectively identifies price reversal points within strong trends.
By precisely analyzing the (XABCD) structure and marking the Potential Reversal Zone (PRZ), it facilitates trend analysis and optimal entry points for trades.
It is also compatible with various trading strategies and can be used across different markets such as cryptocurrencies, forex, stocks, and commodities.
Classic Butterfly Harmonic Pattern MT4 PDF
Classic Butterfly Harmonic Pattern MT4 PDF
Click to download Classic Butterfly Harmonic Pattern MT4 PDFCan this indicator be used in stock markets?
Yes, it can be used across all markets without any limitation.
Is this trading tool suitable for lower timeframes?
Yes, it is a multi-timeframe indicator and can be used across all timeframes.


