


On July 1, 2025, in version 2, alert/notification and signal functionality was added to this indicator
The Shark Harmonic Pattern Indicator is designed to identify price reversal zones based on the shark pattern's specific structure.
This MT4 classic chart pattern indicator, unlike other classic harmonic patterns, is based on points named O, X, A, B, and C, and uses Fibonacci ratios to create specific conditions for identifying price reversal zones.
Classic Shark Harmonic Pattern Indicator Table
The features of the Classic Shark Harmonic Pattern Indicator are displayed in the table below.
Indicator Categories: | Support & Resistance MT4 Indicators Chart & Classic MT4 Indicators Harmonic MT4 Indicators |
Platforms: | MetaTrader 4 Indicators |
Trading Skills: | Intermediate |
Indicator Types: | Reversal MT4 Indicators |
Timeframe: | Multi-Timeframe MT4 Indicators |
Trading Style: | Day Trading MT4 Indicators |
Trading Instruments: | Share Stocks MT4 Indicators Forward Market MT4 Indicators Stock Market MT4 Indicators Cryptocurrency MT4 Indicators Forex MT4 Indicators |
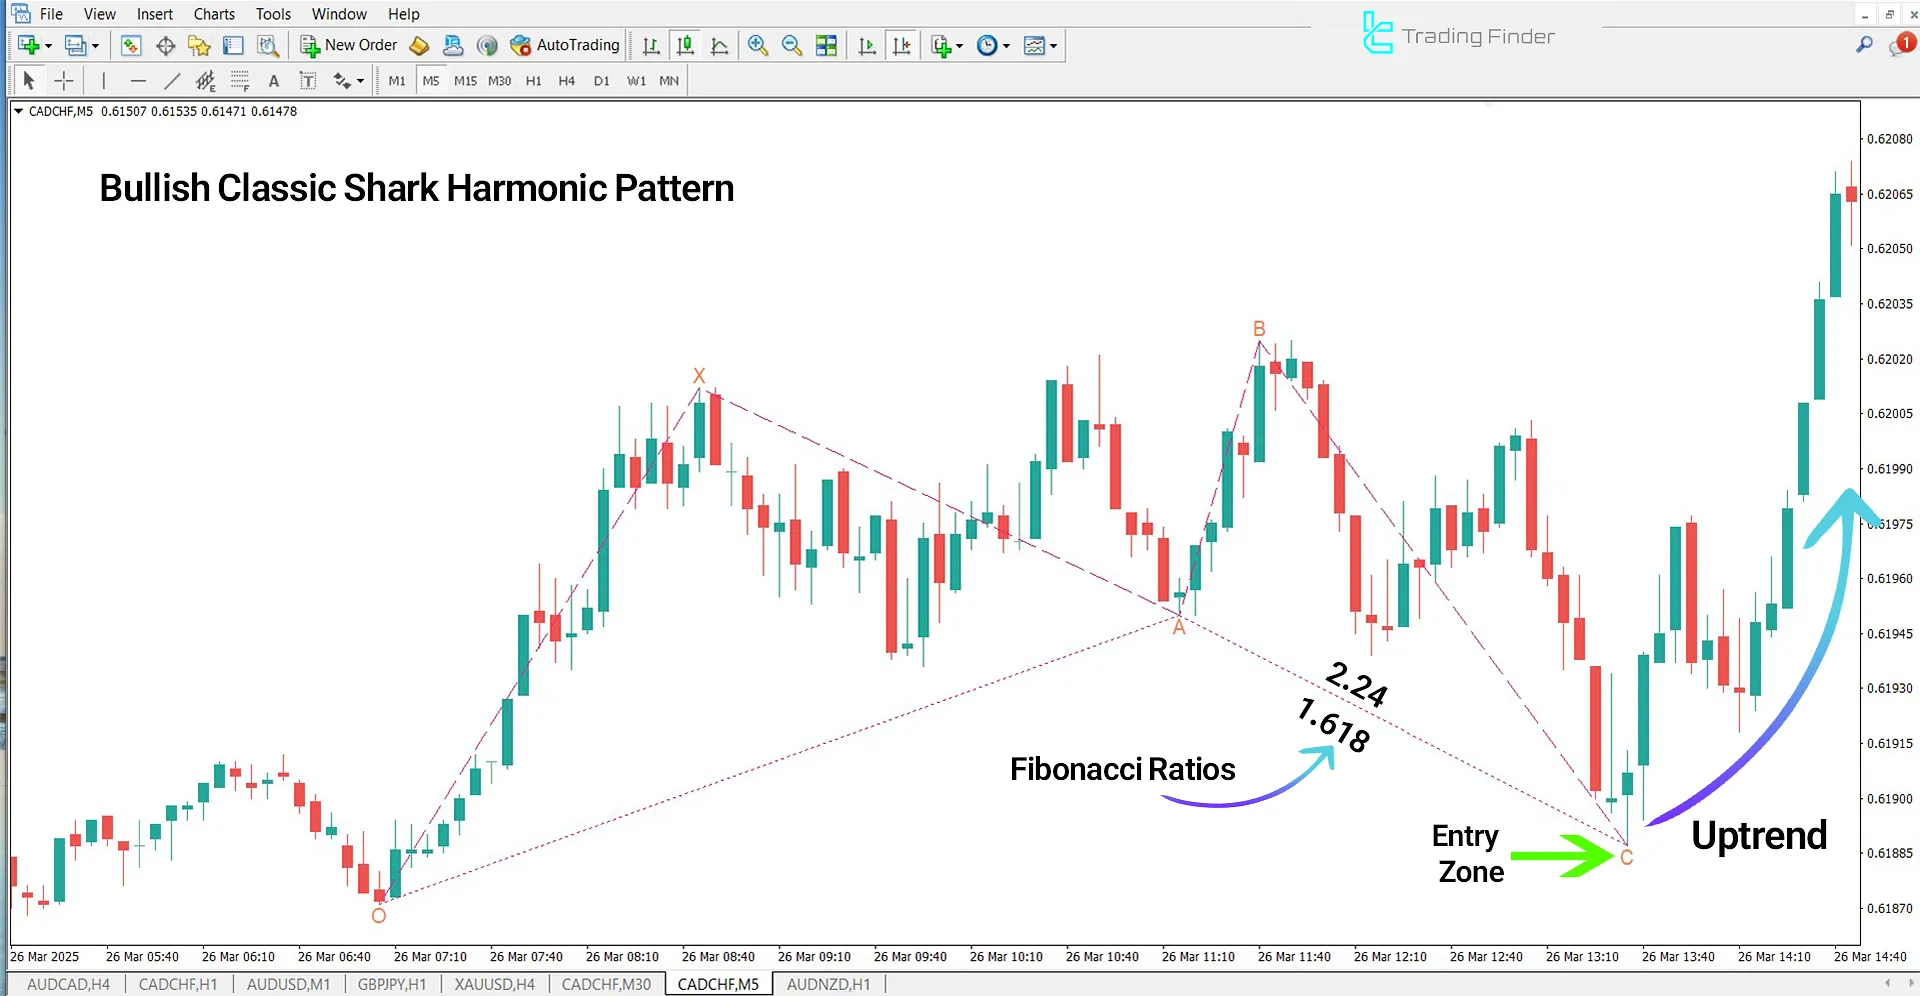
Indicator in an Uptrend
In the bullish Shark pattern, the market initially moves in a downtrend and then progresses toward point C, or the completion zone of the pattern, after the formation of points O, X, A, and B. Point C, or the completion zone of the pattern, lies in the 0.886 to 1.13 Fibonacci range of the OX wave.
If signs such as reversal candlesticks or divergence are observed at point C, the probability of a new uptrend increases.
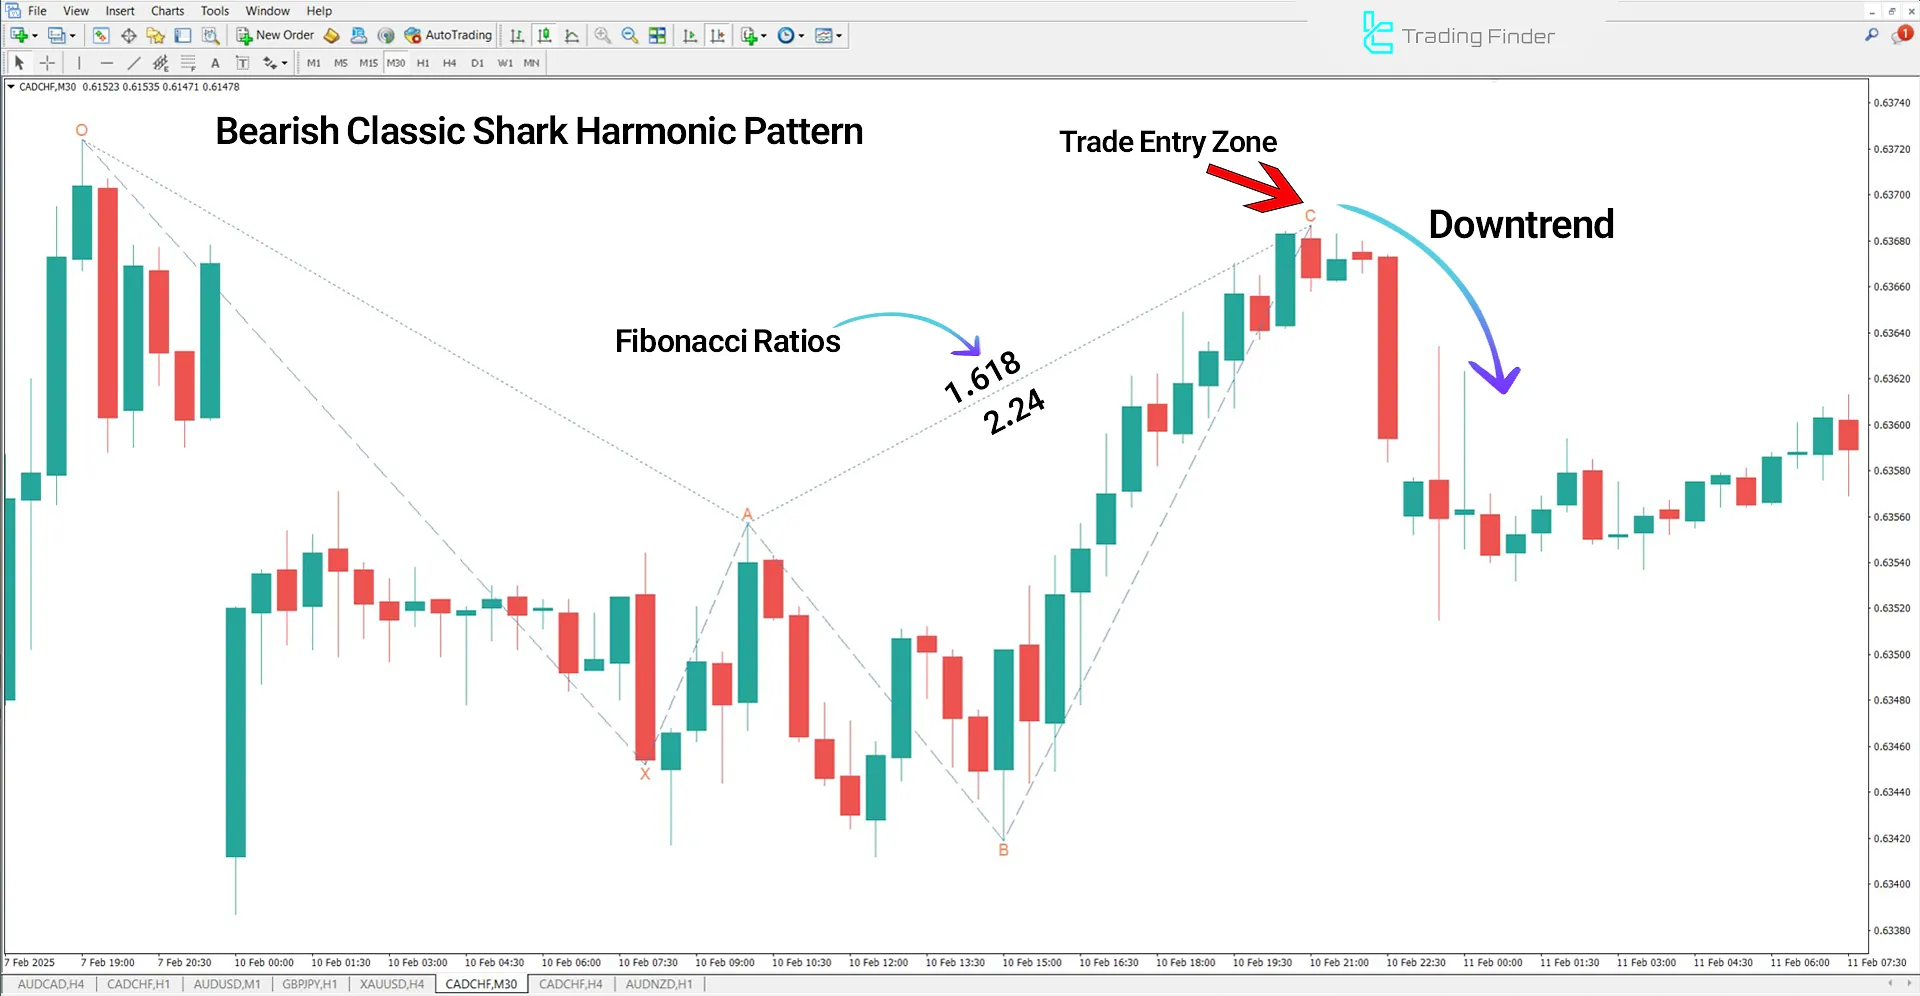
Indicator in a Downtrend
In the bearish Shark pattern, the price initially moves in an uptrend. After the formation of points O, X, A, B, at point C, it reaches a zone where, based on Fibonacci ratios and price behavior, a price reversal can be expected.
Point C in this case is near technical resistance or the overbought zone, and the price could enter a downtrend from here.
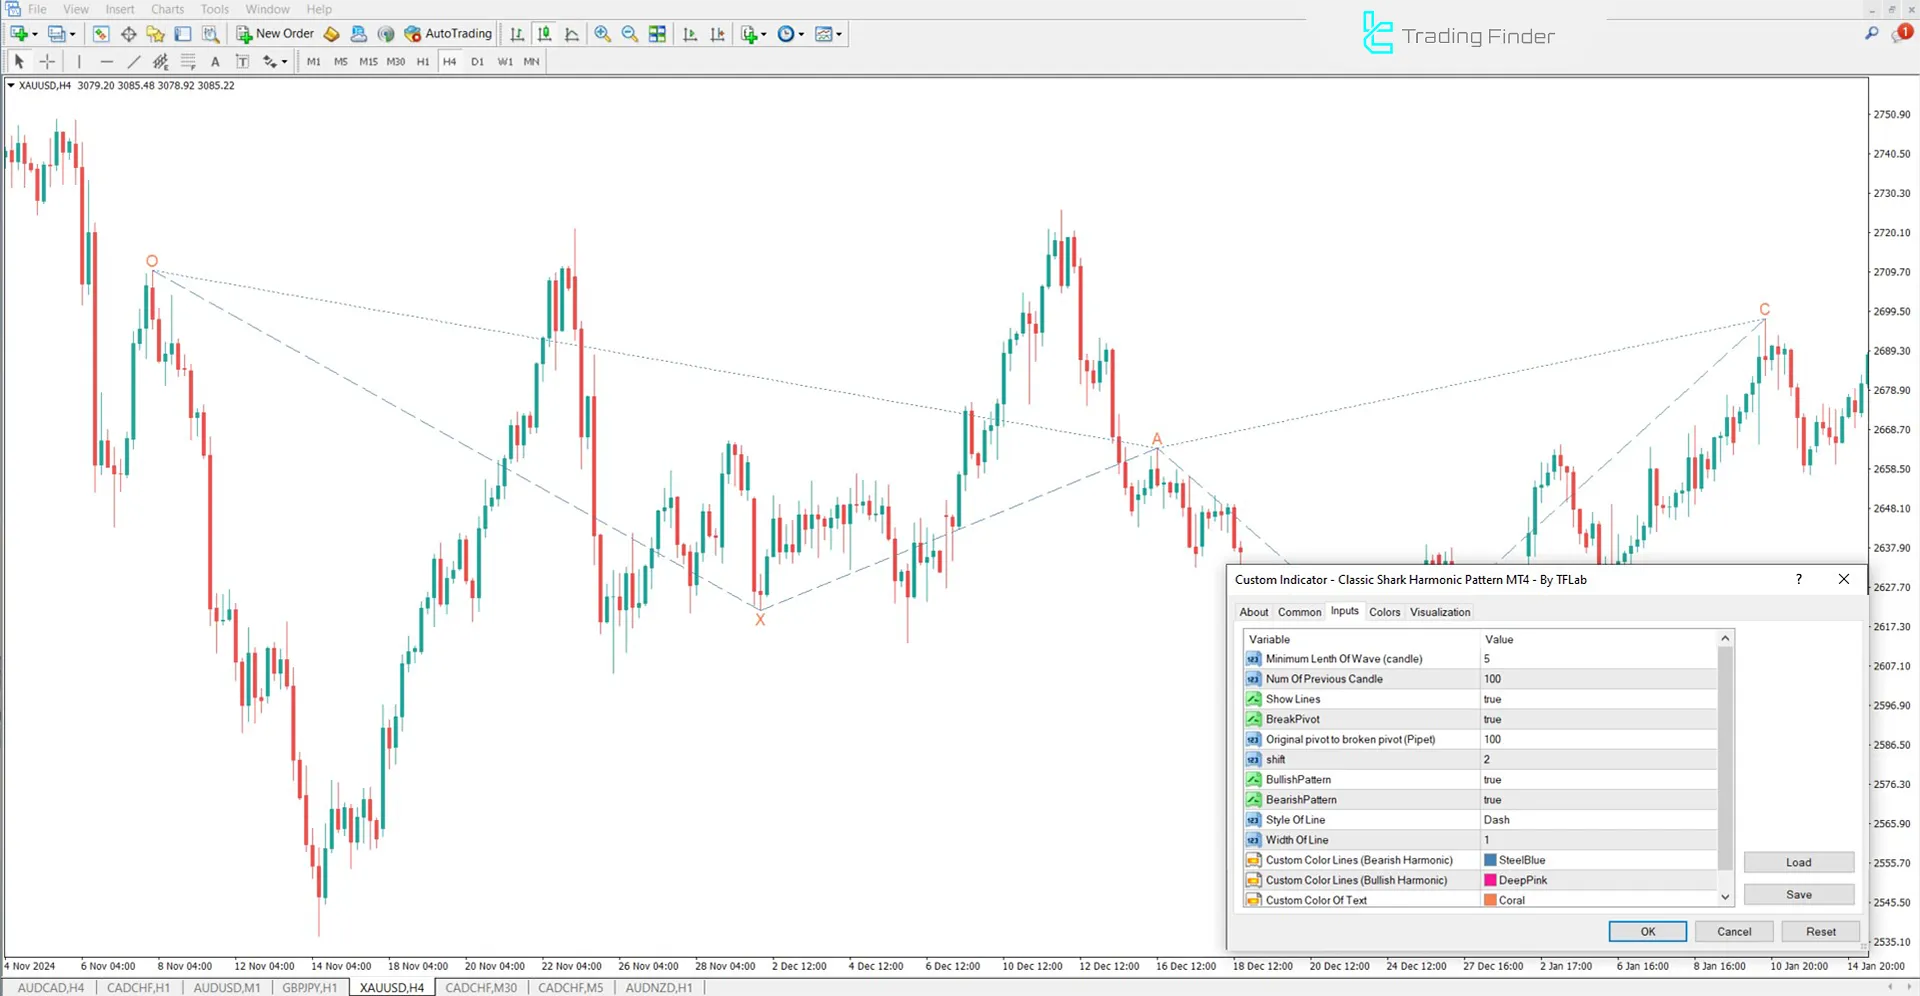
Classic Shark Harmonic Pattern Indicator Settings
The settings section of the Classic Shark Harmonic Pattern Indicator is shown below:

- Minimum Length of Wave (candle): Minimum wavelength in terms of the number of candles
- Num Of Previous Candle: Number of previous candles for analysis
- Show Lines: Display or hide the pattern lines
- BreakPivot: Check for pivot break
- Original Pivot to Broken Pivot (Pipet): Distance between the original pivot and the broken pivot in pips
- Shift: Amount of data shift on the chart
- BullishPattern: Identifying bullish harmonic patterns
- BearishPattern: Identifying bearish harmonic patterns
- Style Of Line: Set the style of the lines on the chart
- Width Of Line: Set the thickness of the displayed lines
- Custom Color Lines (Bearish Harmonic): Change the color of bearish pattern lines
- Custom Color Lines (Bullish Harmonic): Customize the color of bullish pattern lines
- Custom Color Of Text: Set the color of the displayed text
Conclusion
The Shark Harmonic Pattern Indicator is a practical tool for identifying the Shark Harmonic Pattern in price charts.
This MT4 harmonic pattern indicator, using Fibonacci ratios and analyzing the key points of the pattern, automatically marks price reversal zones on the chart and displays entry signals for trades.
Classic Shark Harmonic Pattern MT4 PDF
Classic Shark Harmonic Pattern MT4 PDF
Click to download Classic Shark Harmonic Pattern MT4 PDFWhat pattern does the Shark Harmonic Pattern Indicator identify?
This indicator identifies the Shark Harmonic Pattern, a reversal pattern that uses precise Fibonacci ratios to determine price reversal zones.
Where is the entry point in the Shark pattern?
Point C is considered the completion zone. When the price reaches this level, entry into the trade occurs upon confirmation from signals like reversal candlesticks or divergence.


