![Color RSI Indicator with Alert (CRA) for MT4 Download – Free – [TFlab]](https://cdn.tradingfinder.com/image/265788/11-22-en-color-rsi-with-alert-mt4-01.webp)
![Color RSI Indicator with Alert (CRA) for MT4 Download – Free – [TFlab] 0](https://cdn.tradingfinder.com/image/265788/11-22-en-color-rsi-with-alert-mt4-01.webp)
![Color RSI Indicator with Alert (CRA) for MT4 Download – Free – [TFlab] 1](https://cdn.tradingfinder.com/image/265786/11-22-en-color-rsi-with-alert-mt4-02.webp)
![Color RSI Indicator with Alert (CRA) for MT4 Download – Free – [TFlab] 2](https://cdn.tradingfinder.com/image/265785/11-22-en-color-rsi-with-alert-mt4-03.webp)
![Color RSI Indicator with Alert (CRA) for MT4 Download – Free – [TFlab] 3](https://cdn.tradingfinder.com/image/265787/11-22-en-color-rsi-with-alert-mt4-04.webp)
The Color RSI With Alert indicator is one of the MetaTrader 4 indicators based on the RSI (Relative Strength Index).
This tool functions like the regular RSI indicators but with an important difference: when the price reaches the overbought (70) and oversold (30) levels, the Color RSI With Alert indicator changes color to red and green, respectively, and sends an alert to notify traders of the market conditions.
Indicator Table (CRA)
The specifications of the indicator are provided in the table below.
Indicator Categories: | Oscillators MT4 Indicators Signal & Forecast MT4 Indicators Trading Assist MT4 Indicators RSI Indicators for MetaTrader 4 |
Platforms: | MetaTrader 4 Indicators |
Trading Skills: | Elementary |
Indicator Types: | Leading MT4 Indicators Reversal MT4 Indicators |
Timeframe: | Multi-Timeframe MT4 Indicators |
Trading Style: | Day Trading MT4 Indicators Intraday MT4 Indicators Scalper MT4 Indicators |
Trading Instruments: | Indices Market MT4 Indicators Commodity Market MT4 Indicators Stock Market MT4 Indicators Forex MT4 Indicators |
Indicator at a Glance
The Color RSI With Alert indicator is a useful tool for traders looking to identify overbought and oversold regions on the price chart. By providing an alert when the RSI reaches overbought or oversold levels, this indicator helps traders improve their analysis and make better decisions.
Overbought Zone
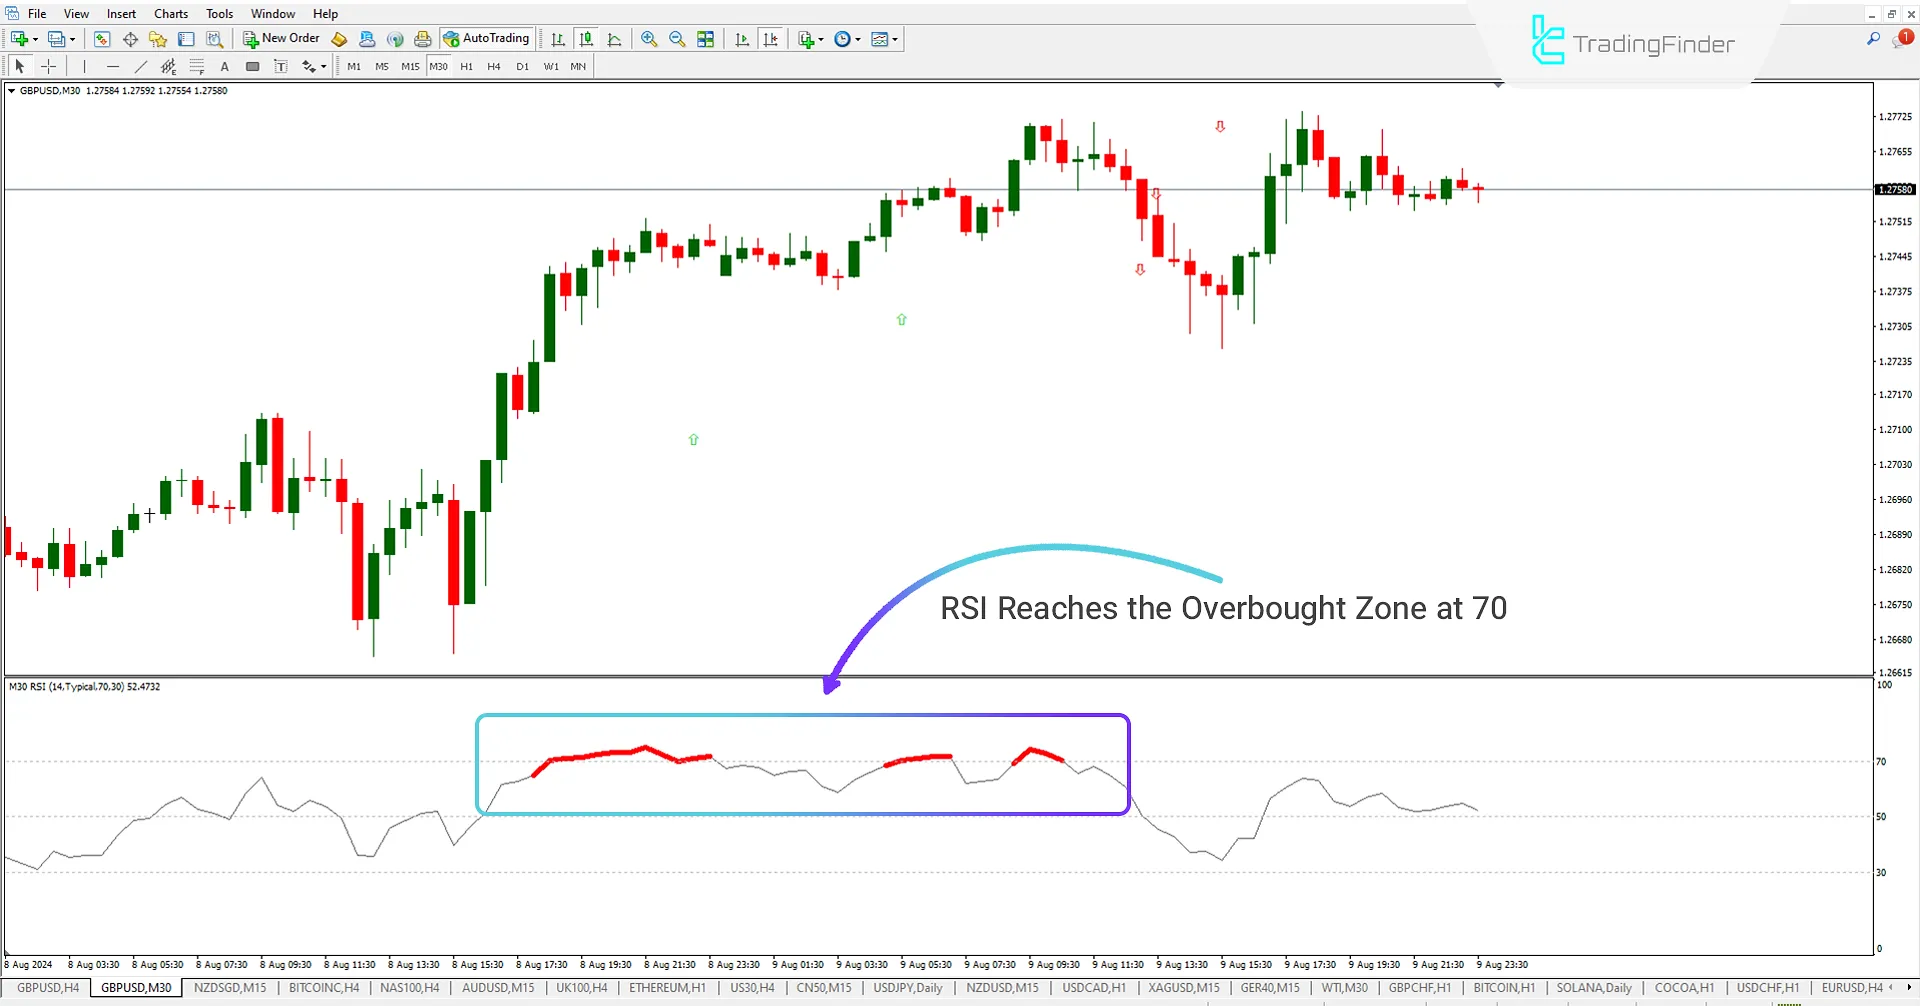
In the 30-minute (GBP/USD) chart, the Color RSI Indicator with Alert turns red upon reaching the 70 level and sends a sell signal, informing the trader that the price has entered the overbought zone.

Oversold Zone
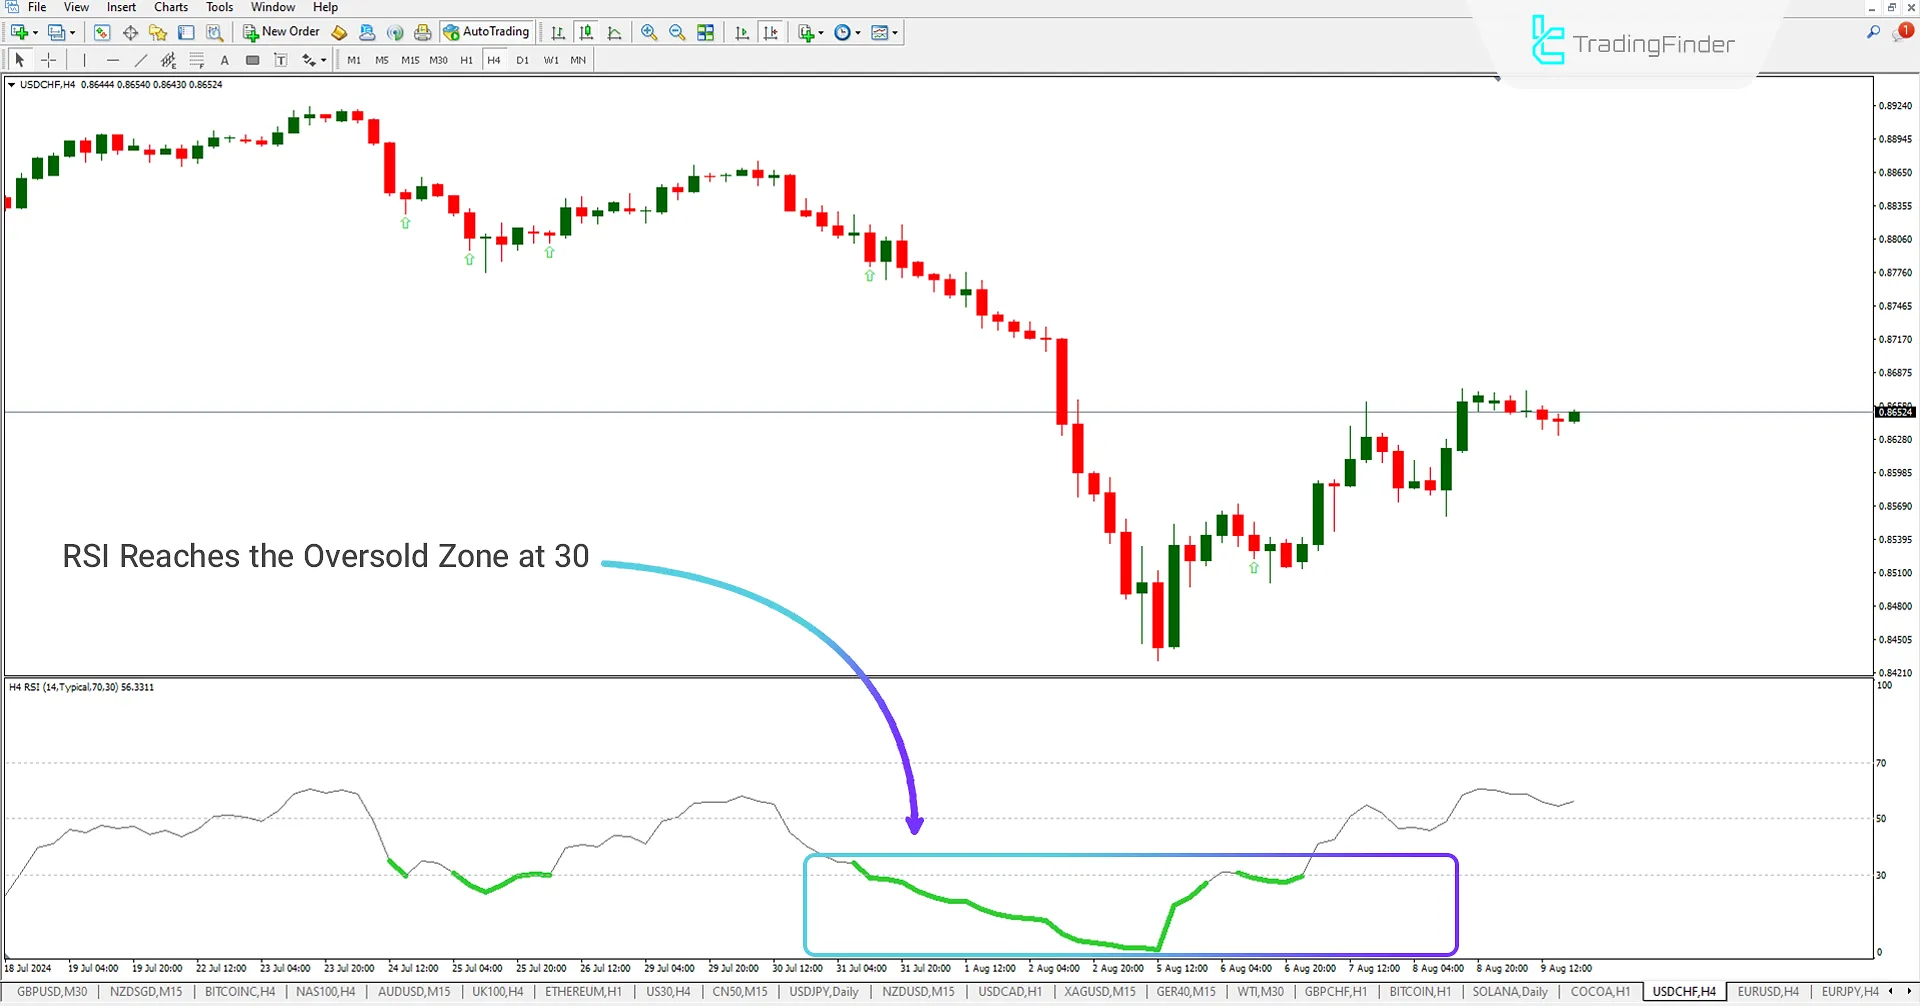
In the 4-hour (USD/CHF) chart, the Color RSI Indicator with Alert turns green upon reaching the 30 level and sends a buy signal, informing the trader that the price has entered the oversold zone.

Indicator Settings
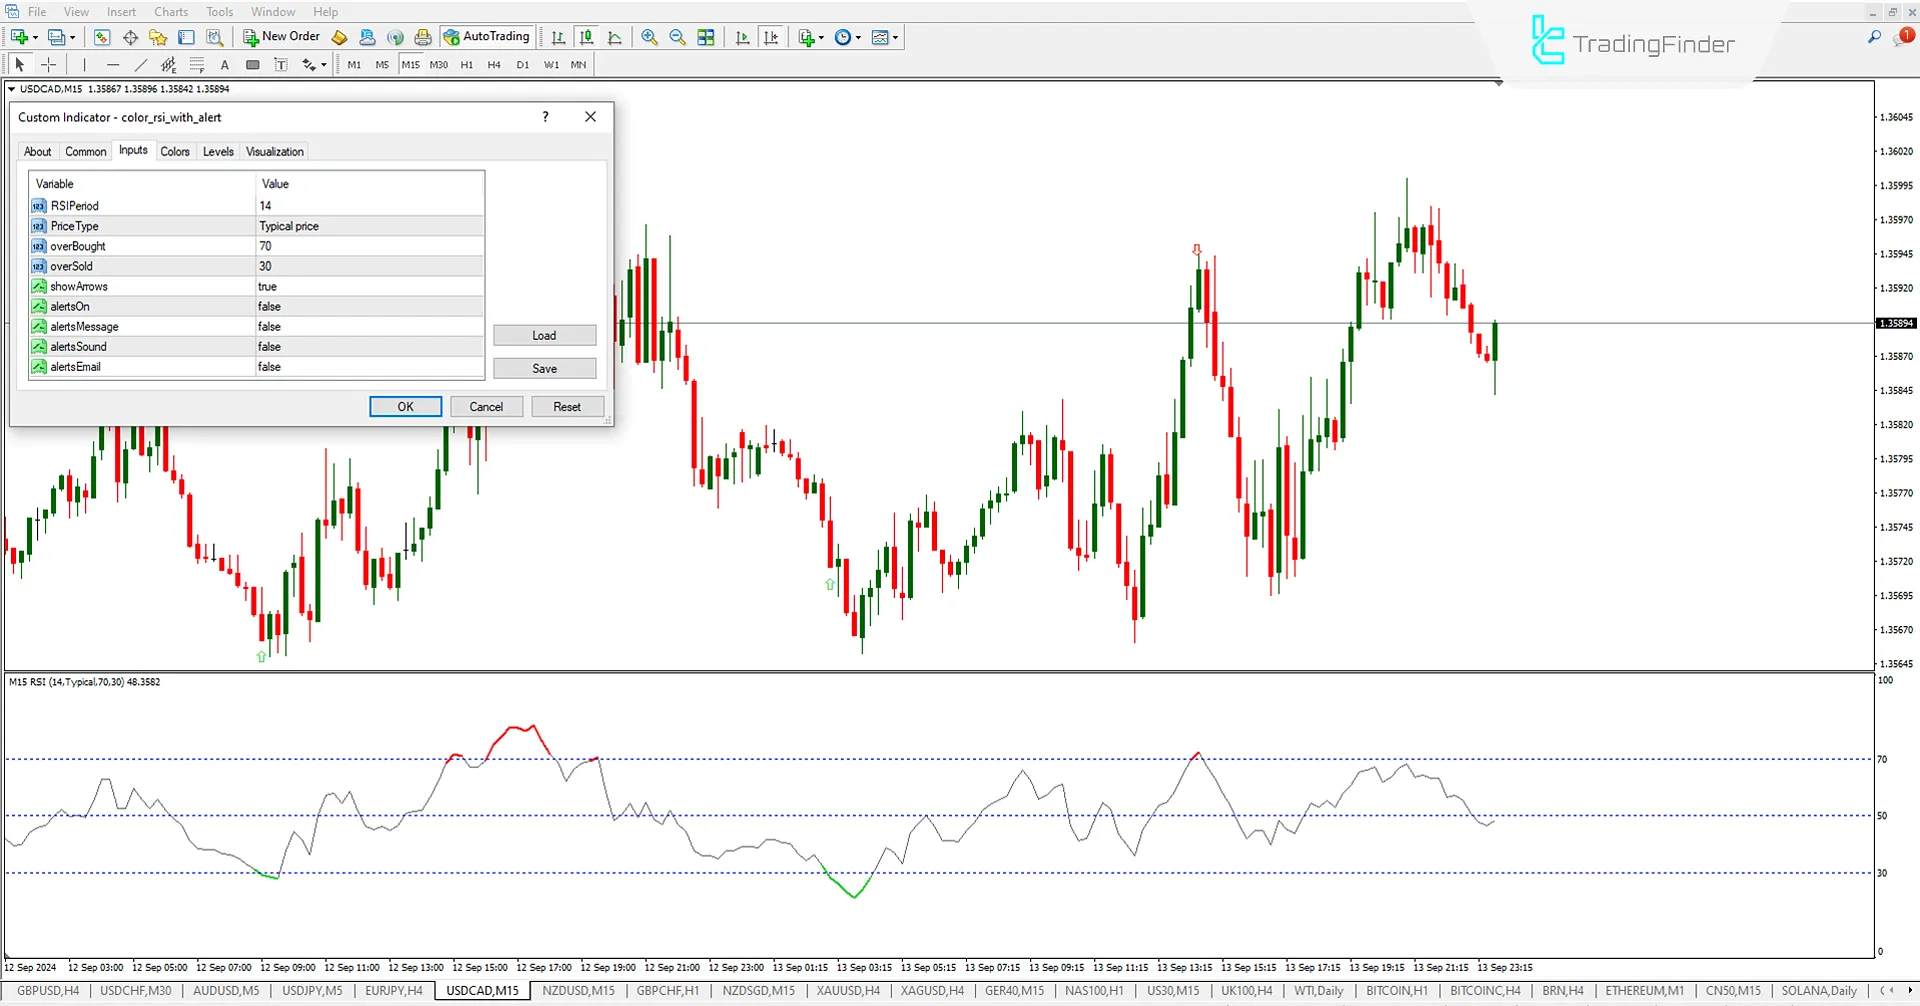
The settings for the Colored RSI Indicator with alerts are provided below;

- RSIPeriod: RSI Period
- Price Type: Type of Price
- overbought: Overbought Zone
- oversold: Oversold Zone
- show Arrows: Show Arrows
- alertsOn: Enable Alerts
- alerts Message: Alert Messages
- alerts Sound: Alert Sound
- alerts Email: Email Alerts
Conclusion
The Color RSI with Alert indicator is an advanced version of the RSI that allows traders to identify overbought and oversold areas.
This oscillator in MetaTrader 4 changes color and sends alerts to notify traders when the price enters these regions, helping them make more precise decisions.
Color RSI MT4 PDF
Color RSI MT4 PDF
Click to download Color RSI MT4 PDFWhat is the Color RSI With Alert indicator?
Color RSI With Alert is an indicator for trading platforms that works with the Relative Strength Index (RSI). It helps traders identify potential entry and exit points. Additionally, it makes analysis and decision-making easier by changing the color of the RSI and generating alerts.
What features does the Color RSI With Alert indicator have?
- Color Change for RSI: Changes RSI color for easier identification of overbought and oversold conditions.
- Alert System: Generates audio alerts or notifications when RSI reaches specific levels.
Hi, there can you add parabolic SAR to this indicator
maybe. i will check it


