![Classic Crab Harmonic Pattern Indicator for MetaTrader 4 Download – Free – [TFlab]](https://cdn.tradingfinder.com/image/325517/4-77-en-classic-crab-harmonic-pattern-mt4-1.webp)
![Classic Crab Harmonic Pattern Indicator for MetaTrader 4 Download – Free – [TFlab] 0](https://cdn.tradingfinder.com/image/325517/4-77-en-classic-crab-harmonic-pattern-mt4-1.webp)
![Classic Crab Harmonic Pattern Indicator for MetaTrader 4 Download – Free – [TFlab] 1](https://cdn.tradingfinder.com/image/325519/4-77-en-classic-crab-harmonic-pattern-mt4-2.webp)
![Classic Crab Harmonic Pattern Indicator for MetaTrader 4 Download – Free – [TFlab] 2](https://cdn.tradingfinder.com/image/325518/4-77-en-classic-crab-harmonic-pattern-mt4-3.webp)
![Classic Crab Harmonic Pattern Indicator for MetaTrader 4 Download – Free – [TFlab] 3](https://cdn.tradingfinder.com/image/325520/4-77-en-classic-crab-harmonic-pattern-mt4-4.webp)
On July 1, 2025, in version 2, alert/notification and signal functionality was added to this indicator
The Classic Crab Harmonic Pattern Indicator is designed for the MetaTrader 4 trading platform and is used to identify the Classic Crab Harmonic patterns in price charts.
The Crab Harmonic Pattern is one of the most widely used patterns in technical analysis, introduced by Scott Carney in the year 2000.
The structure of this pattern is based on five key points: X, A, B, C, and D. In this MetaTrader 4 Harmonic Pattern Indicator, bullish patterns are displayed in pink and bearish patterns in blue.
Classic Crab Harmonic Pattern Indicator Table
The features of the Classic Crab Harmonic Pattern Indicator are summarized in the table below:
Indicator Categories: | Support & Resistance MT4 Indicators Chart & Classic MT4 Indicators Harmonic MT4 Indicators |
Platforms: | MetaTrader 4 Indicators |
Trading Skills: | Intermediate |
Indicator Types: | Reversal MT4 Indicators |
Timeframe: | Multi-Timeframe MT4 Indicators |
Trading Style: | Day Trading MT4 Indicators |
Trading Instruments: | Share Stocks MT4 Indicators Forward Market MT4 Indicators Indices Market MT4 Indicators Stock Market MT4 Indicators Cryptocurrency MT4 Indicators Forex MT4 Indicators |
Indicator at a Glance
In the Crab Pattern, Fibonacci ratios determine the price reversal points. The AB wave is retraced between 38.2% and 61.8% of XA, and the BC wave is located at one of the levels 38.2% or 88.6% of AB.
Next, the CD wave extends depending on the correction of BC, up to 224% or 361.8% of it. Finally, the CD wave relative to XA should be 161.8%, which is considered the price reversal zone (PRZ).
Indicator in an Uptrend
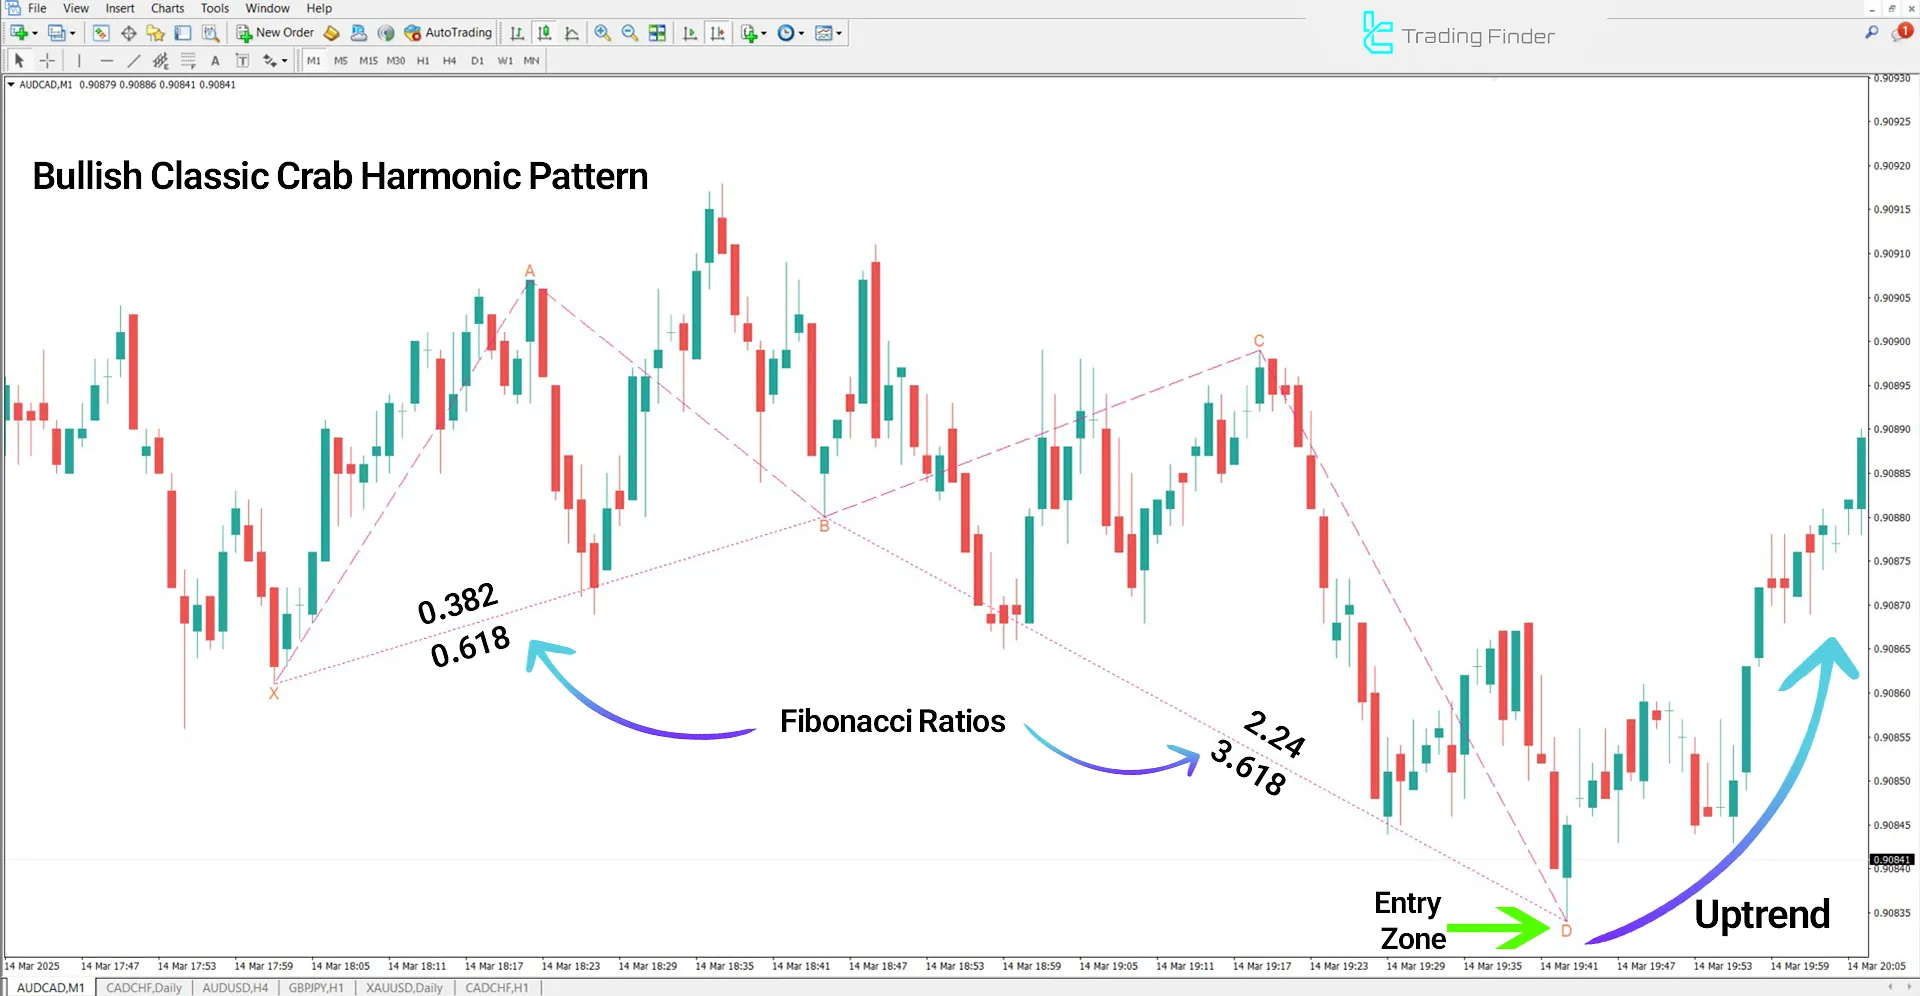
The chart below shows the AUD/CAD pair on the 1-minute timeframe. The indicator automatically identifies a bullish Crab pattern and marks the key points X, A, B, C, and D on the chart.
Point D is considered the Price Reversal Zone (PRZ), and traders can enter a buy position after confirming the necessary signals.

Indicator in a Downtrend
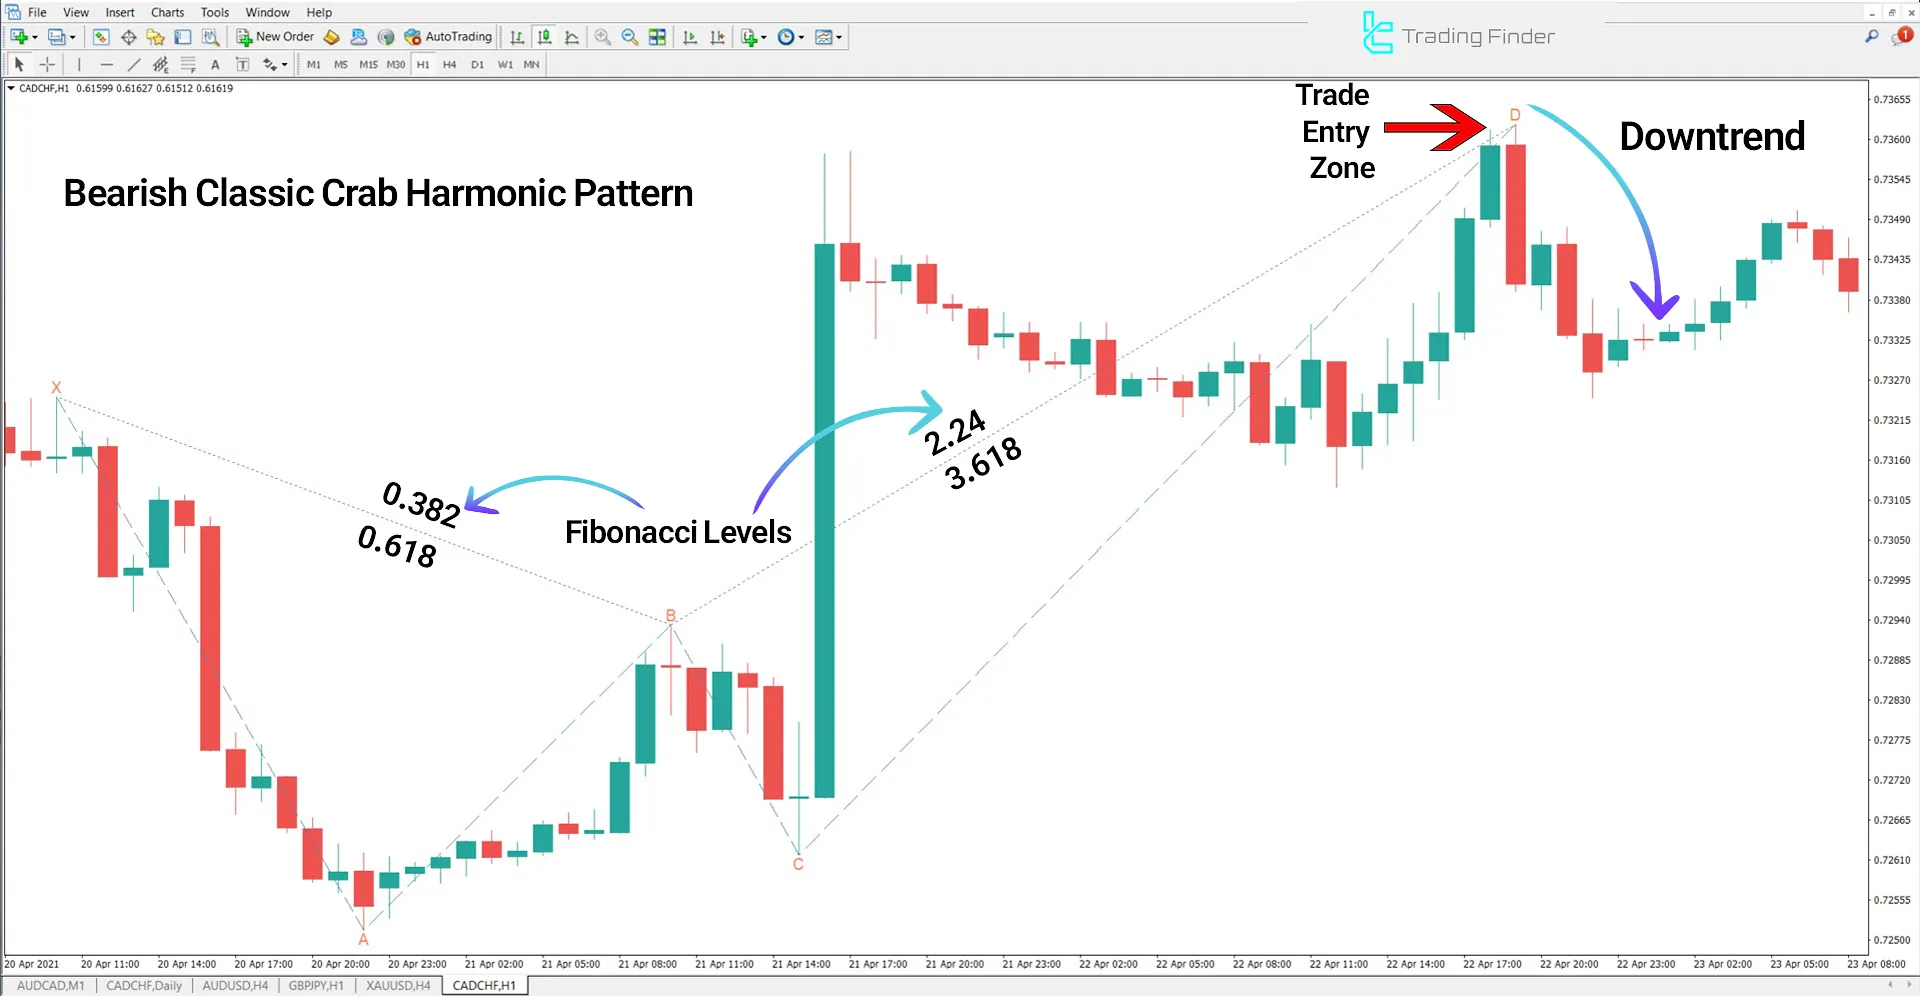
In the CAD/CHF pair chart, the indicator automatically identifies a bearish Crab pattern and displays it in blue.
Point D is designated as the reversal zone, and after confirming reversal signs, a sell trade can be initiated.

Classic Crab Harmonic Pattern Indicator Settings
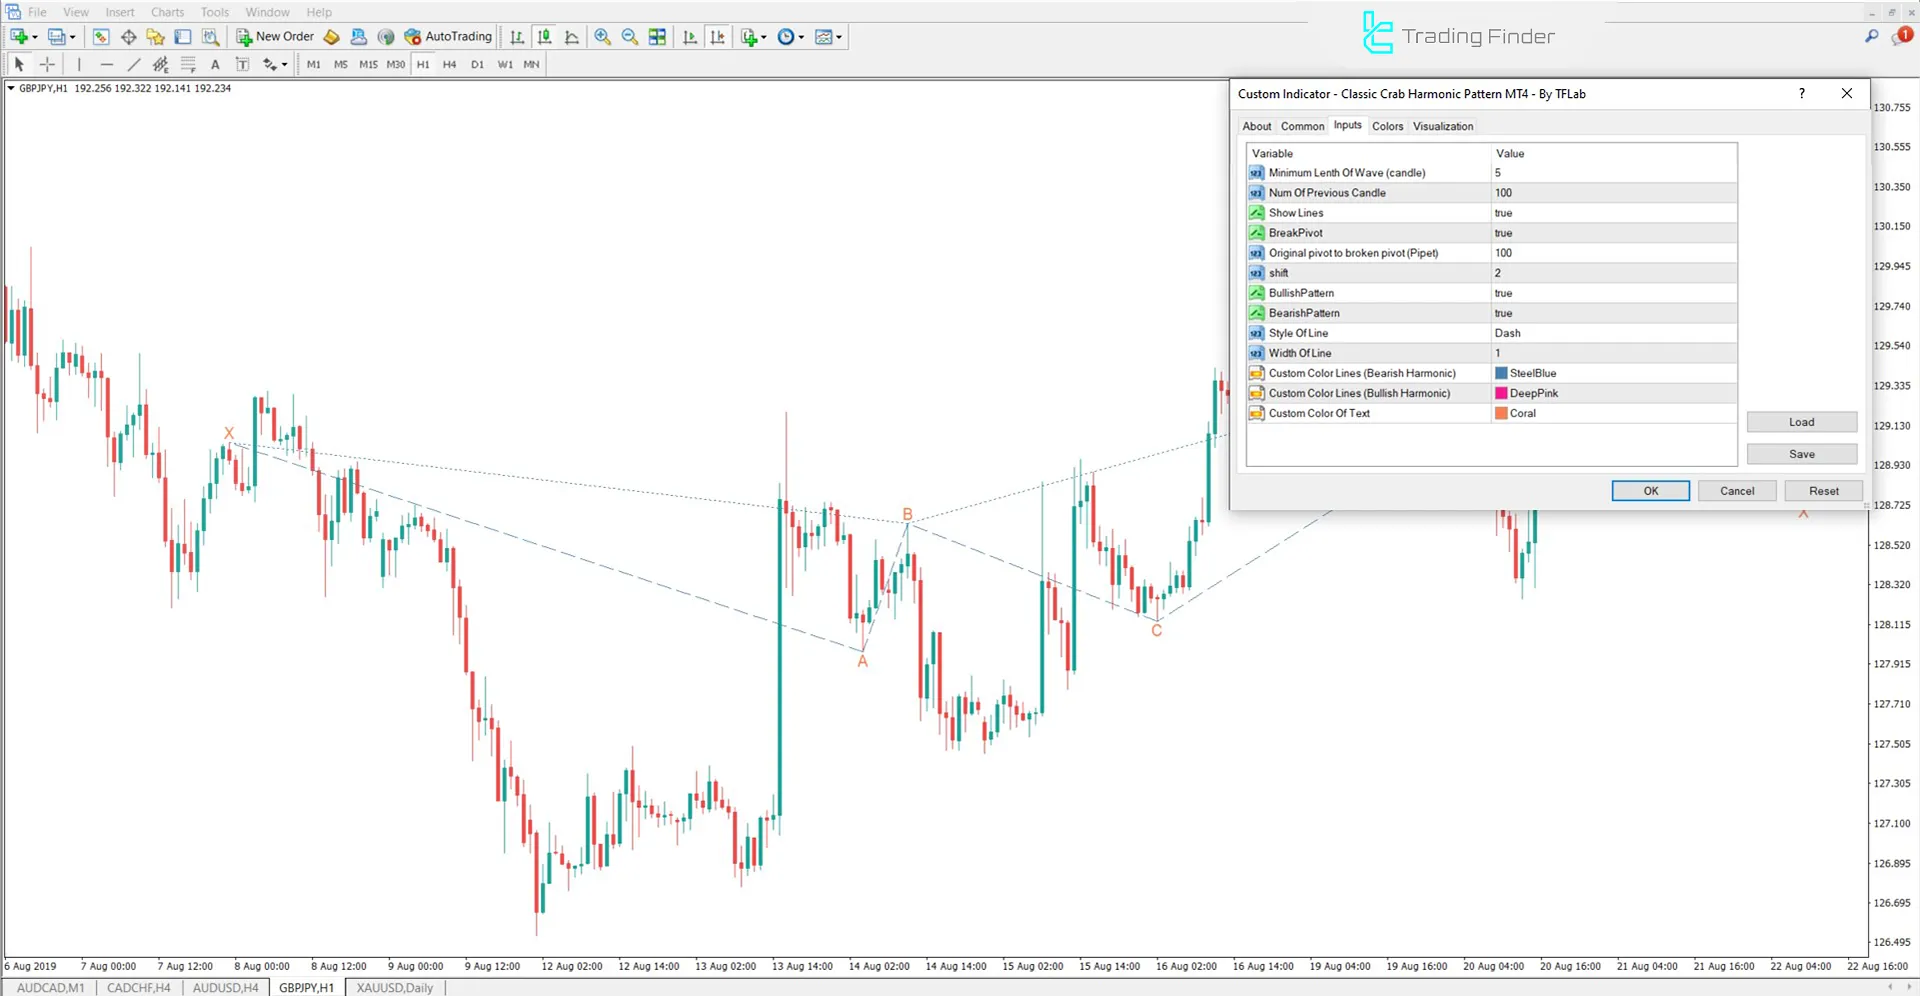
The settings section of the Classic Crab Harmonic Pattern Indicator is shown in the image below:

- Minimum Length of Wave (candle): Minimum wave length in terms of the number of candles
- Num Of Previous Candle: Number of previous candles for analysis
- Show Lines: Show or hide pattern lines
- BreakPivot: Check for pivot break
- Original Pivot to Broken Pivot (Pipet): Distance between the original pivot and the broken pivot in pips
- Shift: Amount of data shift on the chart
- BullishPattern: Identifying bullish harmonic patterns
- BearishPattern: Identifying bearish harmonic patterns
- Style Of Line: Set the style of the lines on the chart
- Width Of Line: Set the thickness of the displayed lines
- Custom Color Lines (Bearish Harmonic): Change the color of the bearish pattern lines
- Custom Color Lines (Bullish Harmonic): Customize the color of the bullish pattern lines
- Custom Color Of Text: Set the color of the displayed text
Conclusion
The Classic Crab Harmonic Pattern Indicator is designed to automatically detect the Crab Harmonic pattern in price charts.
Identifying bullish and bearish patterns, drawing the pattern lines with styles, and marking the entry zones at point D are its key features.
This classic chart pattern indicator for MetaTrader 4 is used for more precise analysis of harmonic patterns and identifying potential price reversal zones in financial markets such as Forex.
Classic Crab Harmonic Pattern MT4 PDF
Classic Crab Harmonic Pattern MT4 PDF
Click to download Classic Crab Harmonic Pattern MT4 PDFWhat is the Crab Harmonic Pattern Indicator?
This indicator is a technical analysis tool that automatically identifies the Crab Harmonic pattern in price charts and marks the key points X, A, B, C, and D.
In which timeframes can this indicator be used?
This indicator can be used in all timeframes, from 1-minute to higher timeframes such as 4-hour and daily.


