![Cross Indicator for MetaTrader 4 Download - [TradingFinder]](https://cdn.tradingfinder.com/image/430382/2-91-en-cross-indicator-mt4-1.webp)
![Cross Indicator for MetaTrader 4 Download - [TradingFinder] 0](https://cdn.tradingfinder.com/image/430382/2-91-en-cross-indicator-mt4-1.webp)
![Cross Indicator for MetaTrader 4 Download - [TradingFinder] 1](https://cdn.tradingfinder.com/image/430383/2-91-en-cross-indicator-mt4-2.webp)
![Cross Indicator for MetaTrader 4 Download - [TradingFinder] 2](https://cdn.tradingfinder.com/image/430384/2-91-en-cross-indicator-mt4-3.webp)
![Cross Indicator for MetaTrader 4 Download - [TradingFinder] 3](https://cdn.tradingfinder.com/image/430385/2-91-en-cross-indicator-mt4-4.webp)
On July 6, 2025, in version 2, alert/notification and signal functionality was added to this indicator
The Cross Indicator is one of the simplest tools in technical analysis, operating based on the intersection of two Moving Averages.
This MetaTrader 4 indicator identifies the crossover point of the moving averages and provides buy or sell signals using colored dots on the chart without displaying the actual moving average lines.
Cross Indicator Table
The general specifications of the Cross Indicator are presented in the table below:
Indicator Categories: | Price Action MT4 Indicators Signal & Forecast MT4 Indicators Trading Assist MT4 Indicators |
Platforms: | MetaTrader 4 Indicators |
Trading Skills: | Elementary |
Indicator Types: | Reversal MT4 Indicators |
Timeframe: | Multi-Timeframe MT4 Indicators |
Trading Style: | Intraday MT4 Indicators |
Trading Instruments: | Share Stocks MT4 Indicators Indices Market MT4 Indicators Commodity Market MT4 Indicators Stock Market MT4 Indicators Cryptocurrency MT4 Indicators Forex MT4 Indicators |
Overview of the Indicator
The Cross Indicator analyzes price behavior across different timeframes using two short-term and long-term moving averages.
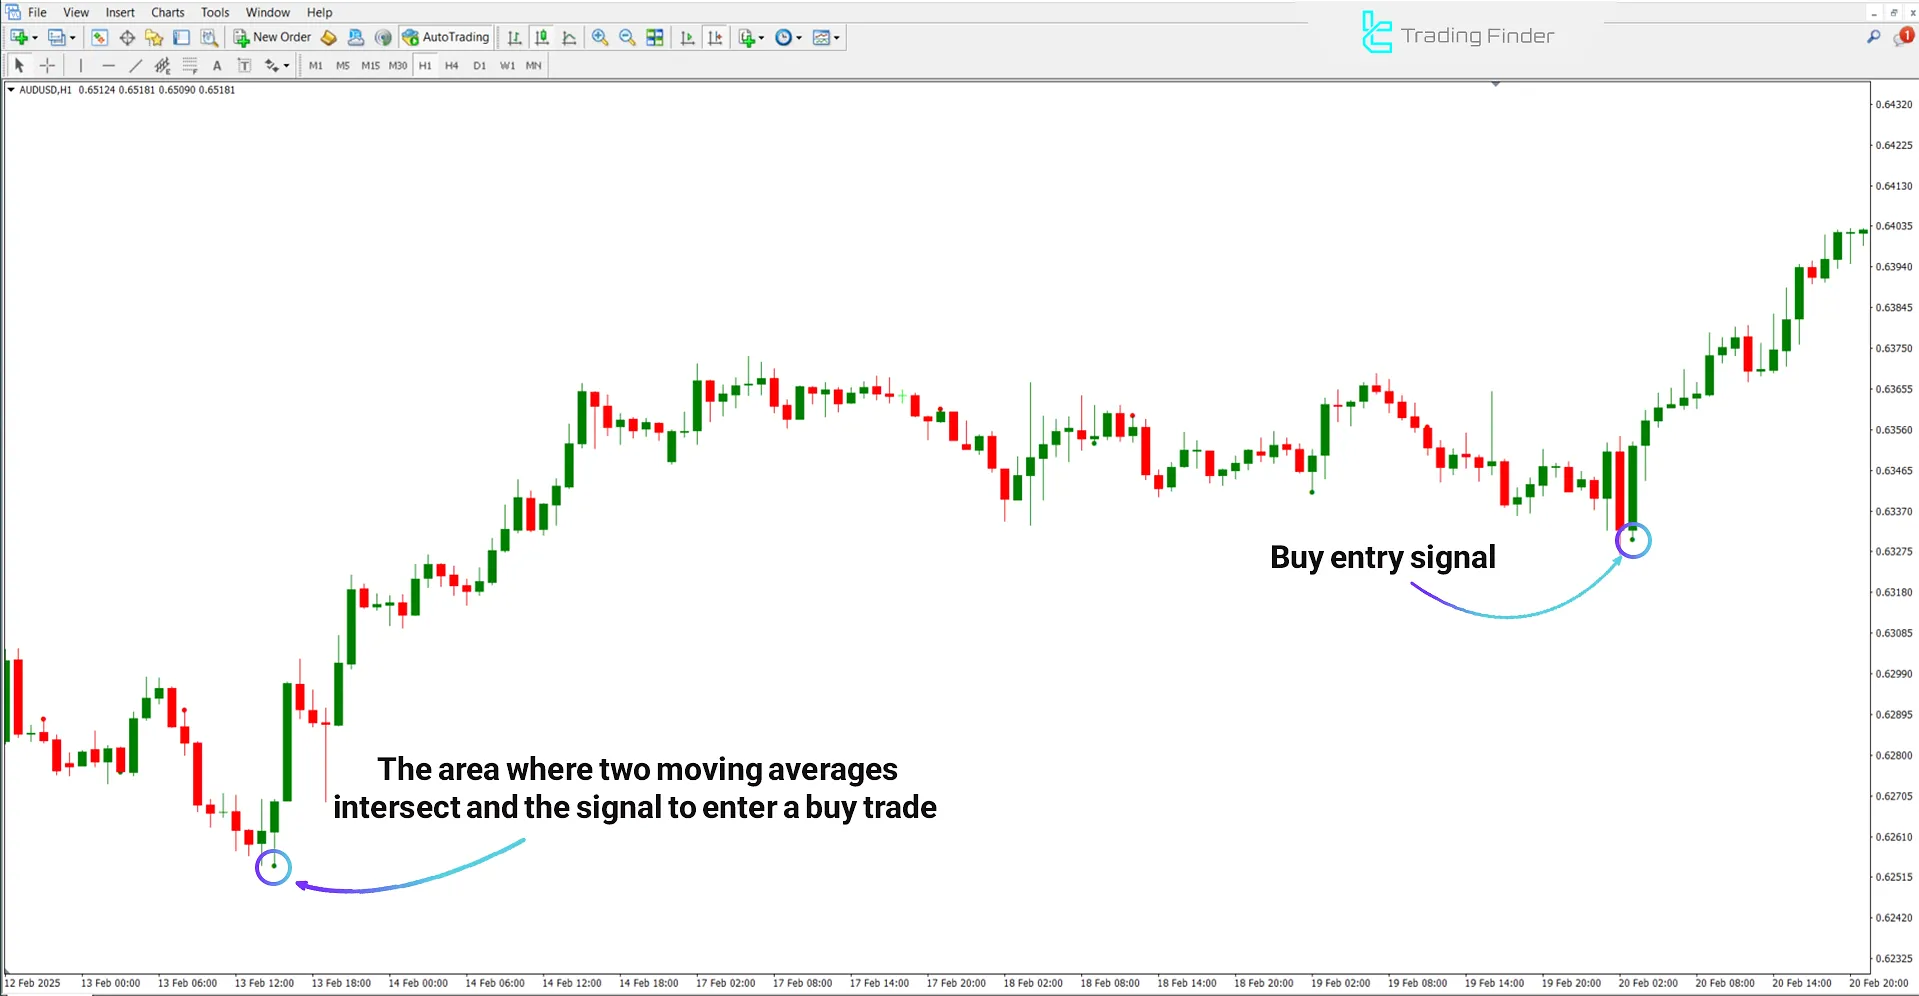
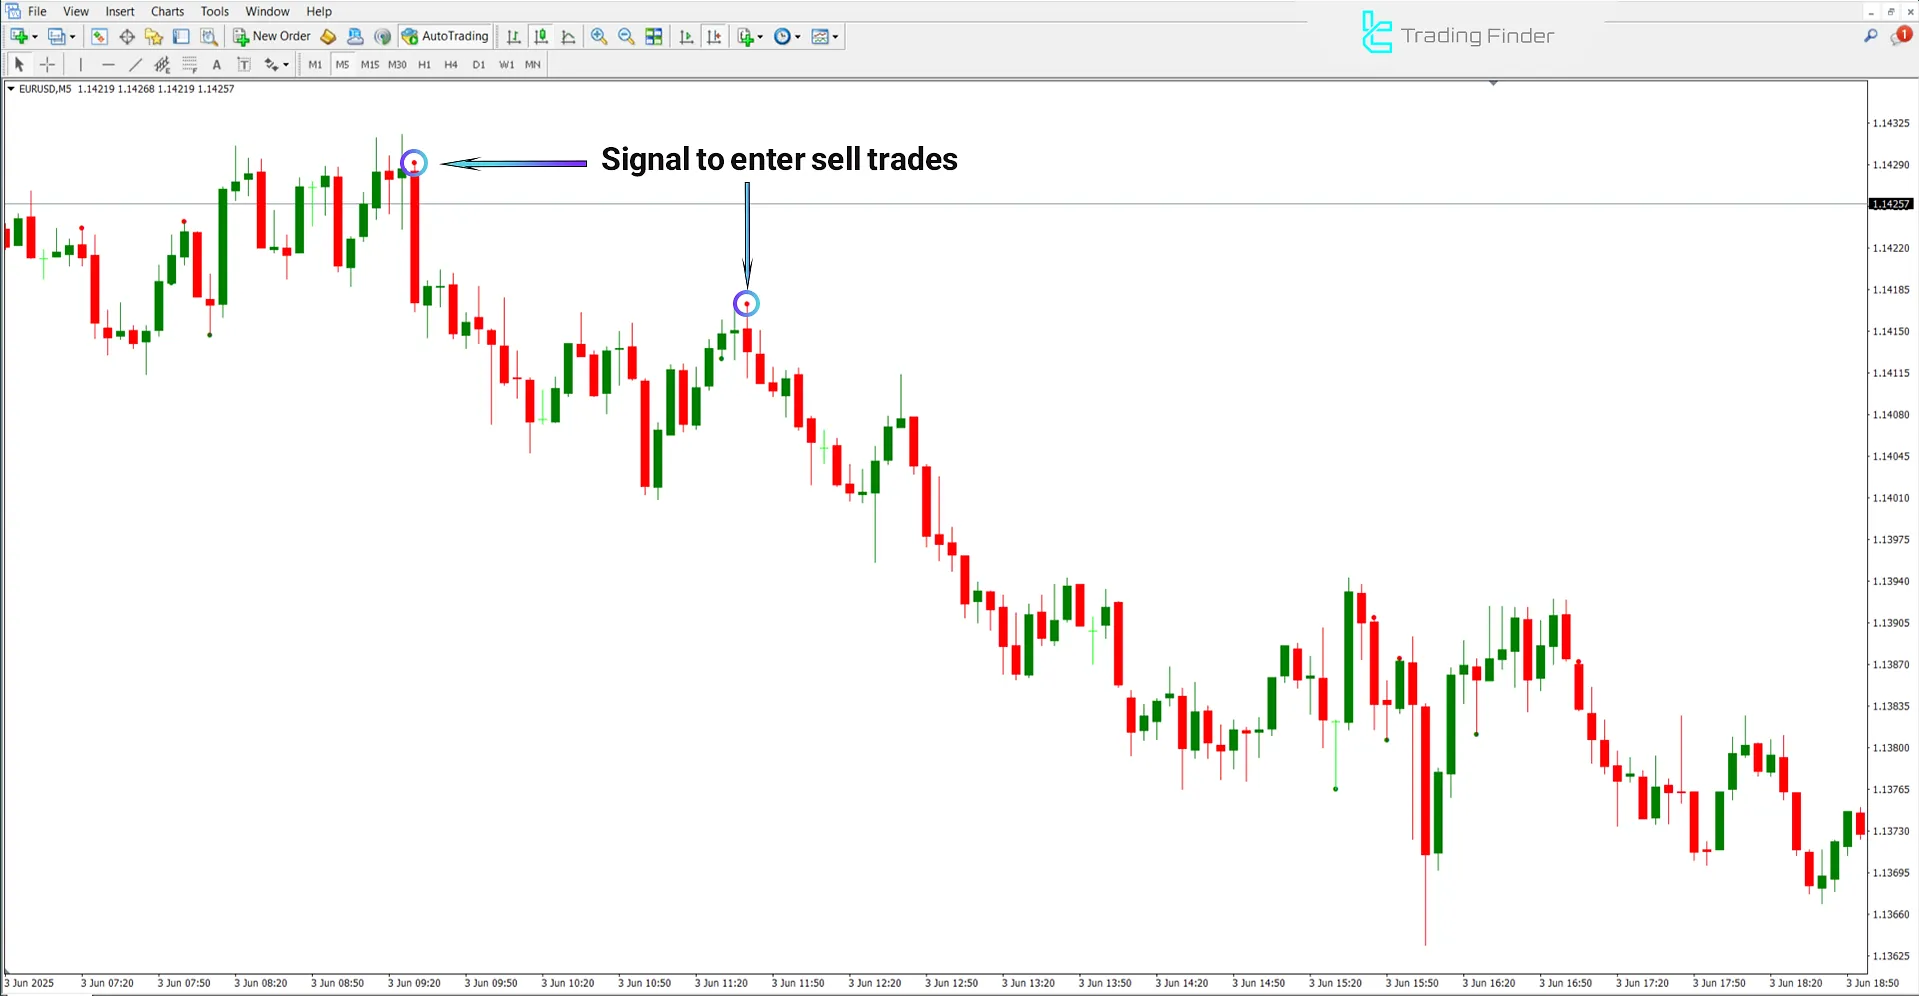
This price action tool highlights a colored dot at the crossover of the moving averages, serving as a trading signal:
- Green Dot: Indicates a bullish cross, signaling a buy entry;
- Red Dot: Indicates a bearish cross, warning of a sell opportunity.
Uptrend Conditions
On the 1-hour chart of the AUD/USD currency pair, when the short-term moving average crosses above the long-term moving average, the indicator displays a green dot on the chart.
This condition indicates buyer strength and an area suitable for buy trades.

Downtrend Conditions
The following 5-minute chart displays the EUR/USD currency pair. In this indicator, when the short-term moving average crosses below the long-term moving average, a red dot is shown on the chart.
This condition indicates seller pressure and a shift from an uptrend to a downtrend.

Cross Indicator Settings
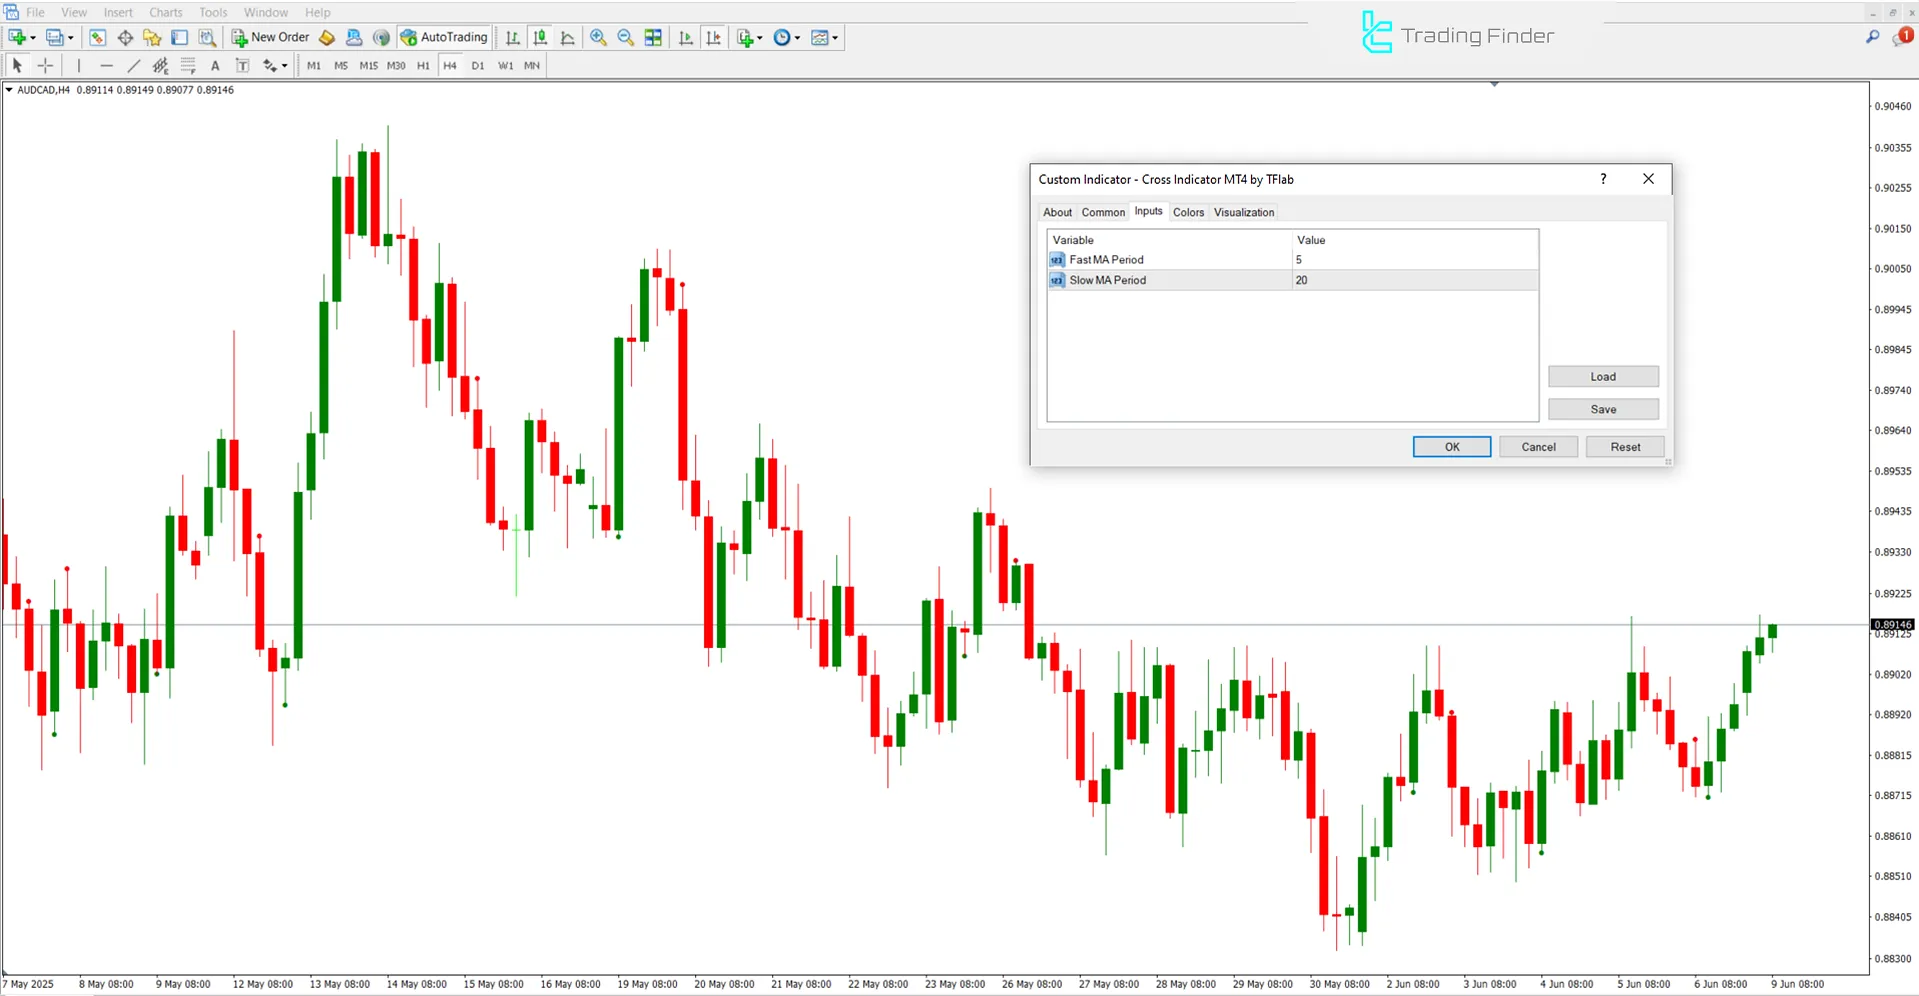
The settings panel of the Cross Indicator is shown in the image below:

- Fast MA Period: Short-term Moving Average Period;
- Slow MA Period: Long-term Moving Average Period.
Conclusion
The Cross Indicator is an effective tool for generating trading signals based on the crossover of two moving averages.
It displays green and red dots below the candles, indicating the moment of crossover and providing clear entry or exit signals.
Cross MT4 PDF
Cross MT4 PDF
Click to download Cross MT4 PDFIn which markets does the Cross Indicator perform best?
The Cross Indicator performs well in trending markets.
Is the Cross Indicator suited for a specific currency pair?
No, this trading tool is not limited to any specific pair and can be used across all trading instruments.


