![Cumulative Delta with Price Indicator for MT4 - Download - [TradingFinder]](https://cdn.tradingfinder.com/image/398659/2-68-en-cumulative-delta-with-price-mt4-1.webp)
![Cumulative Delta with Price Indicator for MT4 - Download - [TradingFinder] 0](https://cdn.tradingfinder.com/image/398659/2-68-en-cumulative-delta-with-price-mt4-1.webp)
![Cumulative Delta with Price Indicator for MT4 - Download - [TradingFinder] 1](https://cdn.tradingfinder.com/image/398657/2-68-en-cumulative-delta-with-price-mt4-2.webp)
![Cumulative Delta with Price Indicator for MT4 - Download - [TradingFinder] 2](https://cdn.tradingfinder.com/image/398656/2-68-en-cumulative-delta-with-price-mt4-3.webp)
![Cumulative Delta with Price Indicator for MT4 - Download - [TradingFinder] 3](https://cdn.tradingfinder.com/image/398658/2-68-en-cumulative-delta-with-price-mt4-4.webp)
The Cumulative Delta with Price Indicator is a technical analysis tool that calculates the cumulative difference between the volume of buy-side (Ask) and sell-side (Bid) transactions and displays it as a delta curve [yellow line].
This MetaTrader 4 oscillator plots the delta curve alongside the volume, allowing the analyst to evaluate price behavior in parallel with volume dynamics and identify divergences or convergences.
Cumulative Delta with Price Specifications Table
The following table presents the features and specifications of the Cumulative Delta with Price Indicator:
Indicator Categories: | Price Action MT4 Indicators Oscillators MT4 Indicators Trading Assist MT4 Indicators |
Platforms: | MetaTrader 4 Indicators |
Trading Skills: | Intermediate |
Indicator Types: | Trend MT4 Indicators Reversal MT4 Indicators |
Timeframe: | Multi-Timeframe MT4 Indicators |
Trading Style: | Intraday MT4 Indicators |
Trading Instruments: | Share Stocks MT4 Indicators Indices Market MT4 Indicators Commodity Market MT4 Indicators Stock Market MT4 Indicators Cryptocurrency MT4 Indicators Forex MT4 Indicators |
Indicator Overview
The Cumulative Delta with Price Indicator analyzes the difference between buy and sell volumes and serves as a powerfultool for detecting the actual flow of orders in the market.
It detects false breakouts and validates price action near support and resistance levels.
Moreover, it can accurately detect trend reversal points by identifying hidden or regular divergences between the delta curve and the price.
Uptrend Conditions
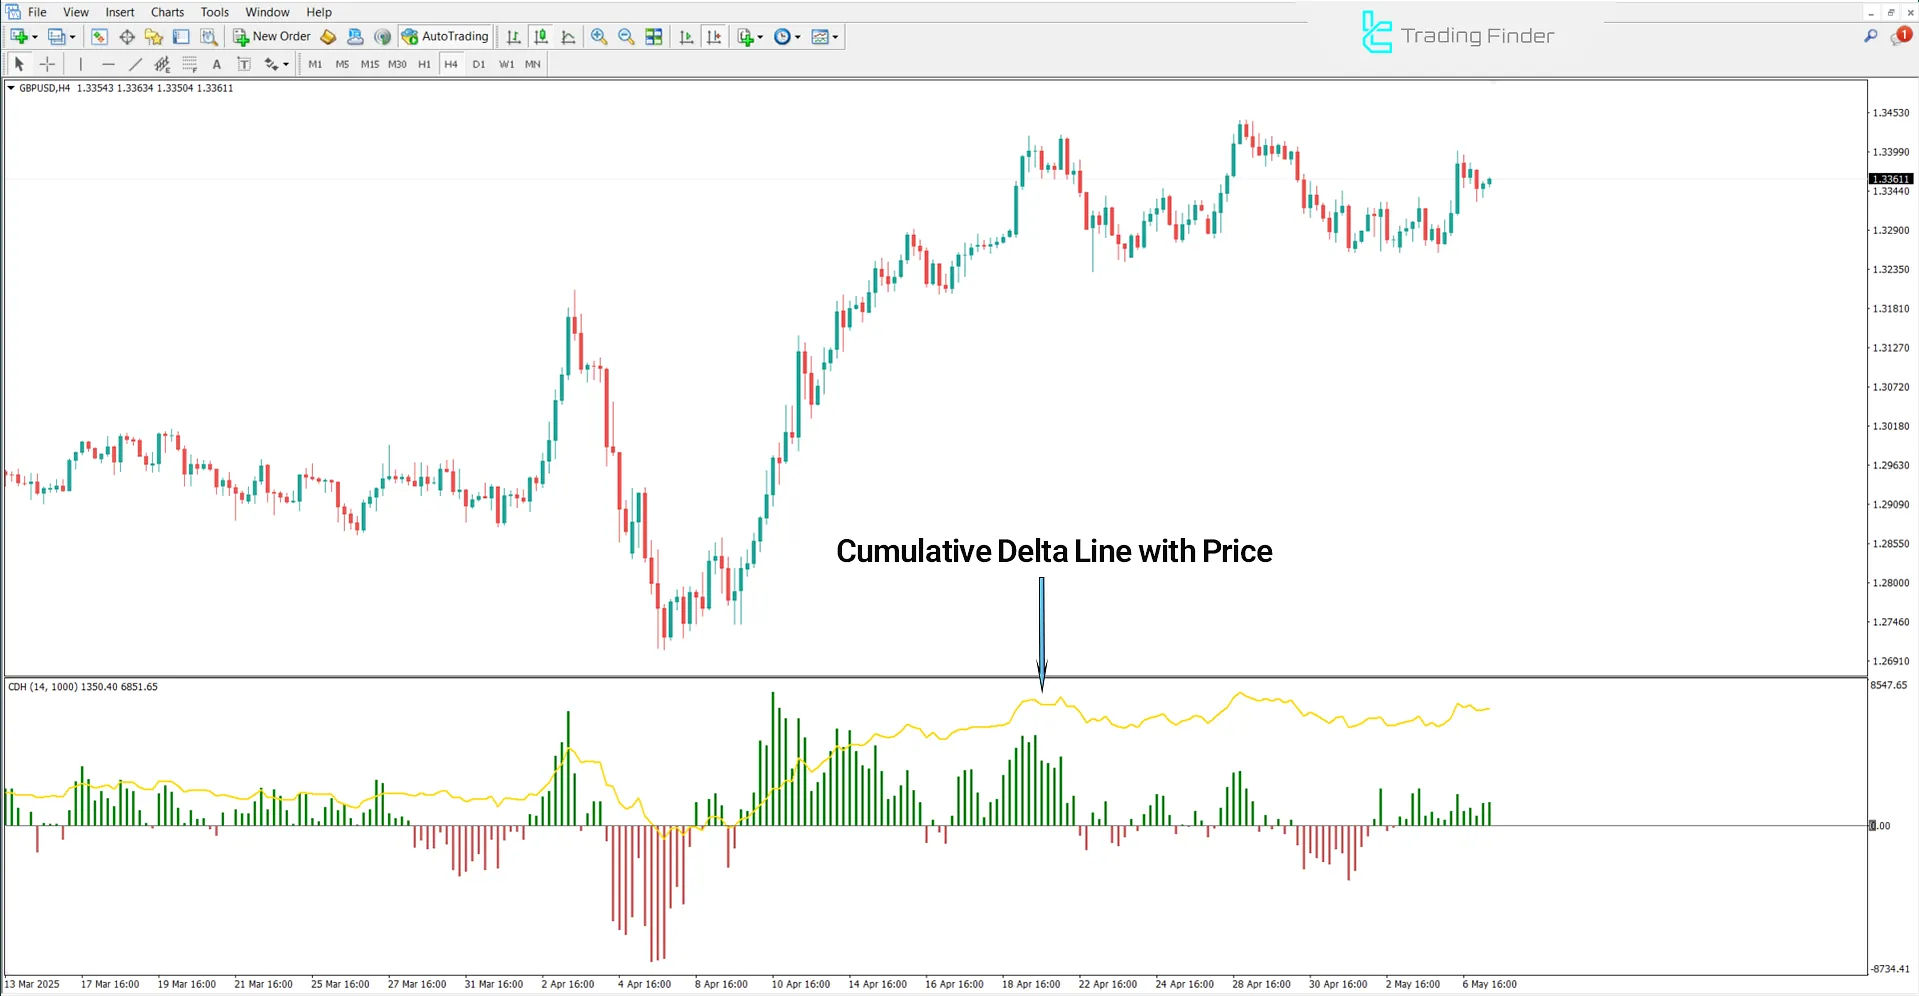
In the 4-hour GBP/USD currency pair chart, the simultaneous upward movement of both the price and the delta curve indicates buyer strength and entry of buy orders.
This positive divergence confirms the validity of the uptrend and demonstrates its strength.

Downtrend Conditions
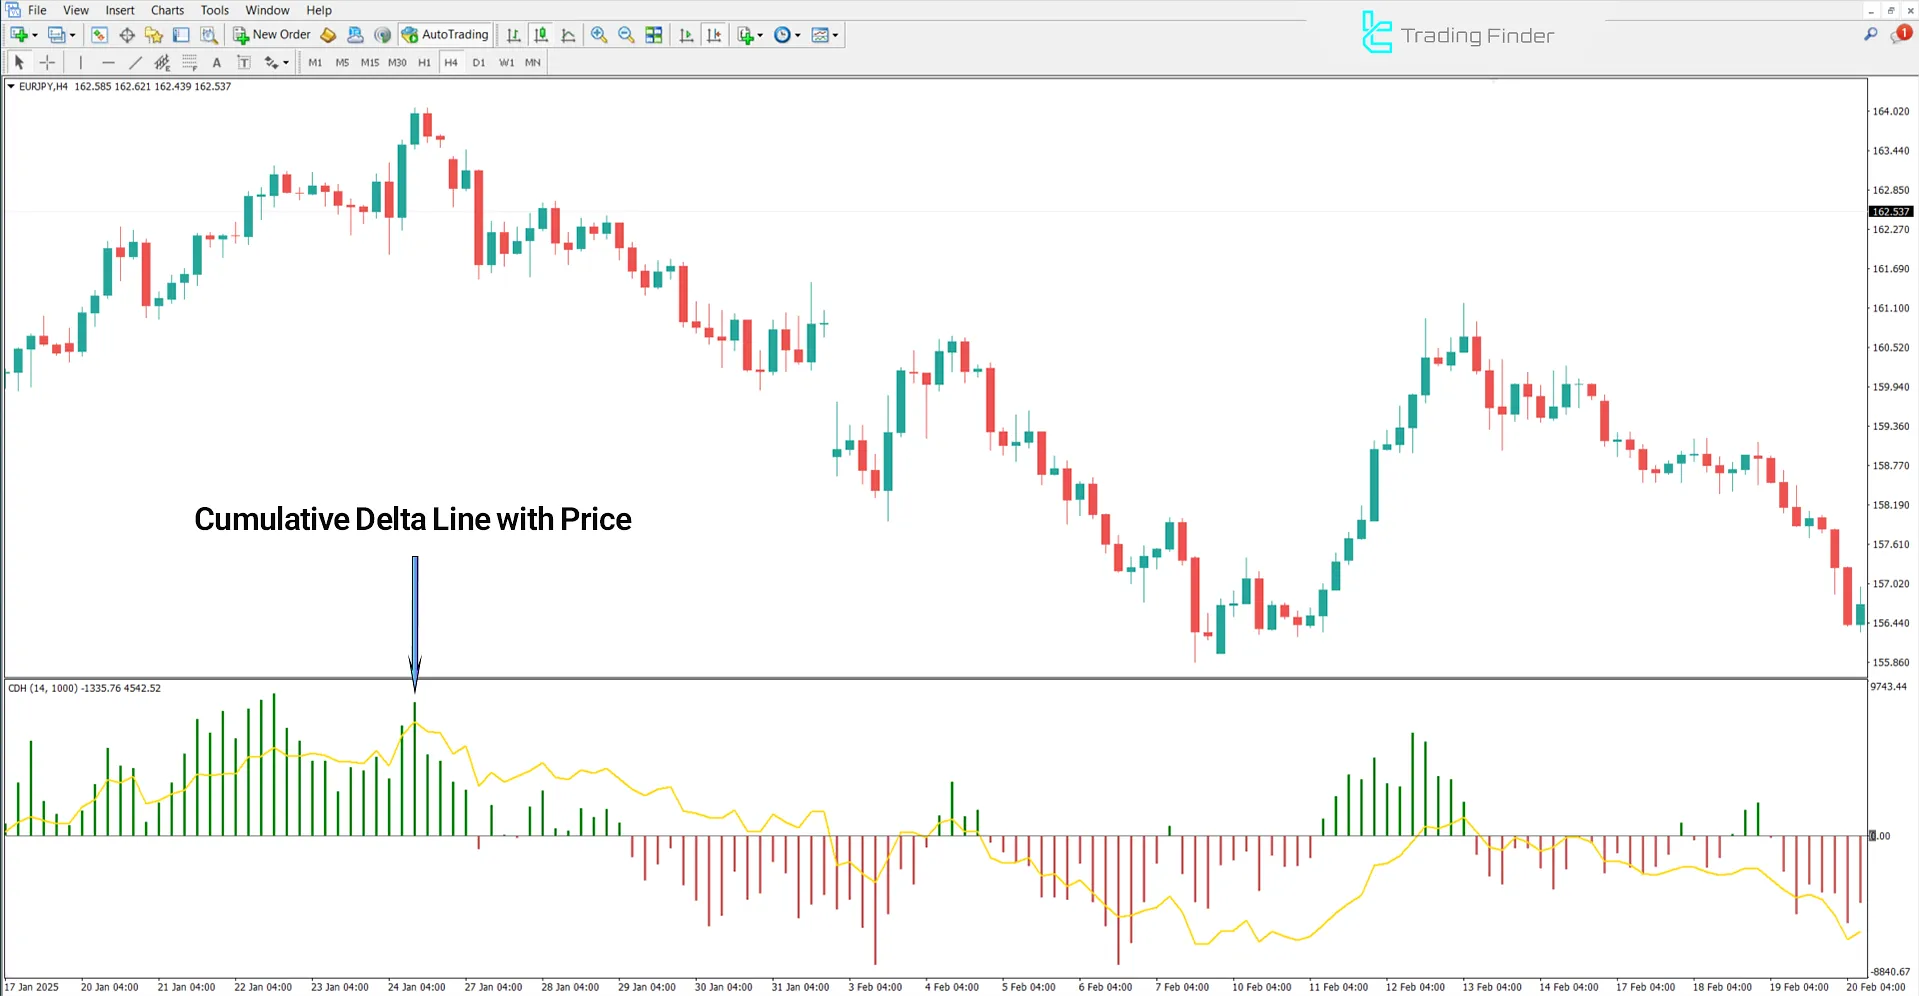
The following image shows the 4-hour price chart of the EUR/JPY currency pair. A descending delta curve, Cumulative Delta with Price, signals seller pressure in the market.
The simultaneous decline in price and delta indicates weak demand and supply dominance during the downtrend.

Cumulative Delta with Price Settings
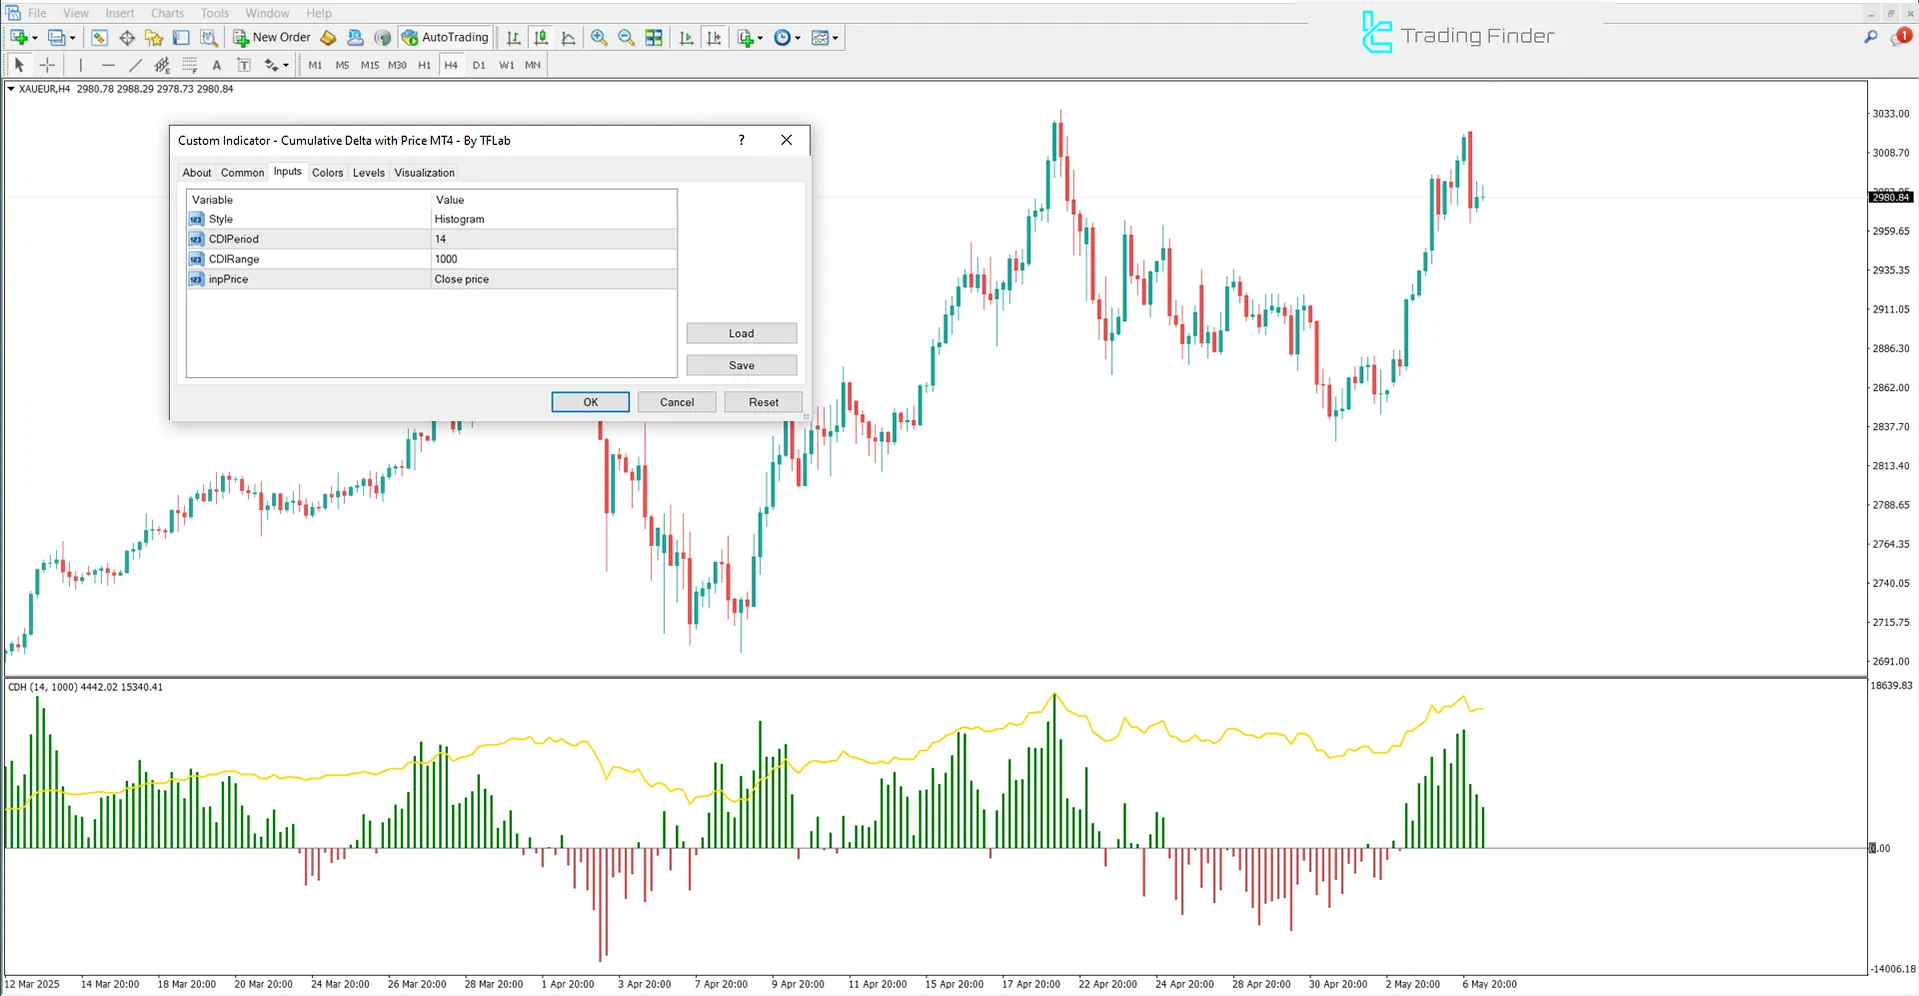
The settings panel of the Cumulative Delta with Price Indicator is shown in the image below:

- Style: Display style
- CDI Period: Delta calculation period
- CDI Range: Delta range
- inpPrice: Input price
Conclusion
The Cumulative Delta with Price Indicator visualizes cumulative delta from buy and sell pressure, presenting the actual order flow as an oscillator.
This oscillator is also highly useful in Trading Strategy involving key-level divergence detection, false breakout analysis, and volume analysis.
Cumulative Delta Price MT4 PDF
Cumulative Delta Price MT4 PDF
Click to download Cumulative Delta Price MT4 PDFWhat is Cumulative Delta with Price?
This indicator displays the cumulative difference between active buy (Ask) and active sell (Bid) volumes over a given period.
What is the difference between Cumulative Delta and Price and Volume Delta?
Volume Delta only shows the delta of a single candle, whereas Cumulative Delta with Price displays the accumulated delta and is in correlation with the price.


