![Current Volume Profile Indicator MT4 Download – Free – [TradingFinder]](https://cdn.tradingfinder.com/image/379683/13-124-en-current-volume-profile-mt4-01.webp)
![Current Volume Profile Indicator MT4 Download – Free – [TradingFinder] 0](https://cdn.tradingfinder.com/image/379683/13-124-en-current-volume-profile-mt4-01.webp)
![Current Volume Profile Indicator MT4 Download – Free – [TradingFinder] 1](https://cdn.tradingfinder.com/image/379684/13-124-en-current-volume-profile-mt4-02.webp)
![Current Volume Profile Indicator MT4 Download – Free – [TradingFinder] 2](https://cdn.tradingfinder.com/image/379682/13-124-en-current-volume-profile-mt4-03.webp)
![Current Volume Profile Indicator MT4 Download – Free – [TradingFinder] 3](https://cdn.tradingfinder.com/image/379681/13-124-en-current-volume-profile-mt4-04.webp)
The Current Volume Profile Indicator analyzes how trading volume is distributed across various price levels. Unlike time based traditional indicators, this one focuses on volume at a price.
This trading tool displays traded volume levels using horizontal purple bars across the chart.
Current Volume Profile Indicator Specifications
The table below outlines the key specifications of the Current Volume Profile Indicator.
Indicator Categories: | Volume MT4 Indicators Liquidity MT4 Indicators Trading Assist MT4 Indicators Volume Profile Indicators for MetaTrader 4 |
Platforms: | MetaTrader 4 Indicators |
Trading Skills: | Intermediate |
Indicator Types: | Reversal MT4 Indicators |
Timeframe: | M1-M5 Time MT4 Indicators M15-M30 Time MT4 Indicators H4-H1 Time MT4 Indicators |
Trading Style: | Day Trading MT4 Indicators Scalper MT4 Indicators Swing Trading MT4 Indicators |
Trading Instruments: | Forward Market MT4 Indicators Stock Market MT4 Indicators Cryptocurrency MT4 Indicators Forex MT4 Indicators |
Current Volume Profile Indicator at a Glance
One of the most important features of the Current Volume Profile Indicator is its ability to highlight the most heavily traded price level, the POC (Point of Control).
These levels are marked using orange histogram bars. It's worth noting that high volume at a particular price may indicate the presence of large market participants and key price levels.
Bullish Trend
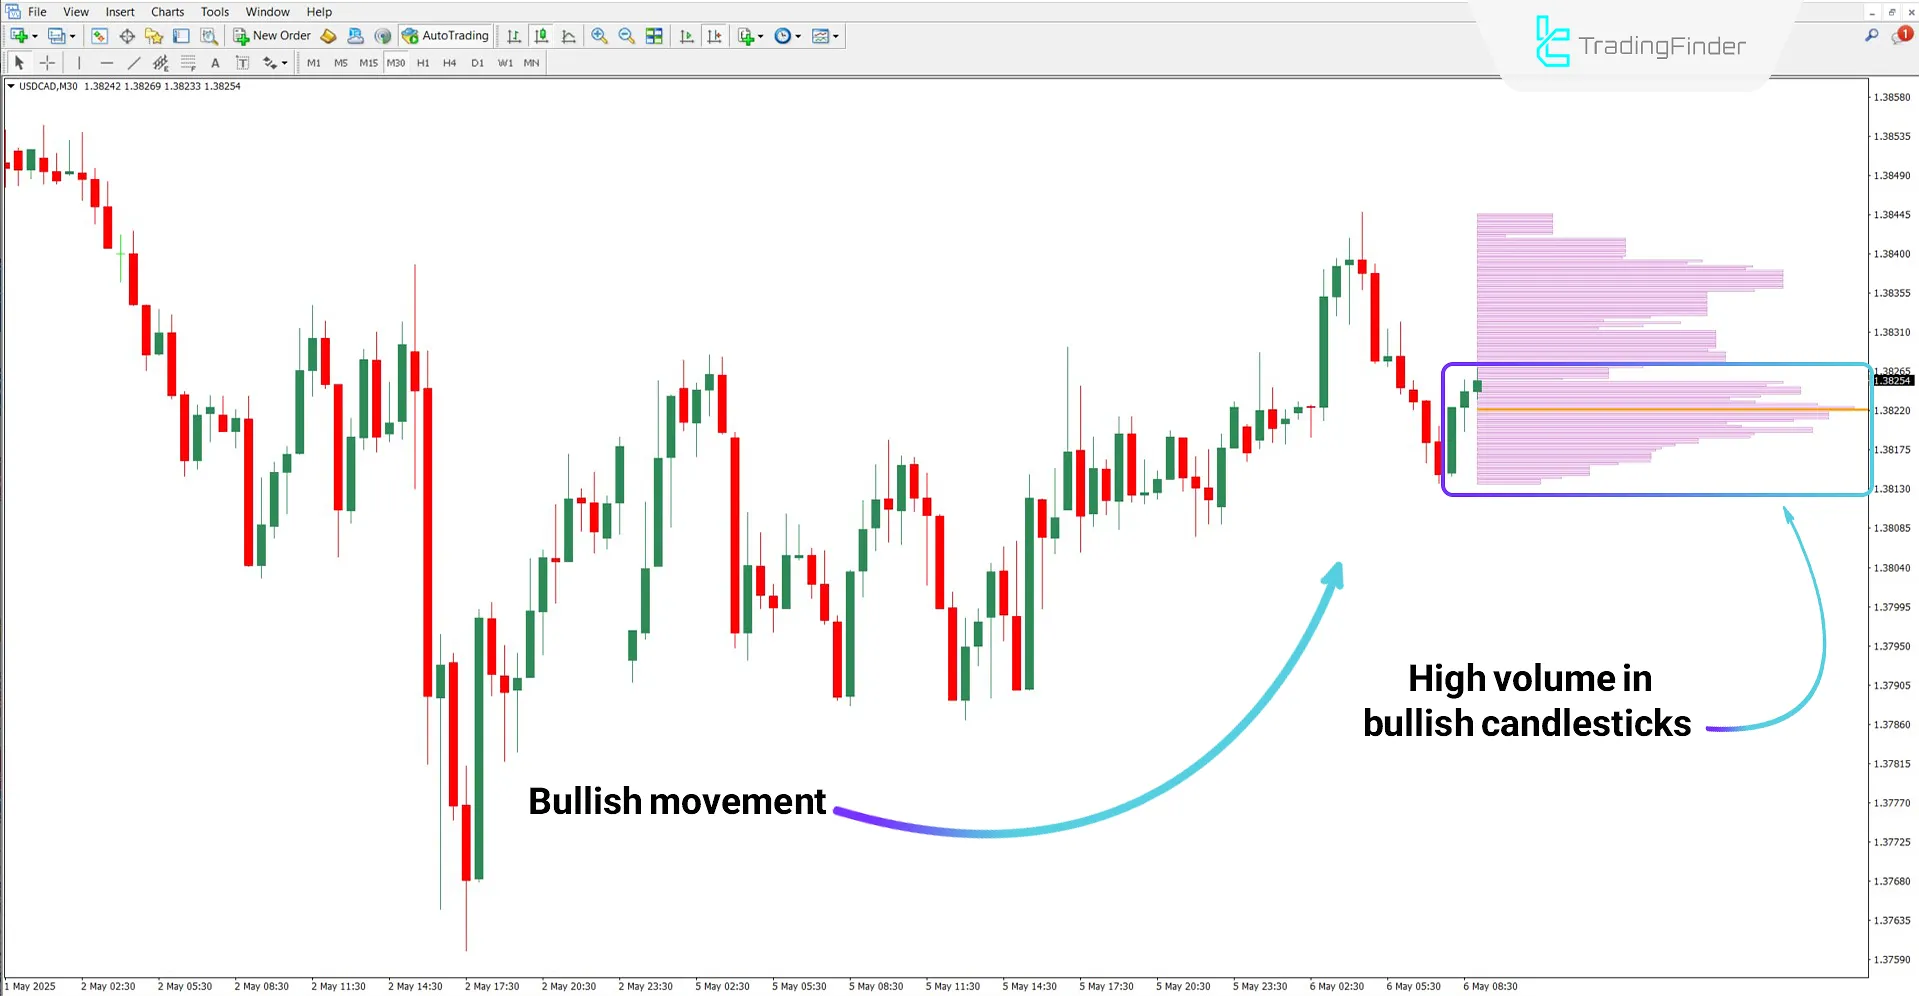
According to the 30-minute chart of the USD/CAD pair, a bullish trend has formed, confirmed by higher lows.
As shown in the marked area, purple histograms indicate volume at different price levels, and volume in bullish candles is higher than in bearish ones.

Bearish Trend
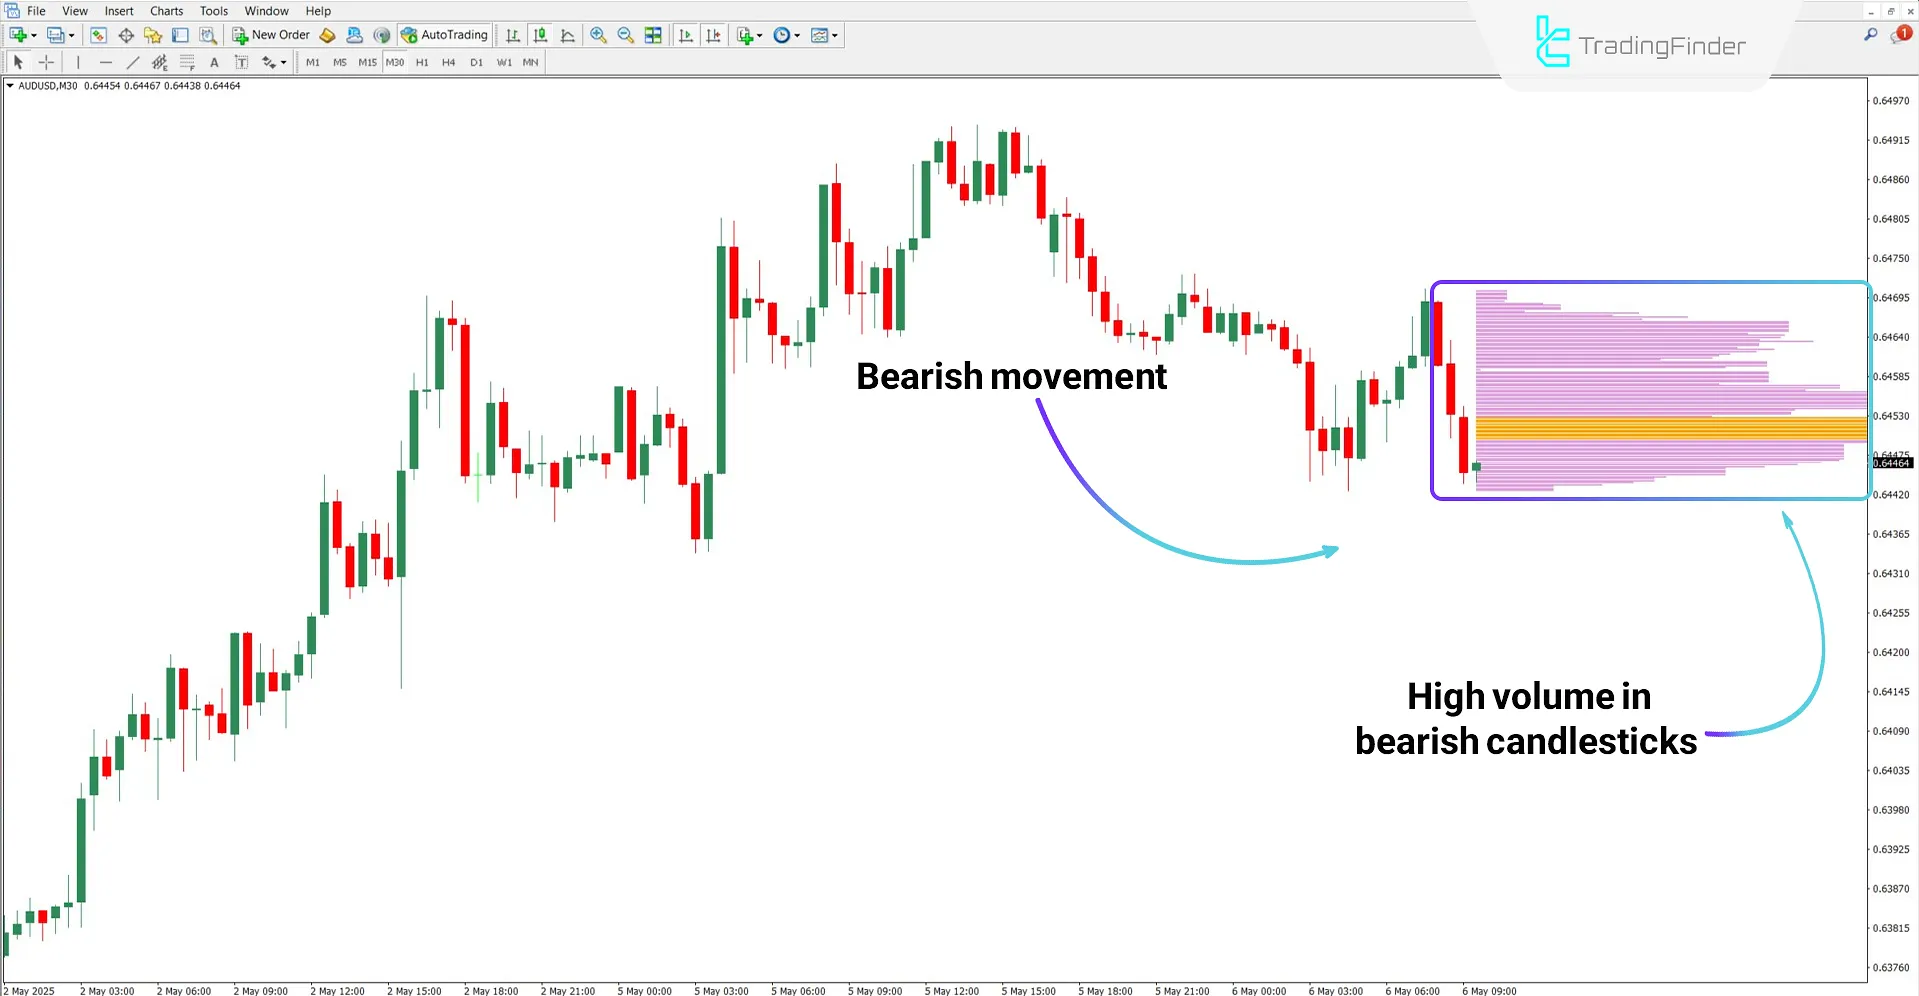
Based on the AUD/USD chart, the price experienced a bullish correction after a downward move and then resumed its decline.
According to the histograms, bearish candles recorded high volume, supporting the bearishscenario.
The orange bars display the most heavily traded level or POC.

Current Volume Profile Indicator Settings
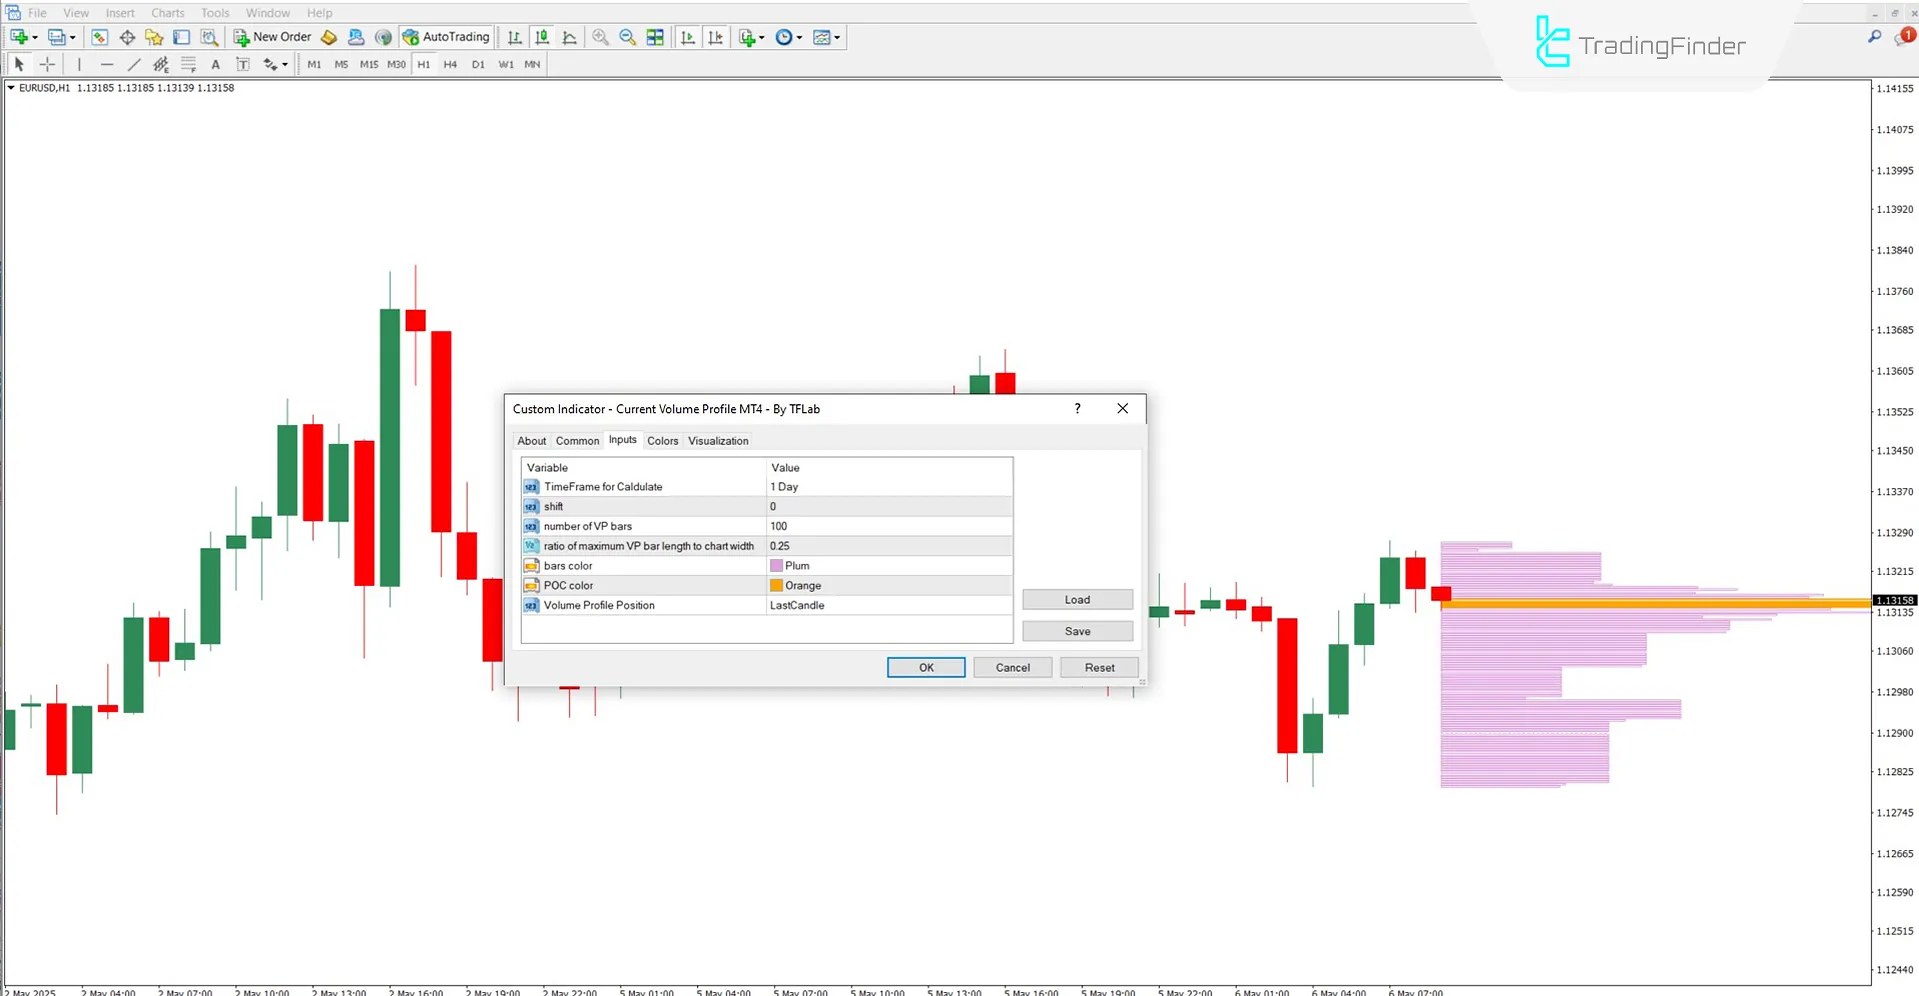
The following options can be configured in the Current Volume Profile Indicator:

- Timeframe for Calclulate: Sets the time range for analyzing volume data
- Shift: Moves the histogram display position
- Number of VP bars: Sets the number of volume bars to show
- The ratio of maximum VP bar length to chart width: Controls the relative width of the longest bar
- Bars color: Sets the color of volume bars
- POC color: Sets the color of the POC bar
- Volume Profile Position: Determines where the profile appears on the chart
Note: The timeframe set in the "TimeFrame for Calclulate" field must be larger than the chart timeframe on which the indicator is applied.
Conclusion
In technical analysis, combining price structure with volume distribution offers a powerful approach to identifying market direction.
The Current Volume Profile Indicator's visual volume display allows traders to anticipate market direction before price action confirms it.
Current Volume Profile MT4 PDF
Current Volume Profile MT4 PDF
Click to download Current Volume Profile MT4 PDFDoes the Current Volume Profile Indicator generate entry or exit signals?
No, this indicator is not designed to provide trade signals.
Can this indicator be used on a daily timeframe?
No, it is only suitable for 1 minute and 1 hour timeframes.
جسارتا ربات جواب سوال هارو میده؟ یا اندیکاتوری که ارایه میدین همینه که هست و تغییری نمیدین و نظر کاربر مهم نیست! من چیز دیگه ای پرسیدم و توی ویدیو و تنظیمات هیچ چیزی نیست! من سوالم راجع به اضافه کردن value are ها بود پشتیبانی تلگرام هم که فقط بروکر معرفی میکنن و پراپ!
سلام تیم پشیبانی، پاسخ گوی مشتریان در افتتاح حساب، تایید حساب و انتخاب بهترین بروکر فارکس، پراپ و کریپتو هستند. ما لیستی از سوالات متداول رو در پشیبانی زنده سایت قرار دادیم که به راحتی بیش از 90% سوالات و خواسته های تریدرها رو پاسخ می دهد. اما اگر نظر در مورد هر اندیکاتور دارید؛ در پایین همان اندیکاتور و یا اکسپرت مطرح بفرمایید.
سه سوال.وقتی قیمت میره جلو و شروع به ادامه میکنه اندیکاتور خودش develop میشه روی mt4?فکر کنم باگ داشته باشه و develop نشه و نیاز به تعویض تایم فریم داره.دوم میشه خواهشن VAL/VAH و LVN,HVN رو بشه اضافه کرد؟ همین الان فوقالعاده سریع و روان کار میکنه واقعا ممنون
در ویدئو ضمیمه شده در همین صفحه؛ راهنمایی کامل وجود دارد. از بازخورد خوبتان ممنونم.
Hi. Your works are awesome! Thanks for your great content and indicator. Very free, valuable stuff. دمتون گرم.کرک و پرم ریخت فهمیدم ایرانی هستین.کاش میشد باهاتون صحبت کرد.ادامه بدین .Luxalgo ی هستین واسه خودتون


