![Custom MACD Indicator for MetaTrader 4 – [Trading Finder]](https://cdn.tradingfinder.com/image/372789/2-57-en-custom-macd-mt4-1.webp)
![Custom MACD Indicator for MetaTrader 4 – [Trading Finder] 0](https://cdn.tradingfinder.com/image/372789/2-57-en-custom-macd-mt4-1.webp)
![Custom MACD Indicator for MetaTrader 4 – [Trading Finder] 1](https://cdn.tradingfinder.com/image/372782/2-57-en-custom-macd-mt4-2.webp)
![Custom MACD Indicator for MetaTrader 4 – [Trading Finder] 2](https://cdn.tradingfinder.com/image/372790/2-57-en-custom-macd-mt4-3.webp)
![Custom MACD Indicator for MetaTrader 4 – [Trading Finder] 3](https://cdn.tradingfinder.com/image/372783/2-57-en-custom-macd-mt4-4.webp)
The Custom MACD indicator is one of the most widely used tools in technical analysis, designed to assess a price trend's strength, direction, and momentum. This indicator is made up of two main components:
- MACD Line (blue): Plotted based on the difference between moving averages
- Signal Line (red): Calculated as a moving average of the MACD line, used to identify market reversal points better
Custom MACD Specifications Table
The features of the Custom MACD indicator are shown in the table below.
Indicator Categories: | Oscillators MT4 Indicators Signal & Forecast MT4 Indicators Trading Assist MT4 Indicators MACD Indicators for MetaTrader 4 |
Platforms: | MetaTrader 4 Indicators |
Trading Skills: | Intermediate |
Indicator Types: | Trend MT4 Indicators Reversal MT4 Indicators |
Timeframe: | Multi-Timeframe MT4 Indicators |
Trading Style: | Intraday MT4 Indicators |
Trading Instruments: | Stock Market MT4 Indicators Cryptocurrency MT4 Indicators Forex MT4 Indicators |
Uptrend Conditions
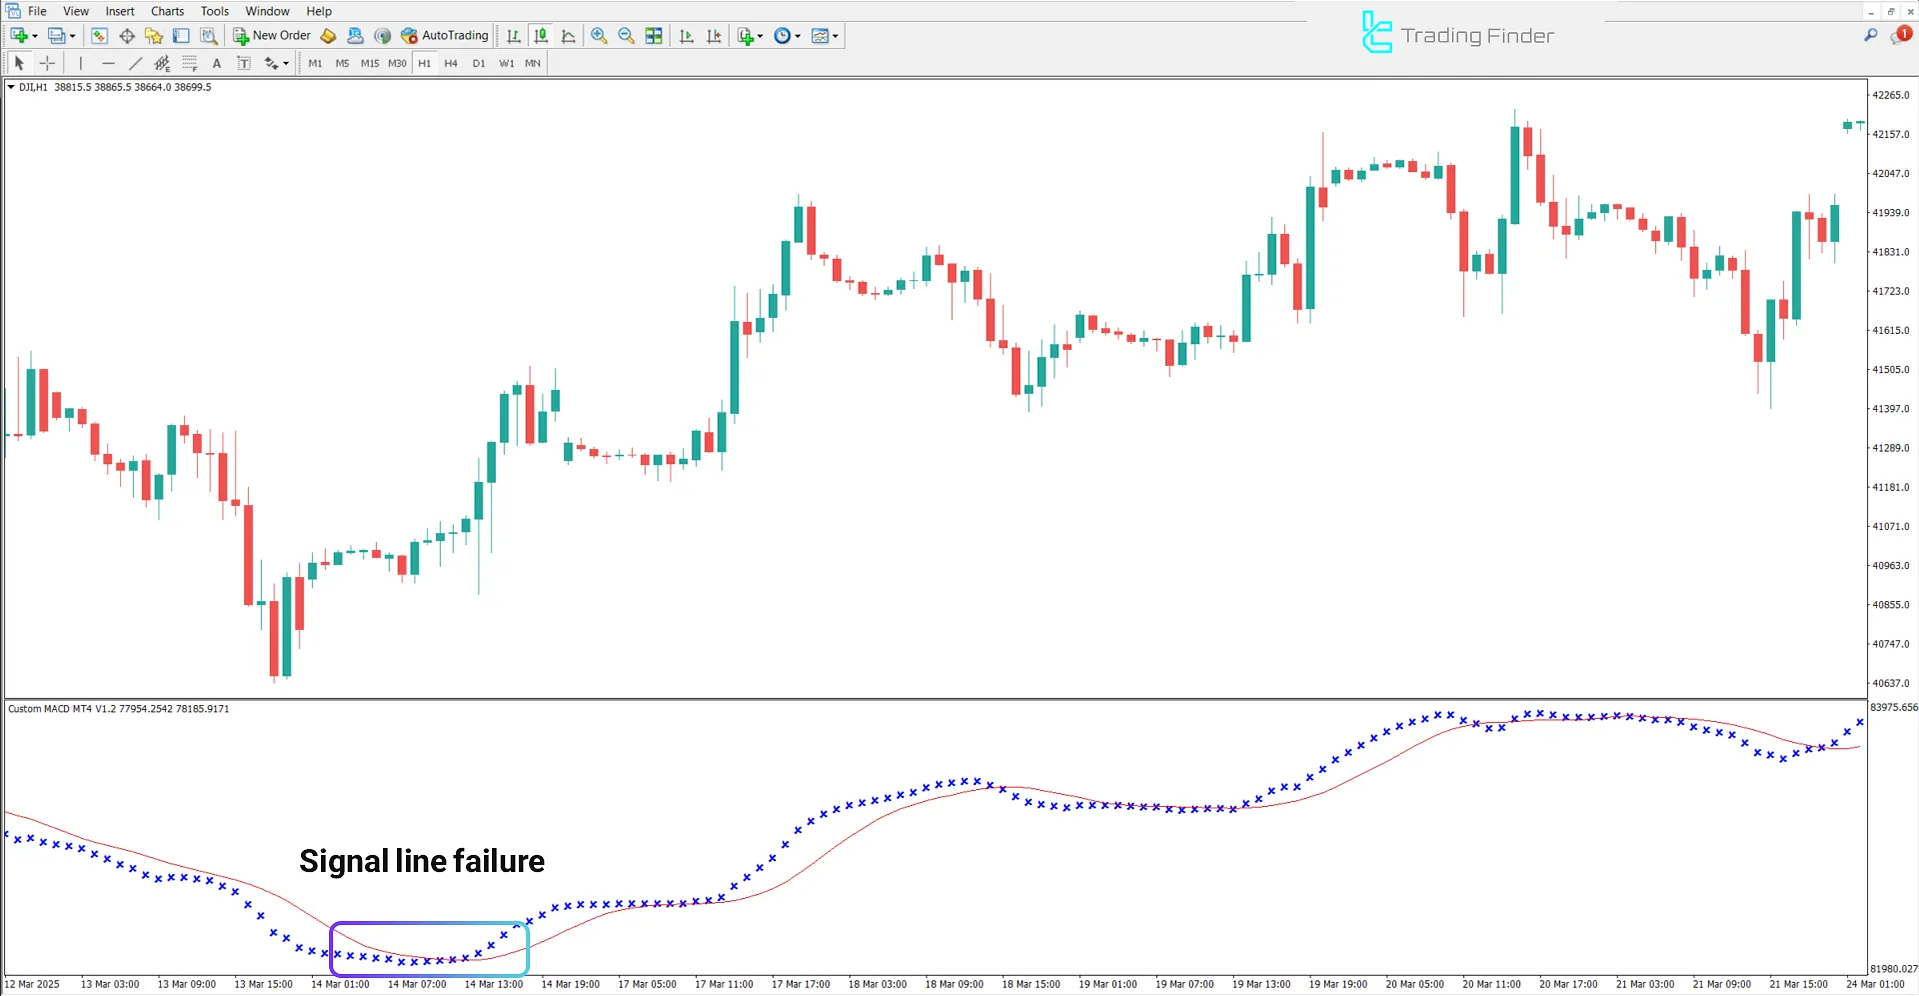
The Dow Jones (DJI) price chart shows signs of a potential trend reversal toward a bullish direction.
This signal appears when the MACD line crosses above the Signal line—an area where the MACD line cuts the Signal line from below.
Such a crossover is typically considered a signal for price growth and defines a potential entry point for buy positions.

Downtrend Conditions
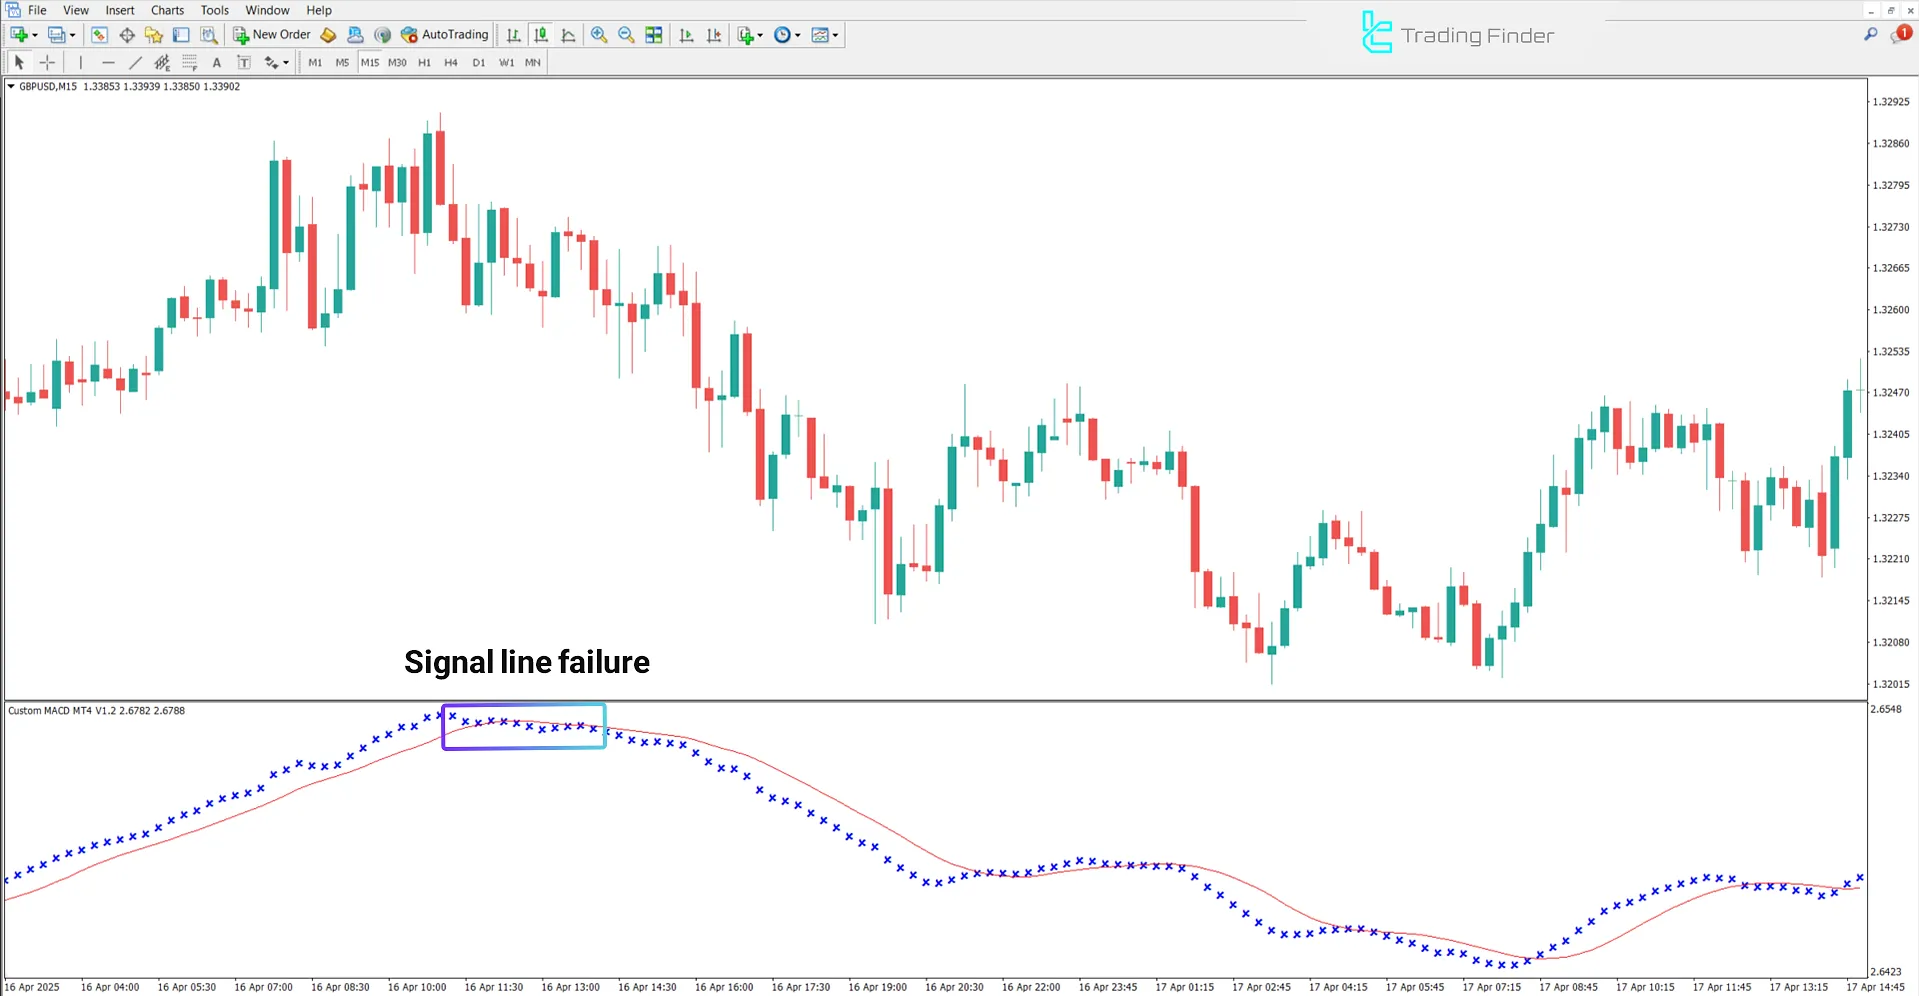
The image below shows a bearish GBP/USD currency pair chart trend. This occurs when the MACD line crosses below the Signal line. Such a crossover is often seen as a warning of a trend reversal and the beginning of a bearish phase.

Indicator Settings
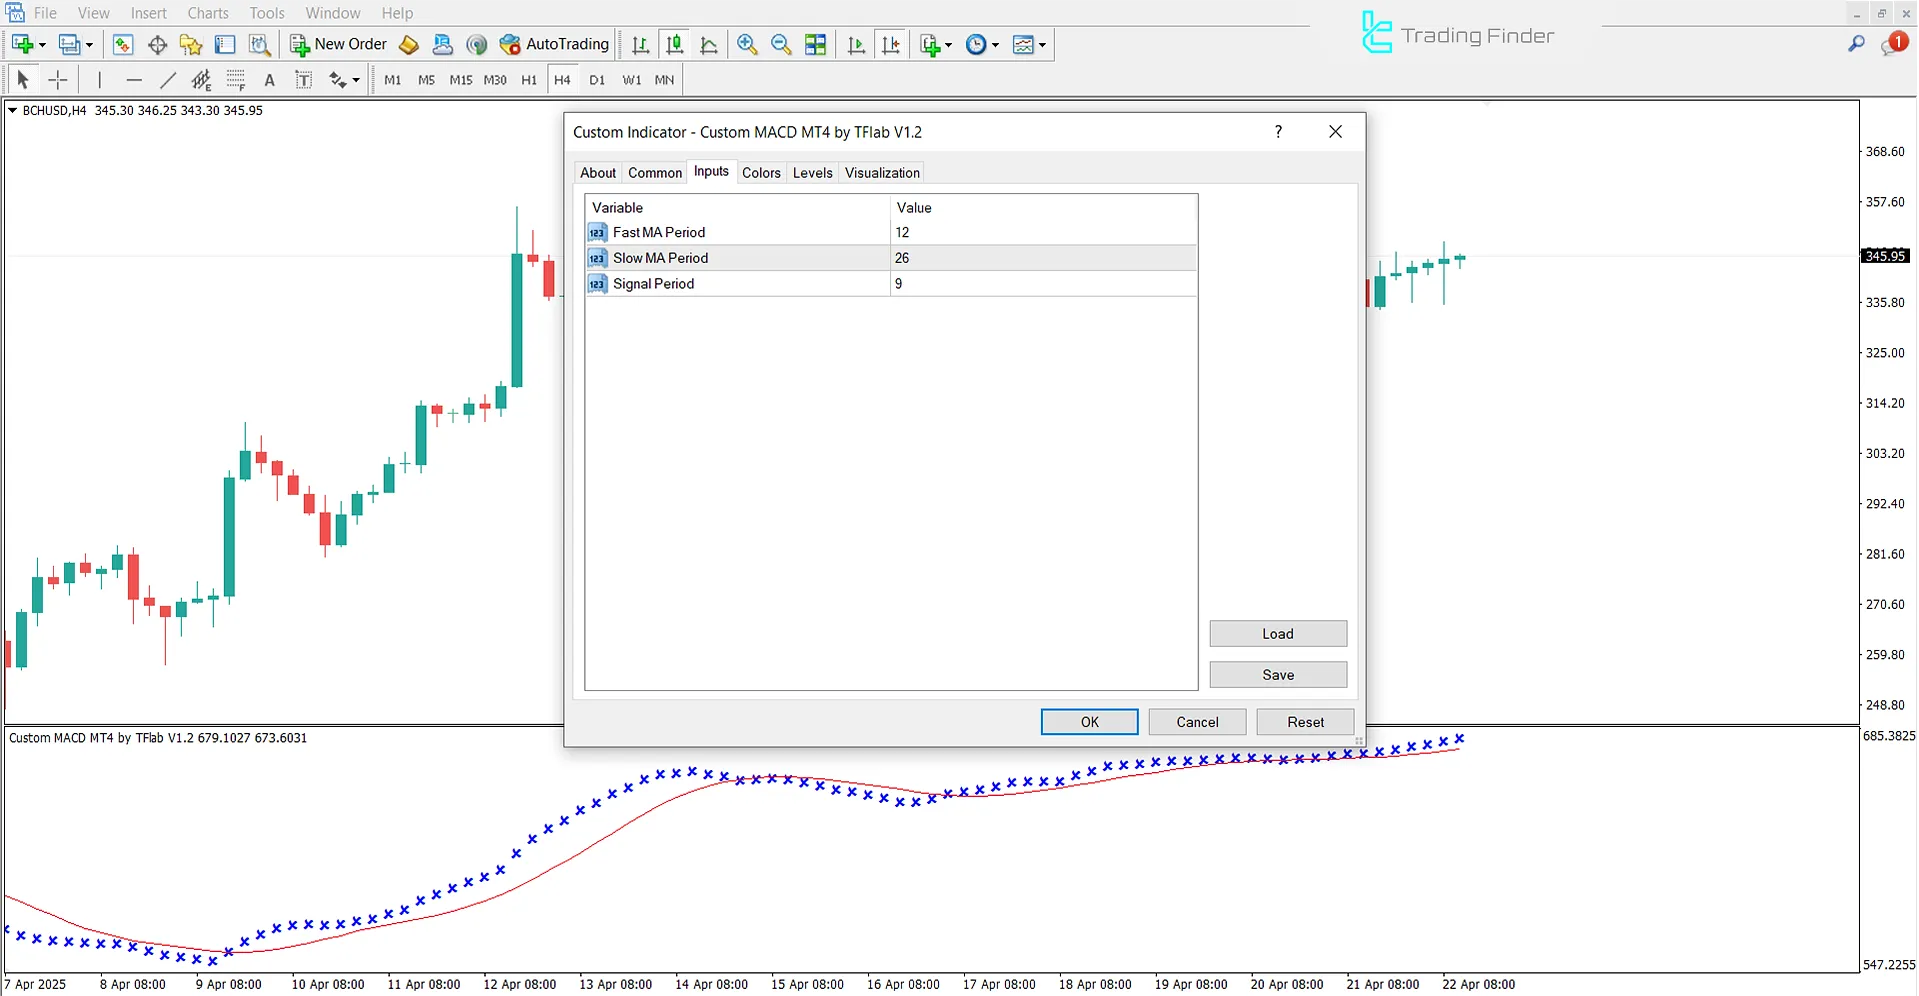
The settings panel of the Custom MACD indicator is shown in the image below:

- Fast MA Period: Period of the fast-moving average
- Slow MA Period: Period of the slow-moving average
- Signal Period: Period of the signal line
Conclusion
The Custom MACD Indicator calculates the difference between two EMAs and offers customizable parameter settings. This enables traders to optimize and personalize the indicator's performance according to specific market conditions and trading strategies. It also provides clear entry and exit signals for trades.
Custom MACD MT4 PDF
Custom MACD MT4 PDF
Click to download Custom MACD MT4 PDFWhat advantages does the Custom MACD have over the standard version?
Unlike the standard version, the custom MACD indicator allows analysts to adjust key parameters to suit the market type, trading timeframe, and personal strategy.
When is a buy signal typically generated in MACD?
A buy signal is triggered when the MACD line crosses above the signal line from below.


