![Da Vinci Indicator for MetaTrader 4 Download – Free – [TradingFinder]](https://cdn.tradingfinder.com/image/658626/13-238-en-da-vinci-mt4-01.webp)
![Da Vinci Indicator for MetaTrader 4 Download – Free – [TradingFinder] 0](https://cdn.tradingfinder.com/image/658626/13-238-en-da-vinci-mt4-01.webp)
![Da Vinci Indicator for MetaTrader 4 Download – Free – [TradingFinder] 1](https://cdn.tradingfinder.com/image/658624/13-238-en-da-vinci-mt4-02.webp)
![Da Vinci Indicator for MetaTrader 4 Download – Free – [TradingFinder] 2](https://cdn.tradingfinder.com/image/658625/13-238-en-da-vinci-mt4-03.webp)
![Da Vinci Indicator for MetaTrader 4 Download – Free – [TradingFinder] 3](https://cdn.tradingfinder.com/image/658628/13-238-en-da-vinci-mt4-04.webp)
The Da Vinci Indicator is designed by combining three indicators: the Relative Strength Index (RSI), Commodity Channel Index (CCI), and Bollinger Bands.
This trading tool integrates these indicators into a unified system to provide accurate entry and exit signals. The trading signals in this tool are represented using blue and red arrow markers.
Da Vinci Indicator Specification Table
The features of the Da Vinci Indicator are shown in the table below:
Indicator Categories: | Signal & Forecast MT4 Indicators Currency Strength MT4 Indicators Bands & Channels MT4 Indicators |
Platforms: | MetaTrader 4 Indicators |
Trading Skills: | Elementary |
Indicator Types: | Reversal MT4 Indicators |
Timeframe: | Multi-Timeframe MT4 Indicators |
Trading Style: | Day Trading MT4 Indicators Scalper MT4 Indicators Swing Trading MT4 Indicators |
Trading Instruments: | Share Stocks MT4 Indicators Indices Market MT4 Indicators Commodity Market MT4 Indicators Stock Market MT4 Indicators Cryptocurrency MT4 Indicators Forex MT4 Indicators |
Da Vinci Indicator at a Glance
The Da Vinci Indicator determines trading signals based on the relationship between the two indicators “RSI” and “CCI” relative to the Bollinger Bands.
When both “RSI” and “CCI” reach the oversold zone and the price crosses the lower Bollinger Band, a buy signal is issued.
Conversely, when overbought conditions are confirmed by “RSI” and “CCI” and the price reaches the upper Bollinger Band, the indicator identifies this and issues a sell signal.
Buy Signal
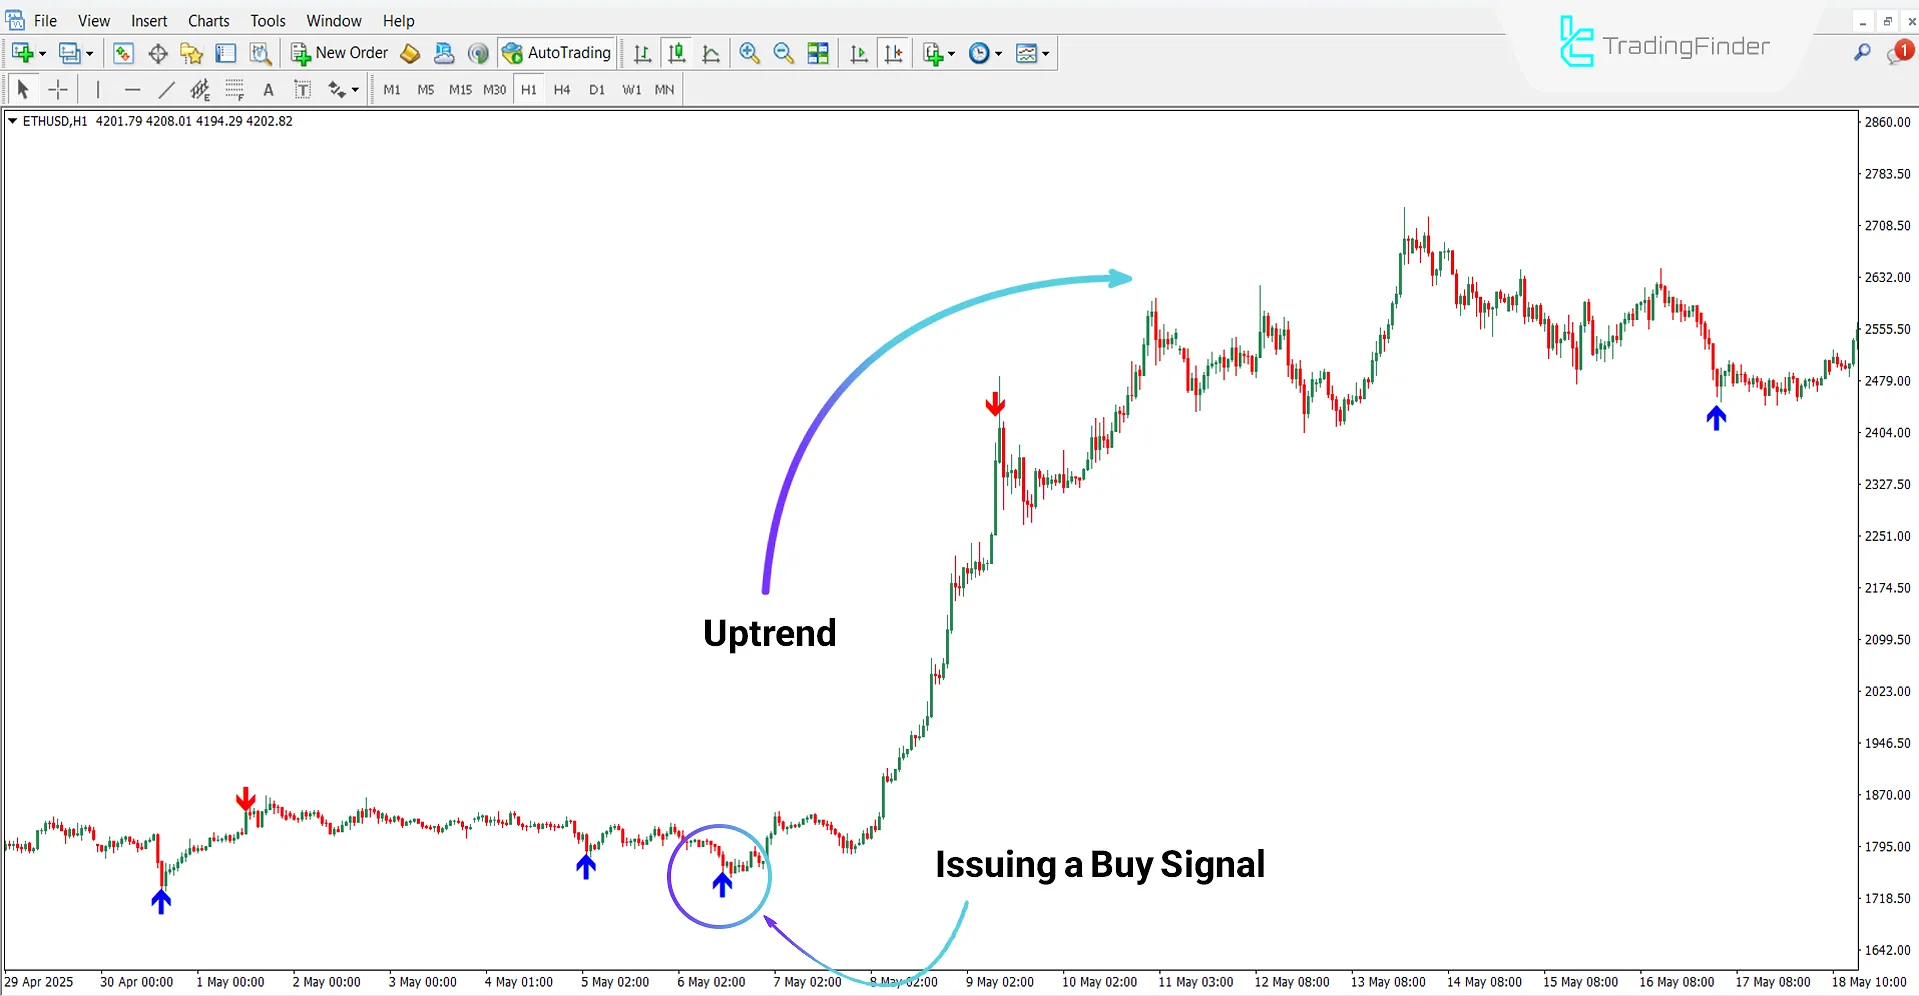
Based on the Ethereum (ETH) cryptocurrency chart in the 1-hour timeframe, the indicator issued a buy signal using a blue arrow.
Traders can act upon these signals according to the market’s movement direction.

Sell Signal
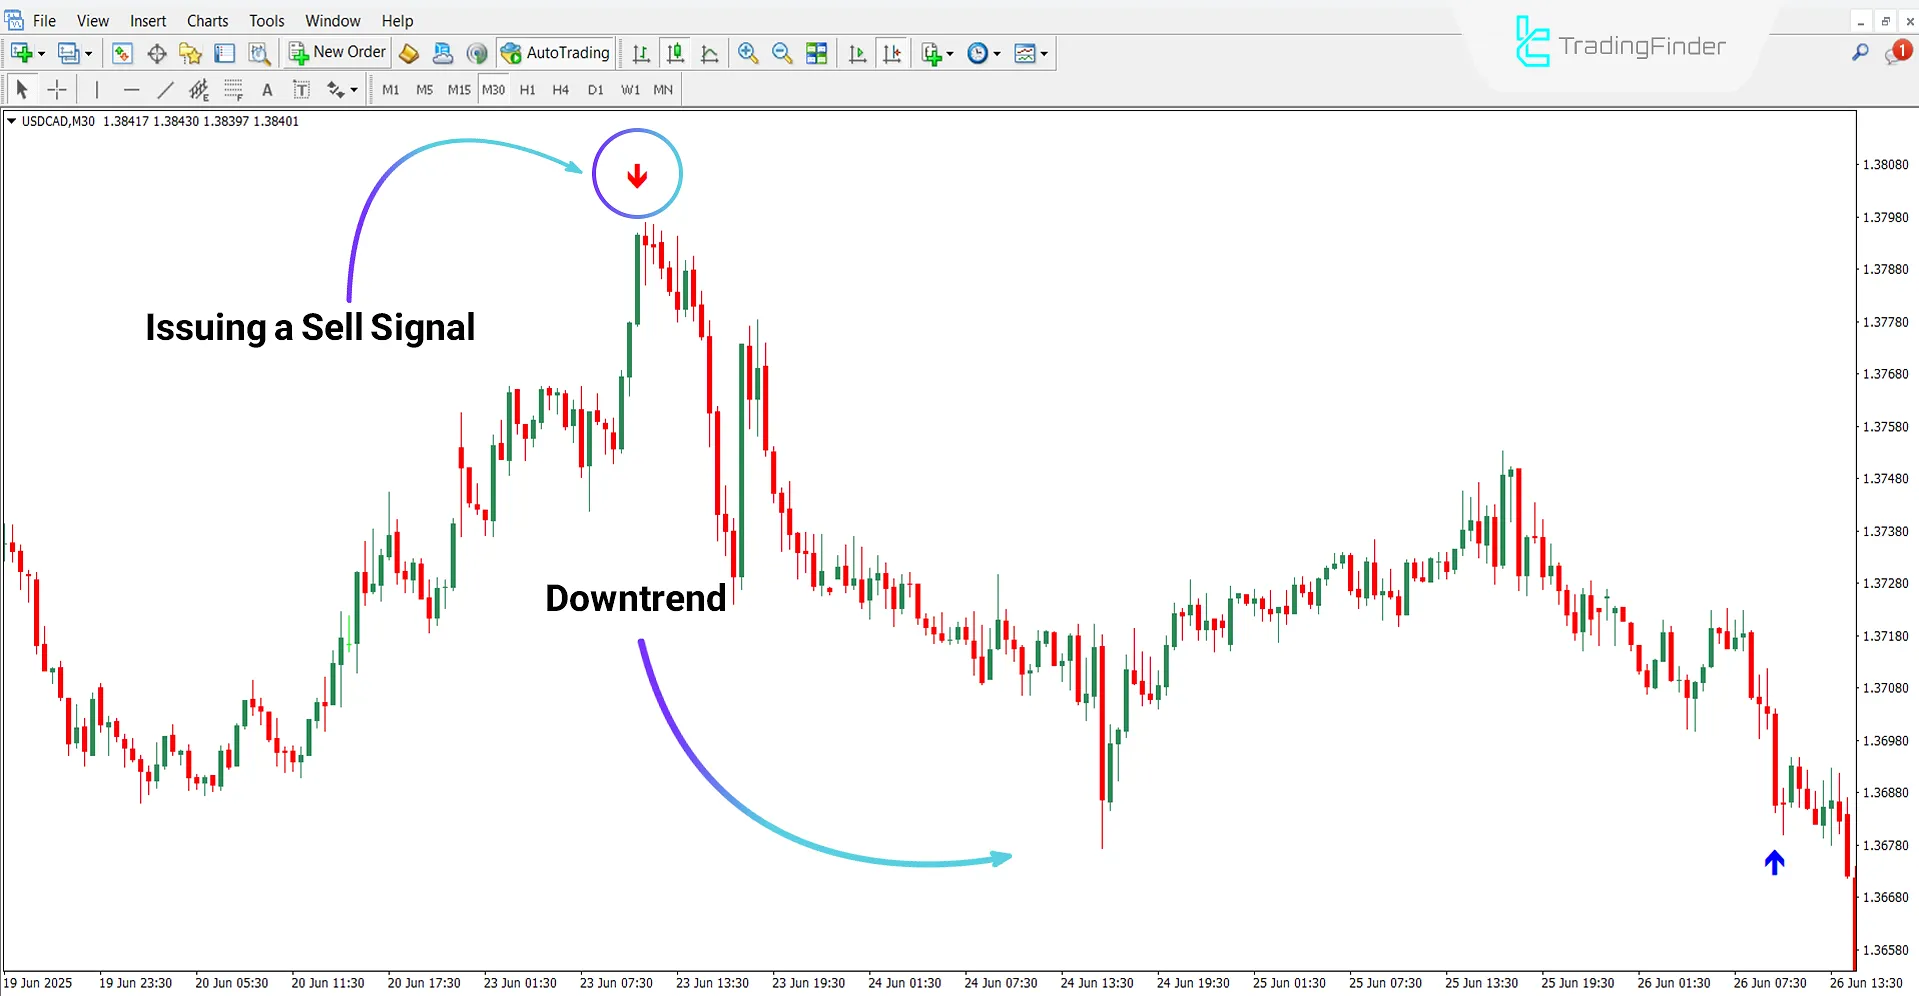
According to the USD/CAD chart in the 30-minute timeframe, the red arrow indicates the optimal point for entering sell trades.
As shown in the image below, after the Da Vinci Indicator issued the signal, the market trend turned bearish.

Da Vinci Indicator Settings
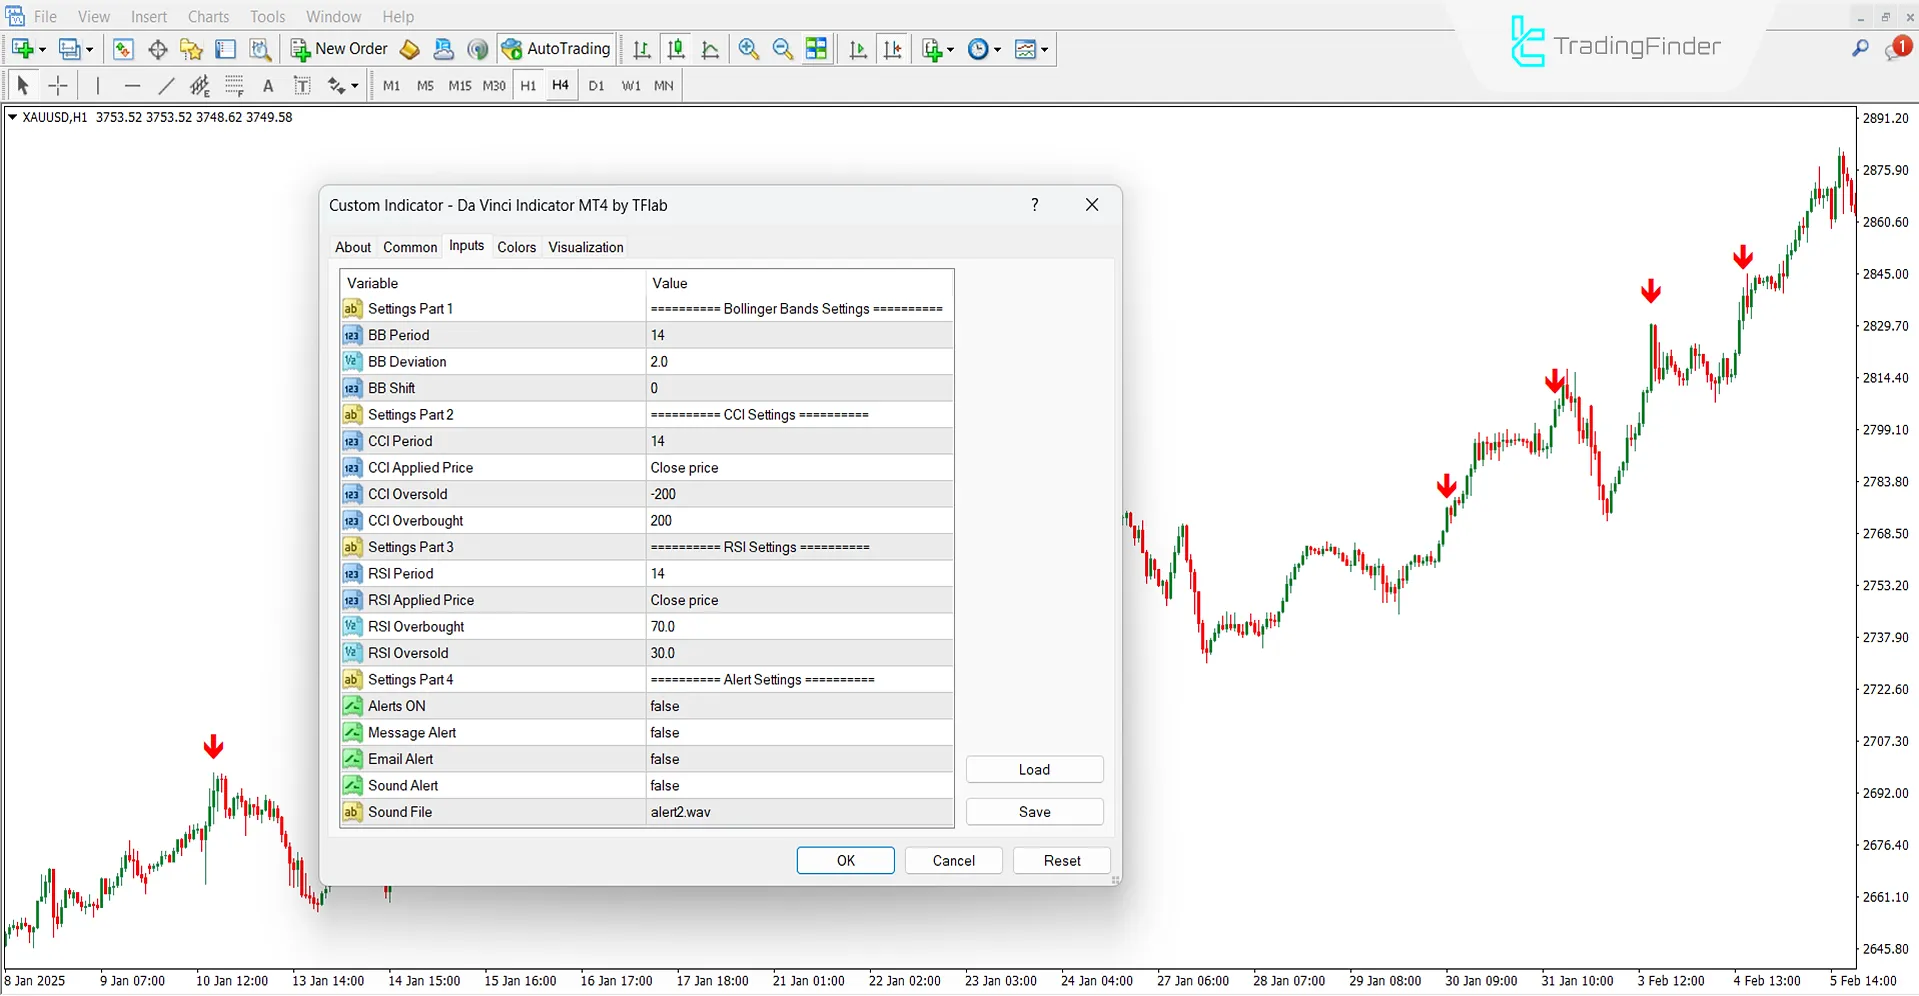
The adjustable parameters in the Da Vinci Indicator are as follows:

Bollinger Bands Settings
- BB Period: Bollinger Bands period
- BB Deviation: Standard deviation of the band
- BB Shift: Band shift
CCI Settings
- CCI Period: CCI period
- CCI Applied Price: Applied price
- CCI Oversold: Oversold zone
- CCI Overbought: Overbought zone
RSI Settings
- RSI Period: Relative Strength Index period
- RSI Applied Price: Applied price
- RSI Overbought: RSI overbought zone
- RSI Oversold: RSI oversold zone
Alert Settings
- Alerts ON: Enable alerts
- Message Alert: Text alert
- Email Alert: Email notification
- Sound Alert: Sound notification
- Sound File: Alert sound file
Conclusion
The Da Vinci Indicator issues trading signals using three tools: Bollinger Bands, “CCI,” and Relative Strength Index.
By analyzing the relationship between these three indicators, it identifies suitable entry points and displays them using arrow markers.
Da Vinci Indicator for MetaTrader 4 PDF
Da Vinci Indicator for MetaTrader 4 PDF
Click to download Da Vinci Indicator for MetaTrader 4 PDFDoes this indicator issue signals on short timeframes?
Yes, the Da Vinci Indicator is multi-timeframe and issues signals across all time intervals.
What do the red arrows represent?
The red arrows indicate sell trade opportunities.


