![Damiani Volatmeter (Voltameter) Oscillator MT4 – Free – [TradingFinder]](https://cdn.tradingfinder.com/image/512153/13-196-en-damiani-voltameter-mt4-01.webp)
![Damiani Volatmeter (Voltameter) Oscillator MT4 – Free – [TradingFinder] 0](https://cdn.tradingfinder.com/image/512153/13-196-en-damiani-voltameter-mt4-01.webp)
![Damiani Volatmeter (Voltameter) Oscillator MT4 – Free – [TradingFinder] 1](https://cdn.tradingfinder.com/image/512126/13-196-en-damiani-voltameter-mt4-02.webp)
![Damiani Volatmeter (Voltameter) Oscillator MT4 – Free – [TradingFinder] 2](https://cdn.tradingfinder.com/image/512137/13-196-en-damiani-voltameter-mt4-03.webp)
![Damiani Volatmeter (Voltameter) Oscillator MT4 – Free – [TradingFinder] 3](https://cdn.tradingfinder.com/image/512144/13-196-en-damiani-voltameter-mt4-04.webp)
The Damiani Volatmeter (Voltameter) indicator is designed to identify and display phases of high and low volatility in the market.
This trading tool does not directly generate buy or sell signals but provides traders with essential information about the proper timing for entering trades.
The Damiani Voltameter oscillator consists of two lines: the green line (volatility line) and the gray line (noise line), which together define the positioning relative to each other.
Table of Specifications for Damiani Volatmeter Indicator
Specifications of Damiani Volatmeter Oscillator are as follows.
Indicator Categories: | Oscillators MT4 Indicators Signal & Forecast MT4 Indicators Volatility MT4 Indicators |
Platforms: | MetaTrader 4 Indicators |
Trading Skills: | Intermediate |
Indicator Types: | Range MT4 Indicators Reversal MT4 Indicators |
Timeframe: | Multi-Timeframe MT4 Indicators |
Trading Style: | Day Trading MT4 Indicators Scalper MT4 Indicators Swing Trading MT4 Indicators |
Trading Instruments: | Stock Market MT4 Indicators Cryptocurrency MT4 Indicators Forex MT4 Indicators |
Damiani Volatmeter Oscillator at a Glance
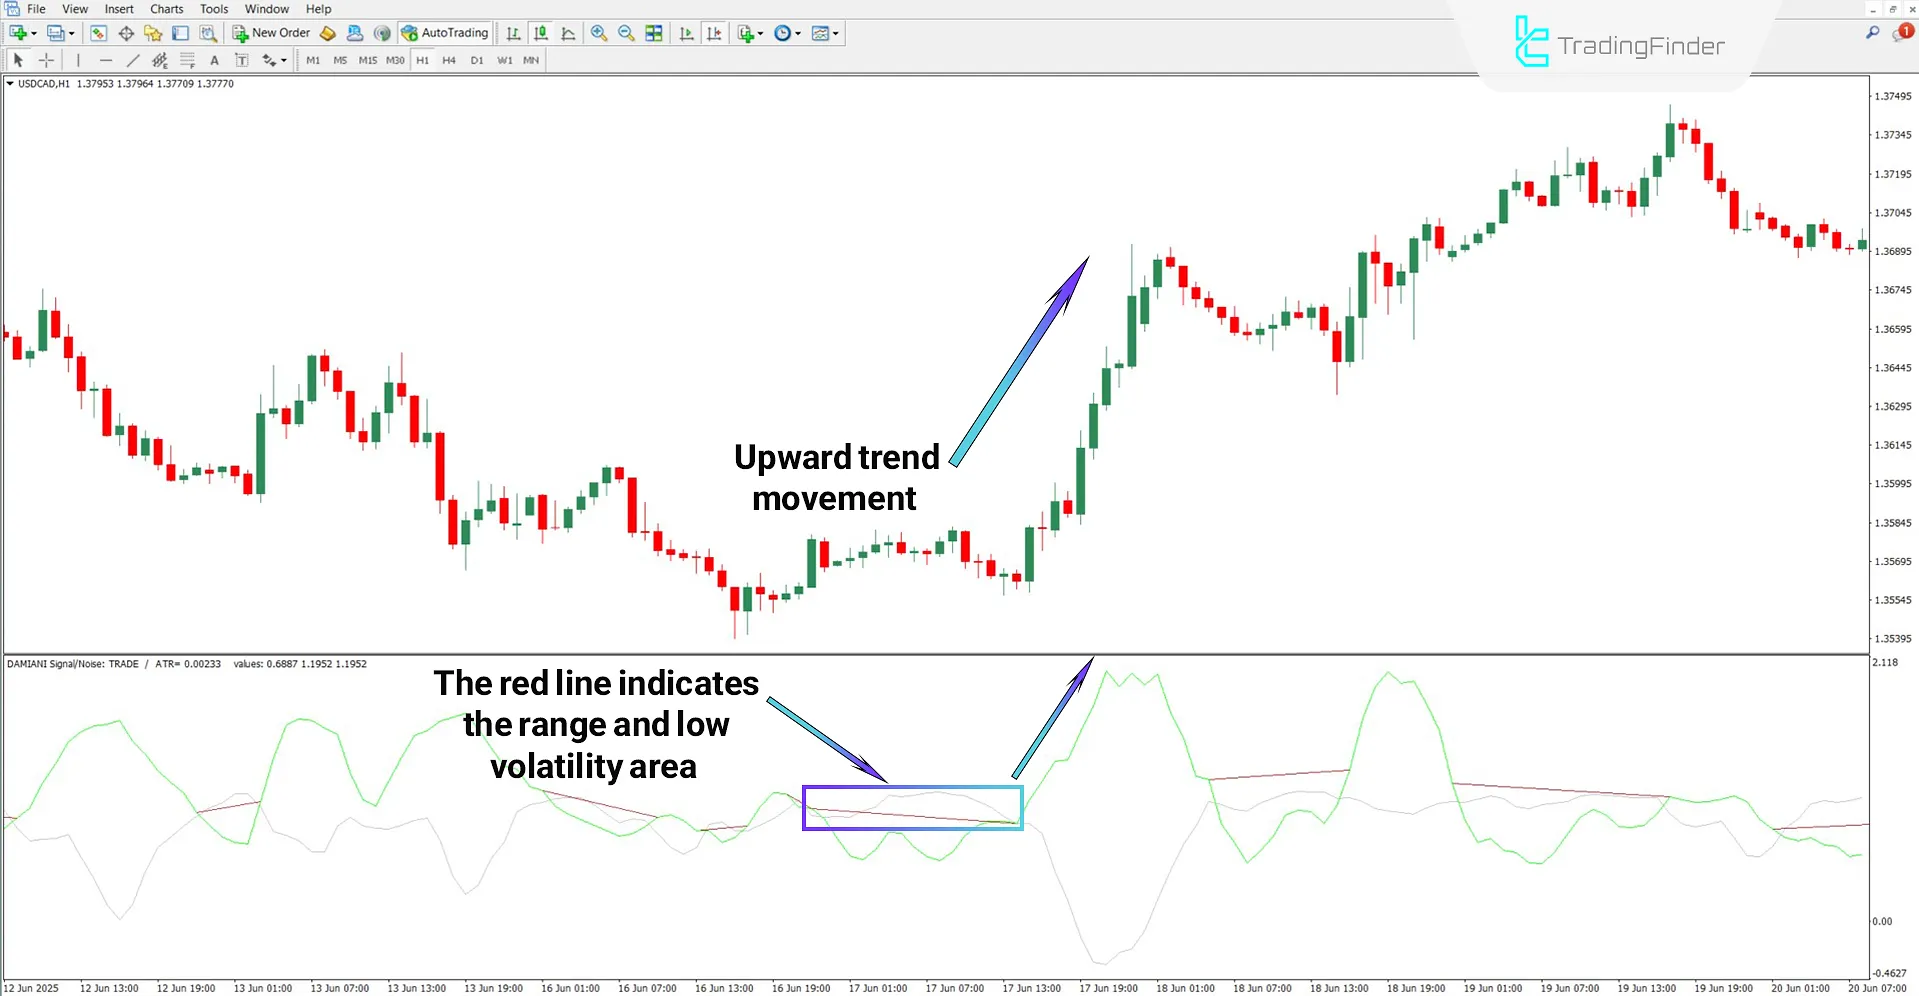
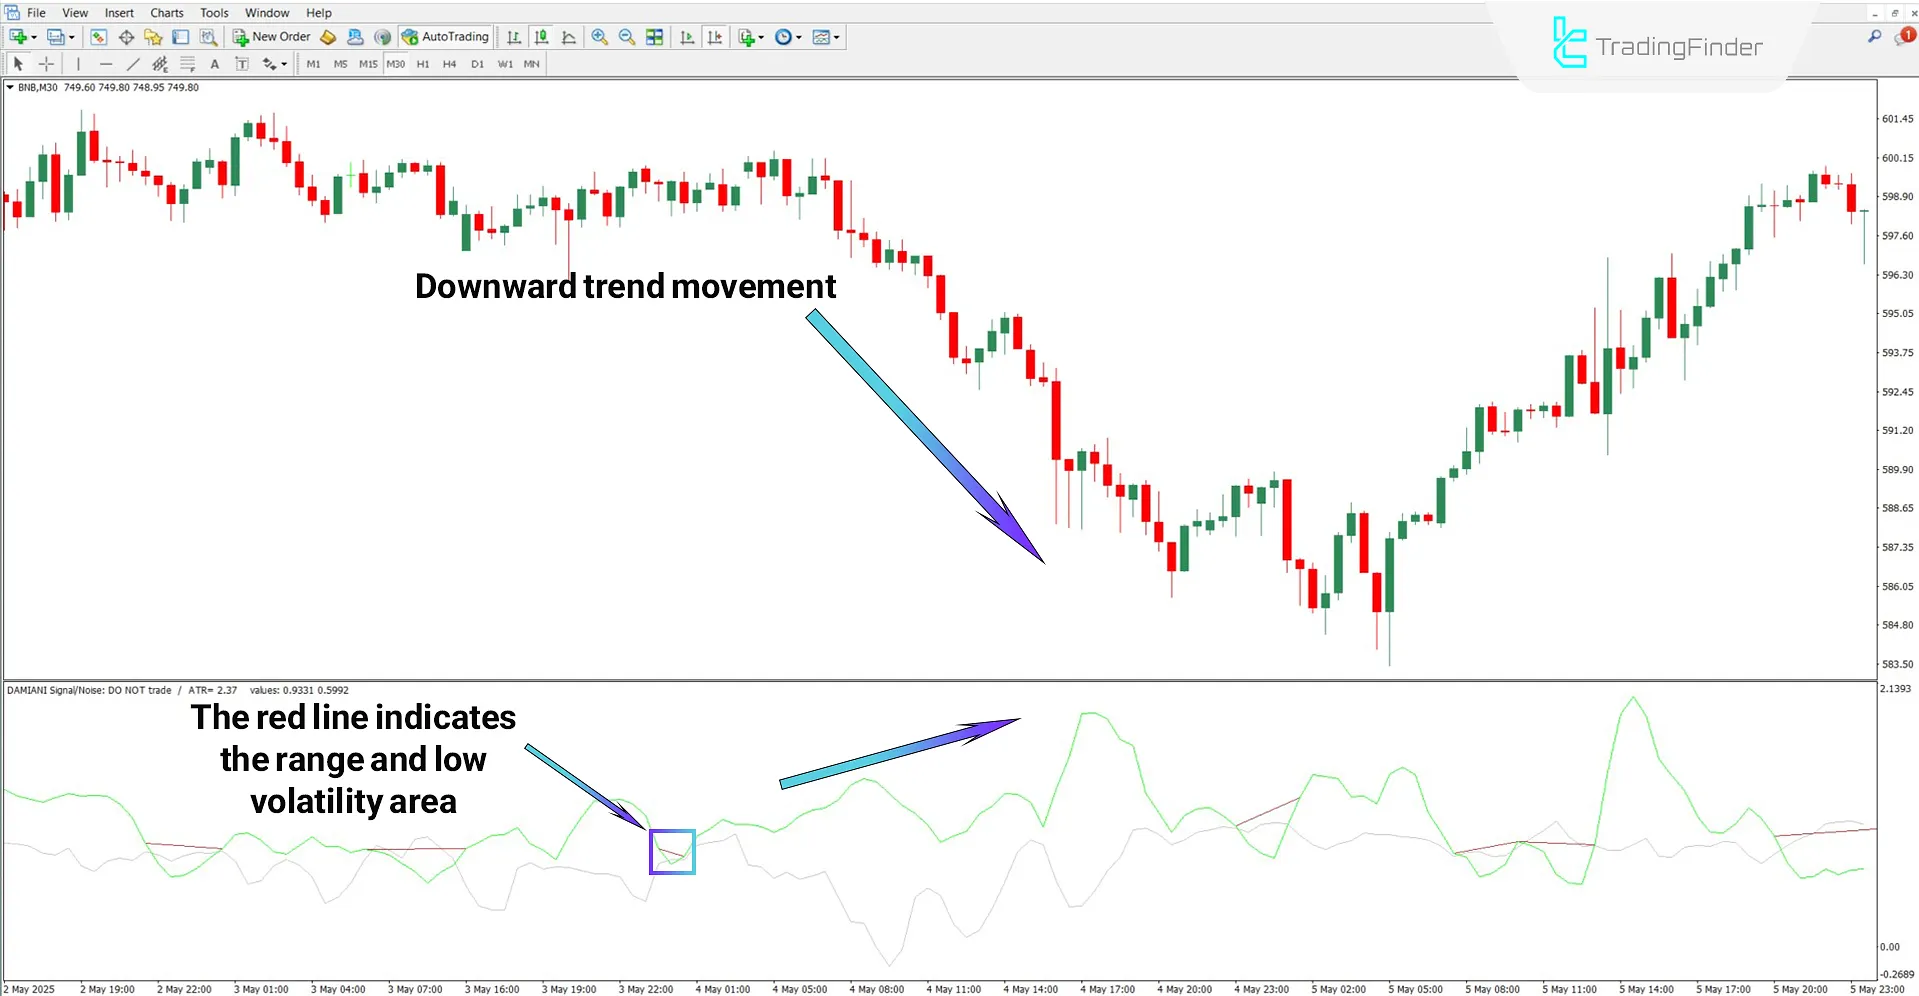
In the Damiani Voltameter indicator, whenever the green line is above the gray line, the market trend is real. Whenever the gray line is above the green, the market is low volatility.
Additionally, this indicator uses a horizontal red line to mark areas of low volatility and a ranging price.
Uptrend Conditions
Based on the USD/CAD one-hour chart, the gray line is above the green line, and the indicator identifies the range area with the red line.
As shown, as soon as the green line rises above, the trend also becomes bullish.

Downtrend Conditions
According to the Binance Coin (BNB) cryptocurrency 30-minute chart, the volatility line crosses the gray line and moves above it.
In this situation, due to the price’s inclination toward lower levels, the price breaks the range downward, and the trend turns bearish.

Settings of the Damiani Volatmeter (Voltameter) Oscillator
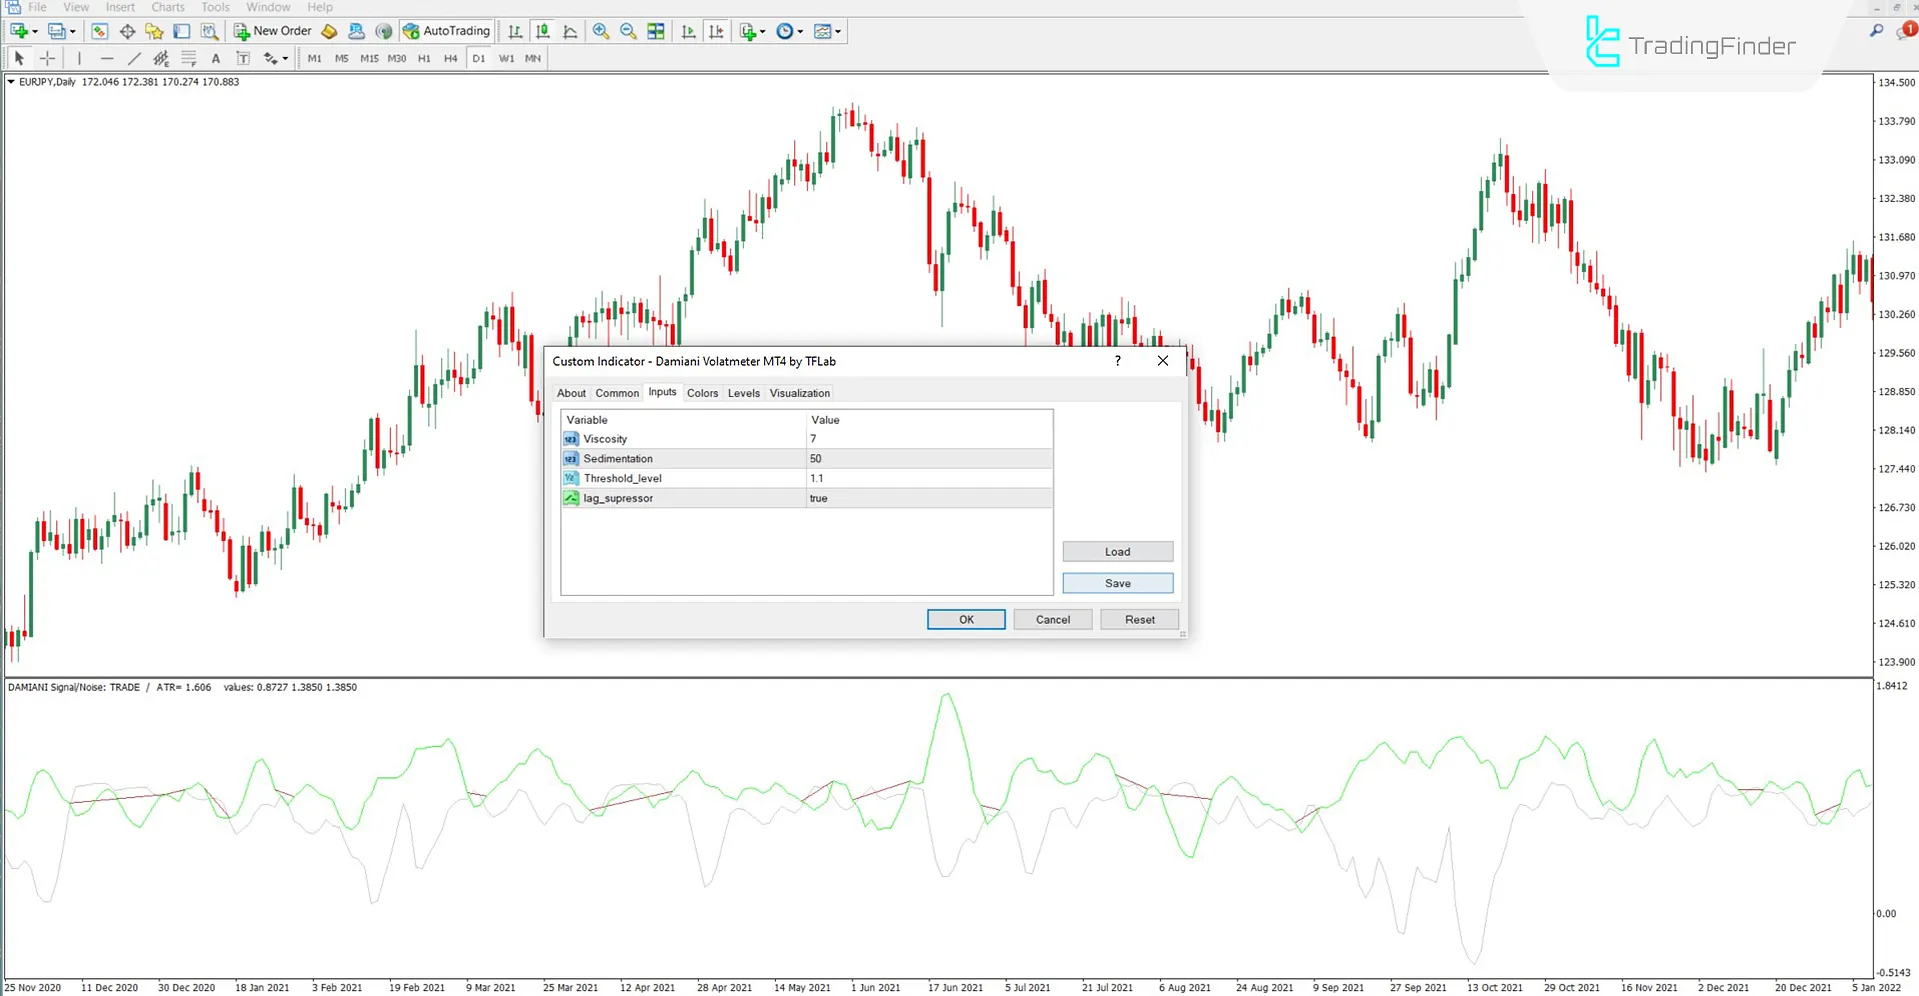
Settings of Damiani Voltameter Indicator are as follows:

- Viscosity: Number of candles for market noise calculation;
- Sedimentation: Period for smoothing price fluctuations and continuous market behavior;
- Threshold_level: Threshold level for comparing volatility with noise to determine a trading signal;
- lag_supressor: Activation of the delay reduction mechanism in signal output.
Conclusion
The Damiani Volatmeter oscillator helps identify inappropriate times for trading in low-volatility and directionless markets.
This trading tool cannot generate buy and sell signals; instead, it filters out favorable and unfavorable market conditions.
Damiani Voltameter Oscillator for MT4 PDF
Damiani Voltameter Oscillator for MT4 PDF
Click to download Damiani Voltameter Oscillator for MT4 PDFWhen does this indicator identify the market as tradable?
Whenever the volatility line is above the noise line, the Damiani Volatmeter (Voltameter) oscillator identifies the market as tradable.
What is the purpose of the red line in the Damiani Volatmeter indicator?
This trading tool highlights the increase in the noise line over the volatility line by drawing a red line.


