


On July 2, 2025, in version 2, alert/notification and signal functionality was added to this indicator
The Deep Crab Harmonic Pattern Indicator is a specialized technical analysis tool that uses Fibonacci ratios and pivot points to identify harmonic patterns on charts.
Designed for the MetaTrader 4 platform, this indicator allows traders to easily recognize the Deep Crab Harmonic Pattern.
By using this tool, traders can detect market structure changes and make timely trading decisions based on pattern completion.
Deep Crab Harmonic Pattern Indicator Overview Table
Below is the general specification table for the Deep Crab Harmonic Pattern Indicator.
Indicator Categories: | Price Action MT4 Indicators Chart & Classic MT4 Indicators Harmonic MT4 Indicators |
Platforms: | MetaTrader 4 Indicators |
Trading Skills: | Advanced |
Indicator Types: | Leading MT4 Indicators Reversal MT4 Indicators Non-Repainting MT4 Indicators |
Timeframe: | Multi-Timeframe MT4 Indicators |
Trading Style: | Day Trading MT4 Indicators Intraday MT4 Indicators Scalper MT4 Indicators |
Trading Instruments: | Indices Market MT4 Indicators Stock Market MT4 Indicators Forex MT4 Indicators |
Indicator at a Glance
The Deep Crab Harmonic Pattern Indicator is an excellent tool for traders looking to identify this harmonic pattern on the price chart.
By drawing lines and highlighting key pattern points, the indicator simplifies the pattern recognition process and enables traders to perform more professional and accurate chart analyses.
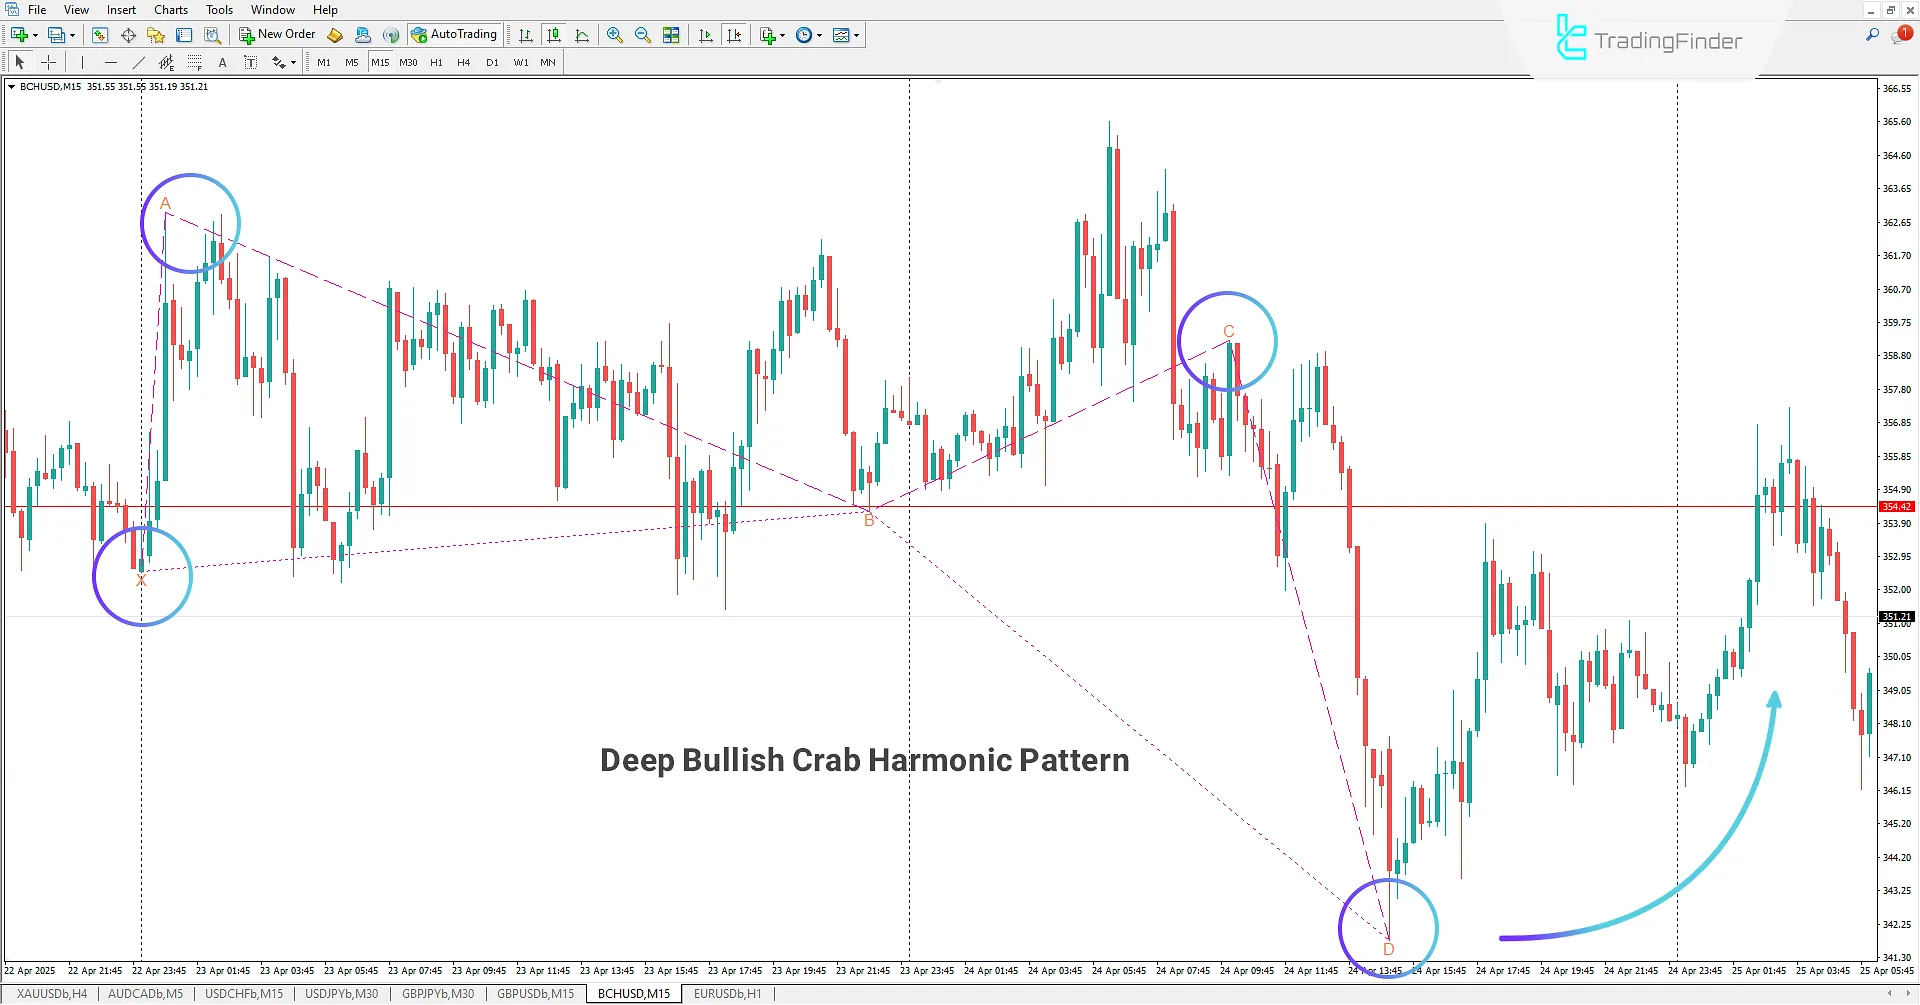
Bullish Pattern
On the 15-minute chart of BCHUSD, a Deep Crab Harmonic Pattern has formed.
The indicator identifies this pattern and displays potential reversal zones (PRZ) and pattern points by drawing lines.
Traders can enter a buy position once the pattern forms and the PRZ is identified.
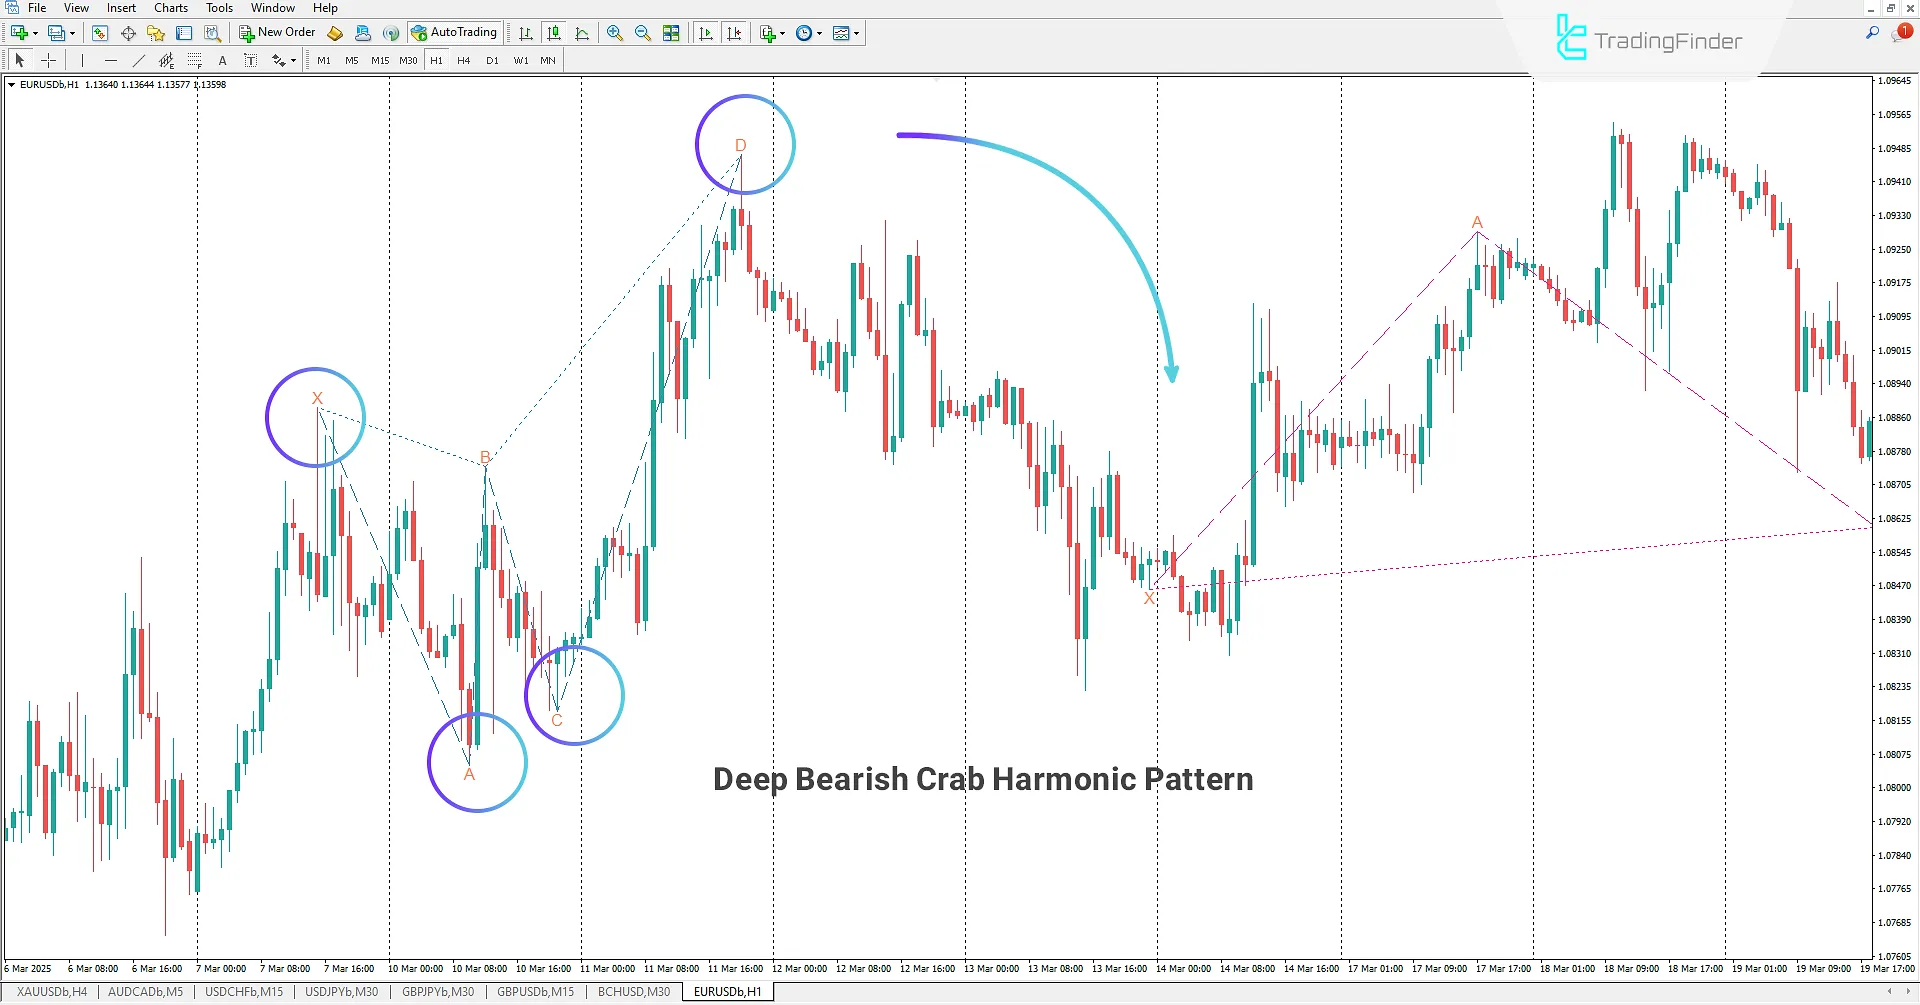
Bearish Pattern
On the 1-hour chart of the EURUSD currency pair, the indicator has identified a Bearish Deep Crab Harmonic Pattern by analyzing price behavior, pivot points, and Fibonacci ratios.
The indicator displays the pattern structure on the chart, showing potential trading opportunities and trend reversal areas.
After identifying the PRZ, traders can enter a sell position.
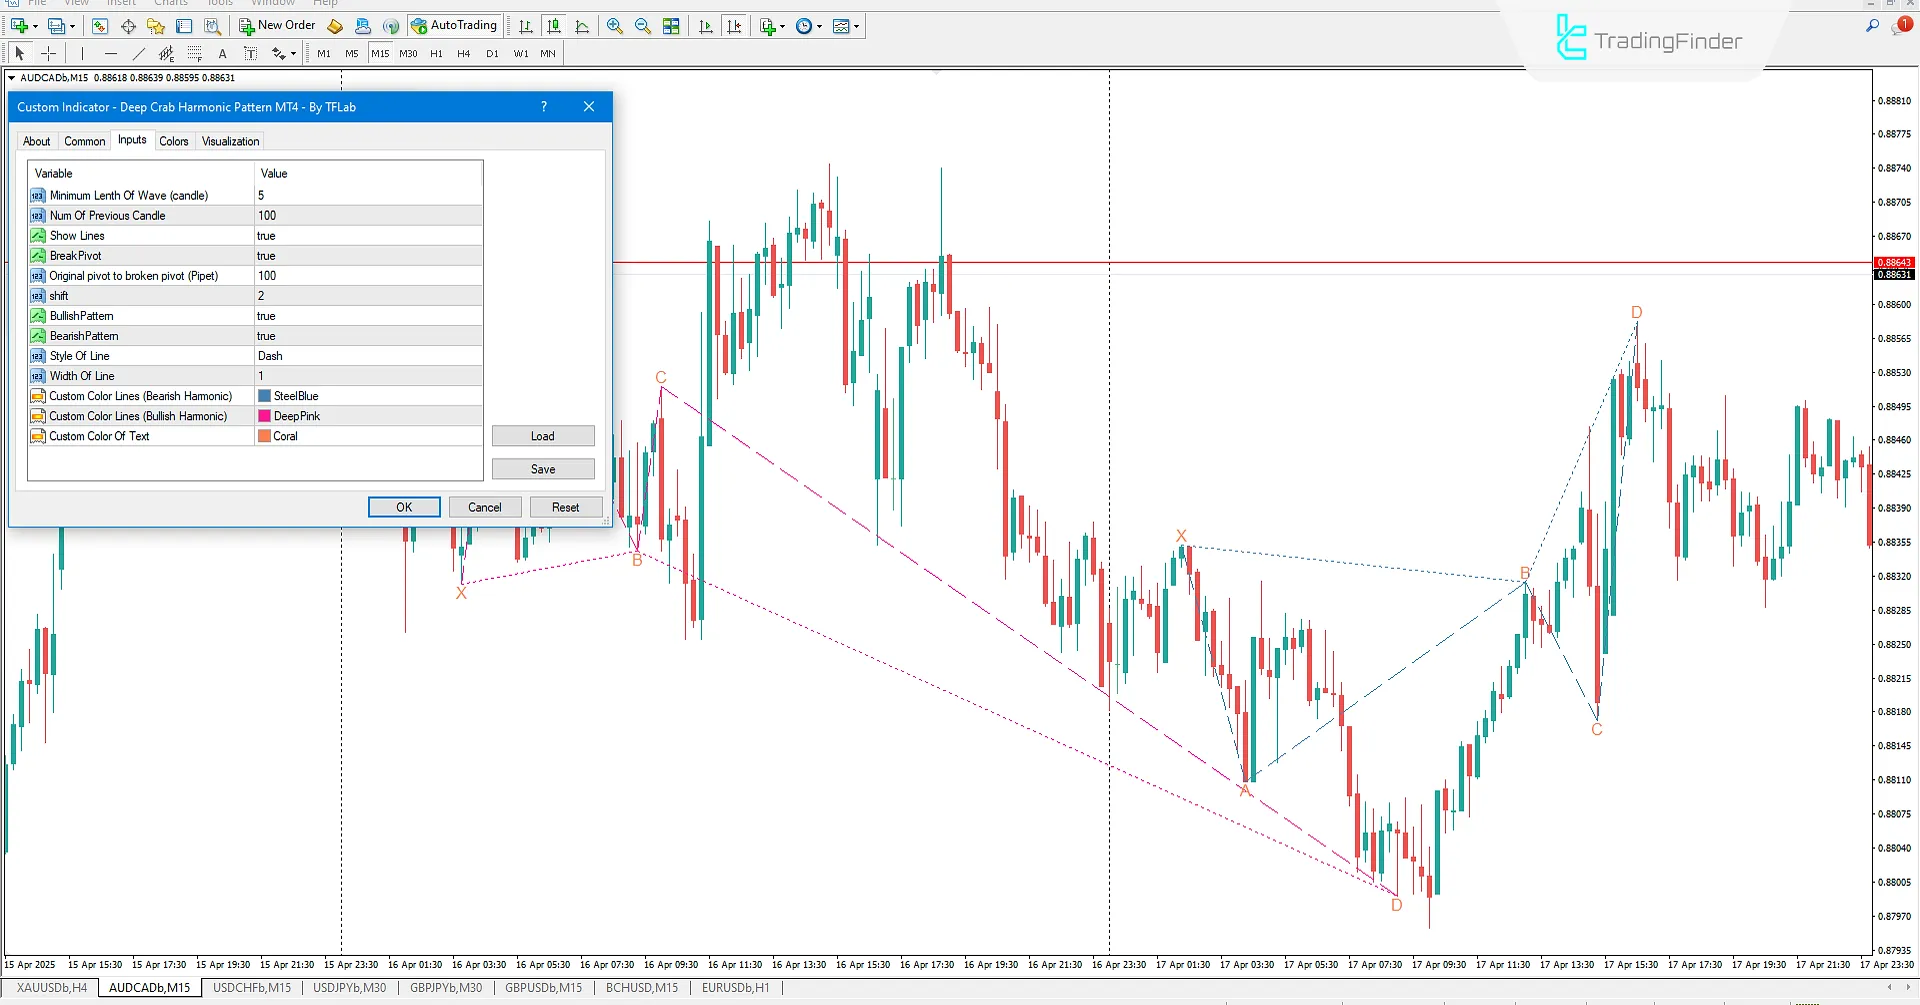
Deep Crab Harmonic Pattern Indicator Settings
Below are the settings for the Deep Crab Harmonic Pattern Indicator:
- Minimum Length Of Wave (Candle): Set the minimum wave length (based on the number of candles);
- Num Of Previous Candle: Set the number of previous candles for market analysis;
- Show Lines: Enable/disable pattern line display;
- Break Pivot: Enable pivot break analysis;
- Original Pivot to Broken Pivot (Pipet): Set the distance (in pipettes) between the original pivot and broken pivot;
- Shift: Adjust the horizontal shift of the lines;
- Bullish Pattern: Enable bullish pattern display;
- Bearish Pattern: Enable bearish pattern display;
- Style Of Line: Select line style;
- Width Of Line: Set line thickness;
- Custom Color Lines (Bearish Harmonic): Set color for bearish pattern lines;
- Custom Color Lines (Bullish Harmonic): Set color for bullish pattern lines;
- Custom Color Of Text: Set the color of explanatory text on the chart.
Conclusion
The Deep Crab Harmonic Pattern Indicator is a specialized tool for identifying harmonic patterns on price charts.
By detecting the Deep Crab Harmonic Pattern, the indicator enables traders to recognize market structure changes and price reversals, and enter buy or sell positions based on identified opportunities.
Deep Crab Harmonic Pattern MT4 PDF
Deep Crab Harmonic Pattern MT4 PDF
Click to download Deep Crab Harmonic Pattern MT4 PDFWhat is the Deep Crab Harmonic Pattern Indicator?
It is a specialized technical analysis tool that identifies the Deep Crab Harmonic Pattern on charts using Fibonacci ratios and pivot points.
How does the Deep Crab Harmonic Pattern Indicator work?
The tool simplifies the process of identifying the Deep Crab pattern by drawing lines and highlighting key pattern points, allowing traders to detect market structure changes effectively.


