![DeMark Trend Lines Indicator for MetaTrader 4 Download - [TradingFinder]](https://cdn.tradingfinder.com/image/338935/2-51-en-demark-trend-lines-mt4-1.webp)
![DeMark Trend Lines Indicator for MetaTrader 4 Download - [TradingFinder] 0](https://cdn.tradingfinder.com/image/338935/2-51-en-demark-trend-lines-mt4-1.webp)
![DeMark Trend Lines Indicator for MetaTrader 4 Download - [TradingFinder] 1](https://cdn.tradingfinder.com/image/338934/2-51-en-demark-trend-lines-mt4-2png.webp)
![DeMark Trend Lines Indicator for MetaTrader 4 Download - [TradingFinder] 2](https://cdn.tradingfinder.com/image/338933/2-51-en-demark-trend-lines-mt4-3.webp)
![DeMark Trend Lines Indicator for MetaTrader 4 Download - [TradingFinder] 3](https://cdn.tradingfinder.com/image/338936/2-51-en-demark-trend-lines-mt4-4.webp)
The DeMark Trend Lines Indicator is one of the Technical analysis available in the MetaTrader 4 platform that identifies the general market direction by drawing dynamic trend lines.
This MT4 Pivot Point and Fractal-based indicator is designed solely to detect dominant trends and reversal points.
When the price breaks or bounces off one of the trend lines (red or blue), these reactions can be used as entry signals for buy or sell trades.
DeMark Trend Lines Specification Table
The features of the DeMark Trend Lines Indicator are summarized in the following table.
Indicator Categories: | Pivot Points & Fractals MT4 Indicators Trading Assist MT4 Indicators Levels MT4 Indicators |
Platforms: | MetaTrader 4 Indicators |
Trading Skills: | Intermediate |
Indicator Types: | Breakout MT4 Indicators |
Timeframe: | Multi-Timeframe MT4 Indicators |
Trading Style: | Intraday MT4 Indicators |
Trading Instruments: | Forward Market MT4 Indicators Stock Market MT4 Indicators Cryptocurrency MT4 Indicators Forex MT4 Indicators |
Uptrend Conditions
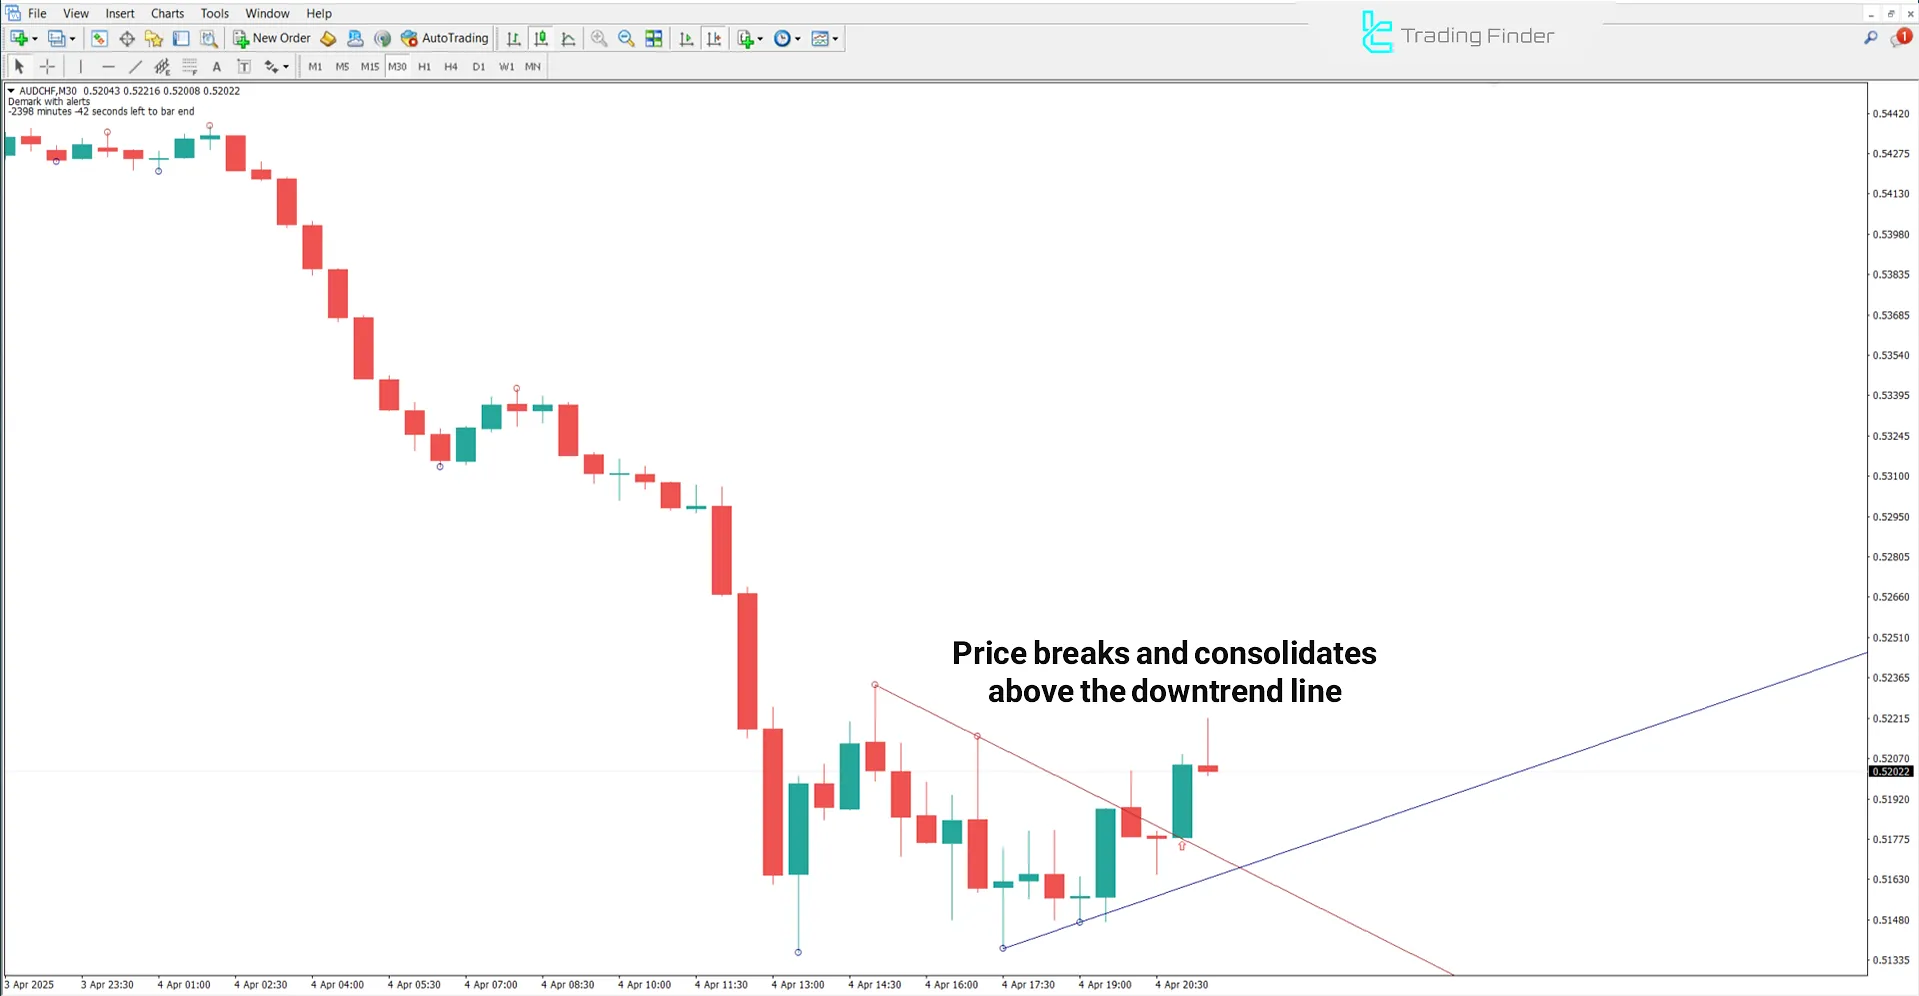
The following chart shows the AUD/CHF currency pair on a 30-minute timeframe.
When the price breaks above the downward trend line (red line) and consolidates above it especially if this breakout aligns with the prevailing market trend it increases the likelihood of a trend reversal or structural shift in market movement.

Downtrend Conditions
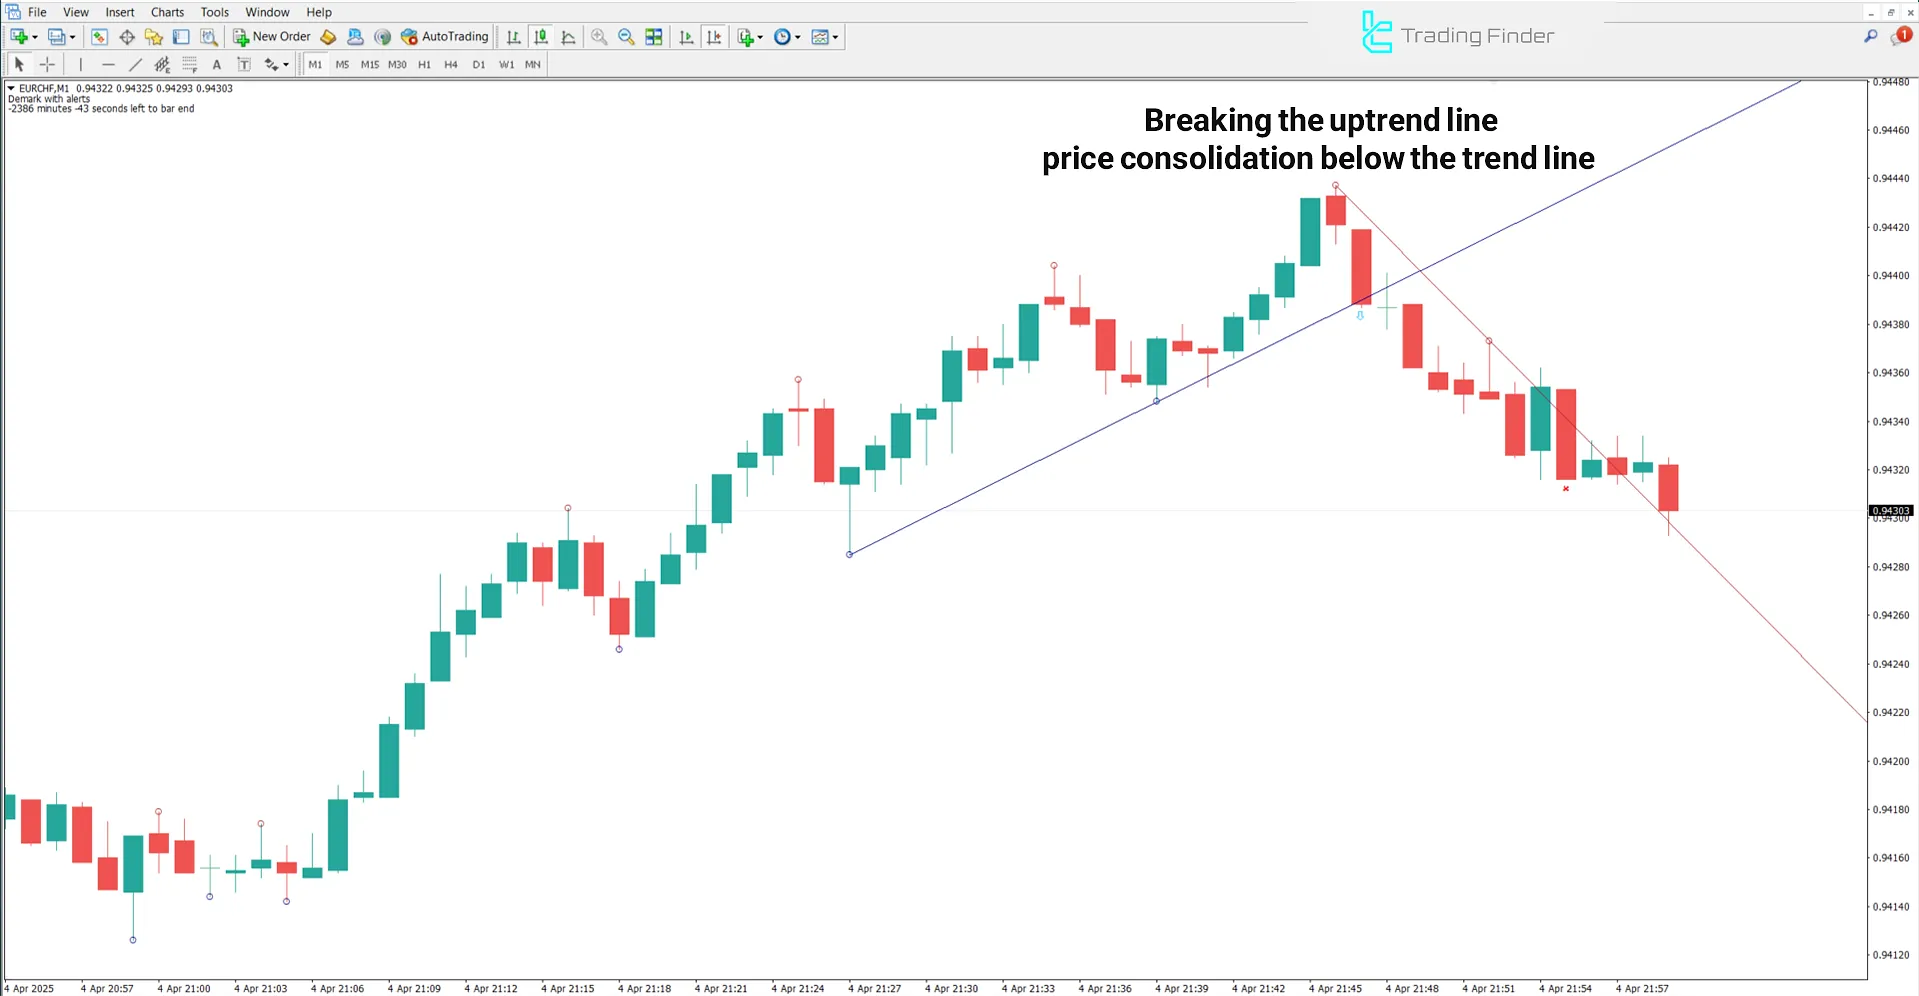
The EUR/CHF pair on a 1-minute timeframe presents a notable signal of market structure change after forming a recent pivot and breaking the upward trend line.
Following the breakdown of the upward trend line (blue line) and price stabilization below it, combined with alignment to the overall bearish trend, the probability of a continuation of the downward move increases.

Indicator Settings
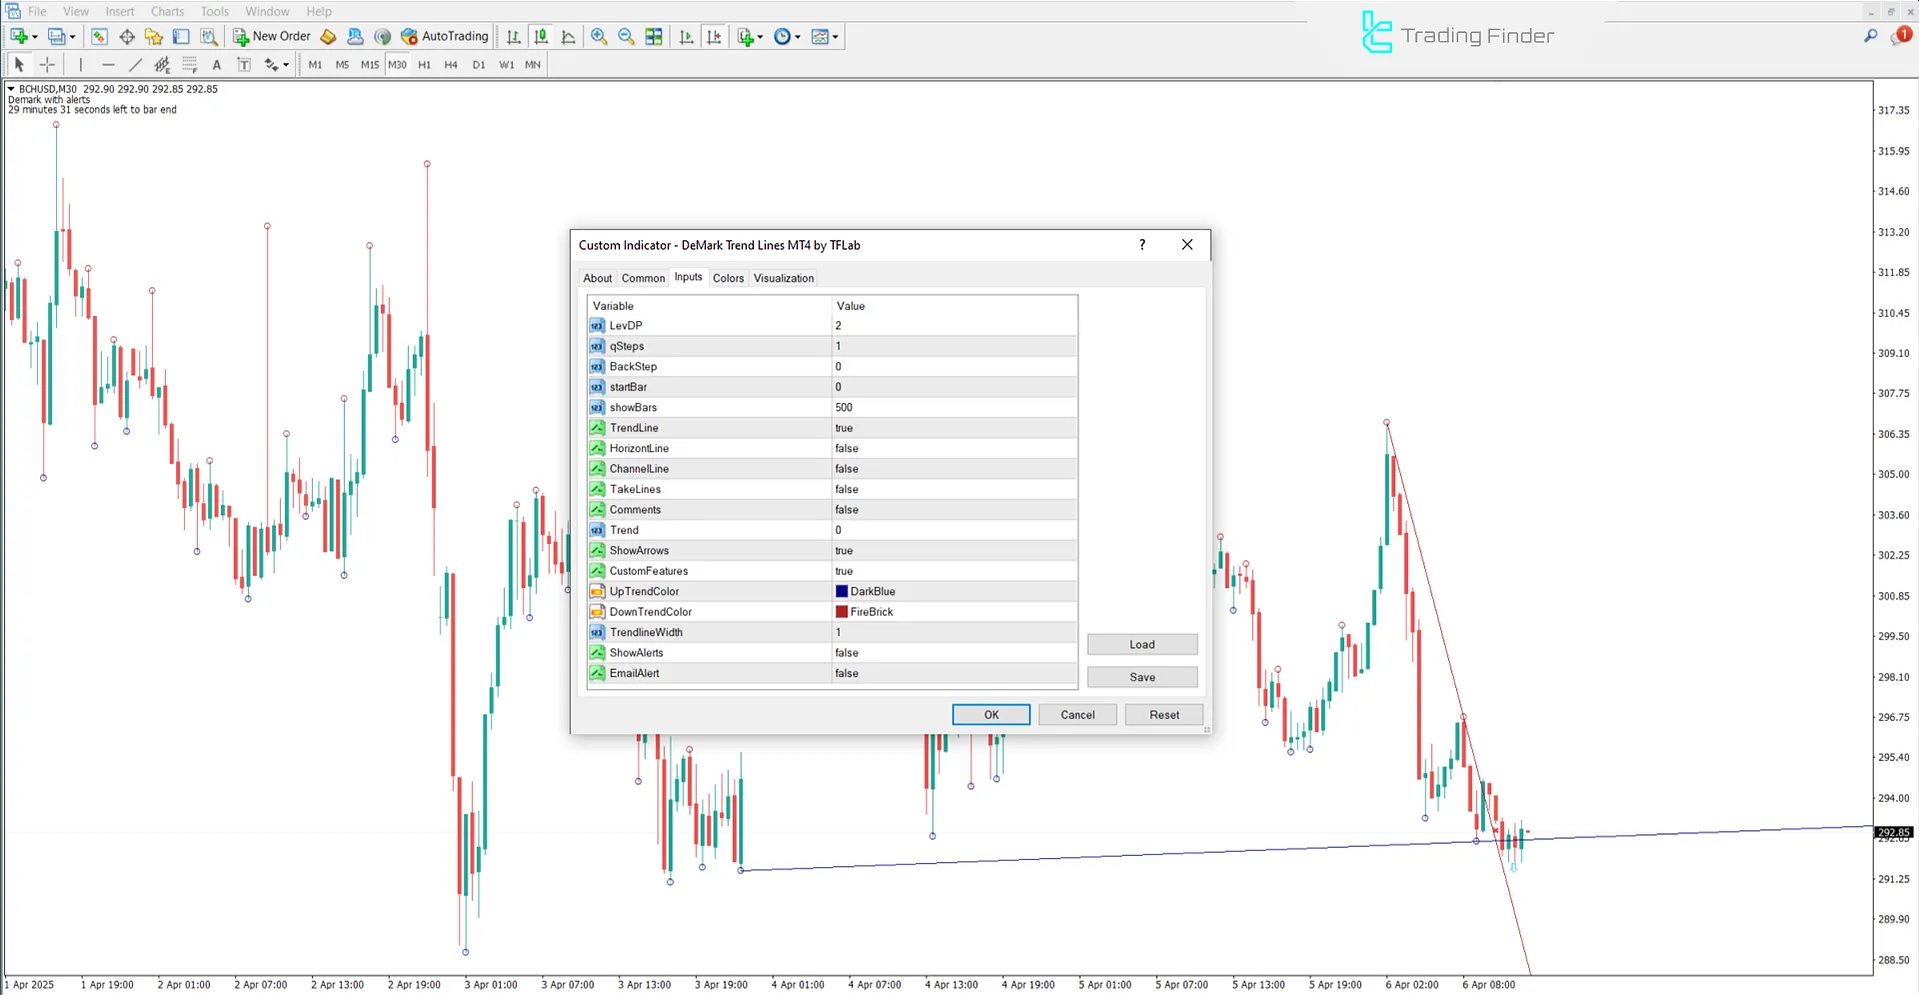
The image below displays the adjustable parameters of the DeMark Trend Lines Indicator:

- LevDP: Sensitivity level of trend lines based on high/low points
- Q Steps: Number of steps to construct the trend structure
- Back Step: Number of candles to look back for comparison
- Start Bar: Initial candle to begin drawing the indicator
- Show Bars: Number of candles to be calculated and drawn
- Trend Line: Display Trendline
- Horizont Line: Disable horizontal lines
- Channel Line: Price channel lines
- Take Lines: Take profit marker lines
- Comments: Text annotations
- Trend: Trend direction
- Show Arrows: Display signal arrows
- Custom Features: Custom features
- Up Trend Color: Color of upward trend lines
- Down Trend Color: Color of downward trend lines
- Trend line Width: Width of trend lines
- Show Alerts: Show alerts
- Email Alert: Email notification alert
Conclusion
The DeMark Trend Lines Indicator is a powerful tool for trend analysis and identifying key market levels like Forex. It is designed to detect trends, support and resistance levels, and market reversal points.
By drawing diagonal and horizontal lines, this indicator defines the price structure using pivot points and trend lines.
DeMark Trend Lines MT4 PDF
DeMark Trend Lines MT4 PDF
Click to download DeMark Trend Lines MT4 PDFOn what basis does the DeMark Trend Lines Indicator draw trend lines?
This trading tool draws diagonal and horizontal lines based on the last two highs and two lows on the chart.
Can the DeMark Trend Lines Indicator detect breakouts?
Yes, breakouts can be identified when price breaks above or below the levels drawn by the indicator.


