


![Diamond Pattern Indicator for MetaTrader4 Download - free - [TradingFinder]](https://cdn.tradingfinder.com/image/106667/10-19-en-diamond-pattern-mt4.webp)
![Diamond Pattern Indicator for MetaTrader4 Download - free - [TradingFinder] 1](https://cdn.tradingfinder.com/image/31098/10-19-en-diamond-pattern-mt4-02.avif)
![Diamond Pattern Indicator for MetaTrader4 Download - free - [TradingFinder] 2](https://cdn.tradingfinder.com/image/31102/10-19-en-diamond-pattern-mt4-03.avif)
![Diamond Pattern Indicator for MetaTrader4 Download - free - [TradingFinder] 3](https://cdn.tradingfinder.com/image/31113/10-19-en-diamond-pattern-mt4-04.avif)
The Diamond Pattern Indicator is an indicator in MetaTrader 4 Indicators that automatically identifies one of the most commonly used technical analysis patterns, the Diamond Pattern, on price charts.
This pattern, which can appear in both Bullish and Bearish forms, helps identify Reversal Points on the chart and can indicate a change in the price trend.
The diamond pattern consists of four trendlines: two upper lines that act as resistance and two lower lines that act as support.
Indicator Table
Indicator Categories: | Signal & Forecast MT4 Indicators Chart & Classic MT4 Indicators Candle Sticks MT4 Indicators |
Platforms: | MetaTrader 4 Indicators |
Trading Skills: | Intermediate |
Indicator Types: | Entry and Exit MT4 Indicators Reversal MT4 Indicators |
Timeframe: | Multi-Timeframe MT4 Indicators |
Trading Style: | Day Trading MT4 Indicators Intraday MT4 Indicators Swing Trading MT4 Indicators |
Trading Instruments: | Share Stocks MT4 Indicators Indices Market MT4 Indicators Commodity Market MT4 Indicators Stock Market MT4 Indicators Cryptocurrency MT4 Indicators Forex MT4 Indicators |
Overview
The Diamond Pattern Indicator identifies one of the most widely used and recurring patterns on price charts, which is very similar to the Head & Shoulders pattern and can provide suitable Entry-Exit points.
It is also beneficial for optimizing risk management and trading in line with solid trends in various markets. This indicator automatically identifies patterns where price compression has occurred, forming a diamond shape, and presents them to traders.
Buy Signal Conditions
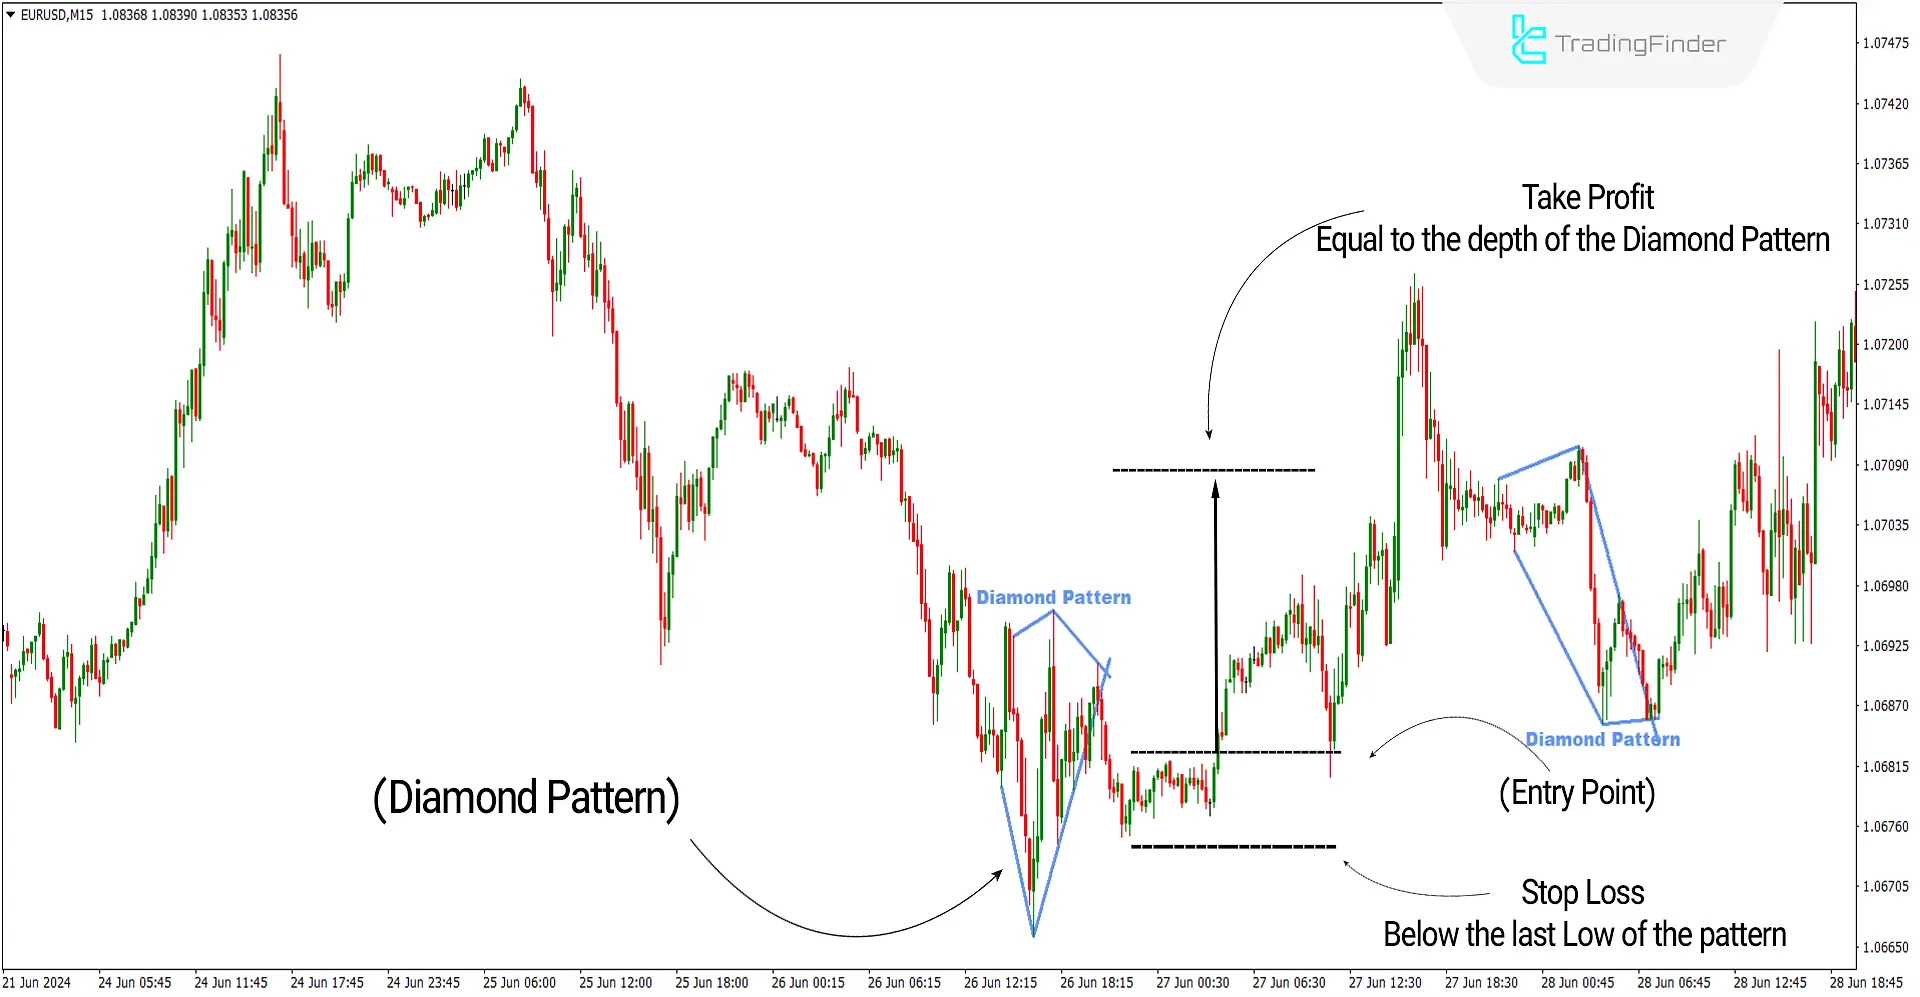
The chart below displays the EUR/USD (EURUSD) currency pair over a 15-minute timeframe. The Bullish Diamond Pattern forms at the end of a downtrend, indicating a reversal of that trend. The formation of the diamond pattern indicates price compression and trading between buyers and sellers.
A trend reversal can be expected after breaking above the resistance level (upper trendline). For confirmation, this breakout must be accompanied by increased trading volume. After confirming the breakout, you can enter a buy trade. The entry point is usually at the breakout level of the pattern's upper trendline.
Take Profit and Stop Loss for the Cup and Handle Pattern
You can set your stop loss slightly below the last low to manage risk. To determine the take profit, calculate the distance between the diamond's lowest point and the pattern's upper trendline (the diamond's depth) and add this distance to the breakout level.
Sell Signal Conditions
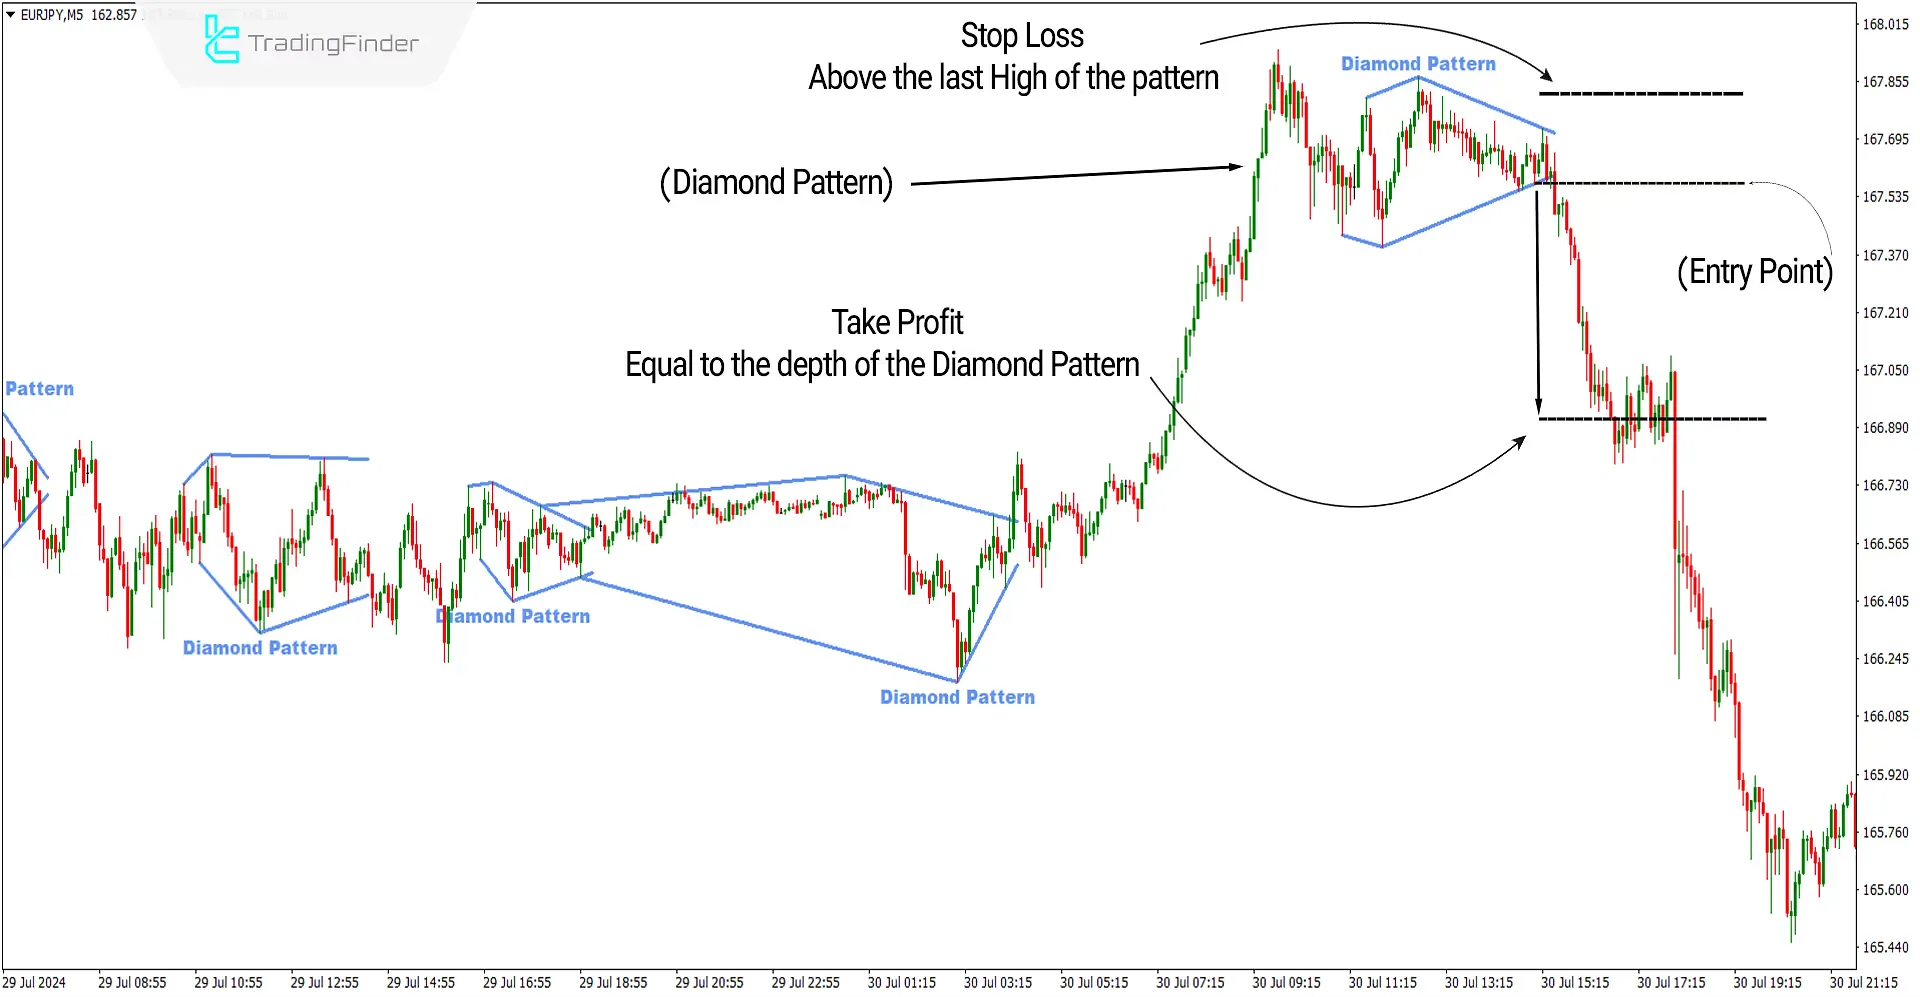
The chart below shows the EUR to JPY (EURJPY) currency pair in a 5-minute timeframe. The Bearish Diamond Pattern forms at the end of an uptrend, indicating a reversal of that trend. The formation of the diamond pattern indicates price compression and trading between buyers and sellers.
A trend reversal can be expected after breaking the support level (lower trendline) below. For confirmation, this breakout must be accompanied by increased trading volume. After confirming the breakout, you can enter a Sell trade. The entry point is usually at the breakout level of the lower trendline of the pattern.
Take Profit and Stop Loss for the Reversal Cup and Handle Pattern
To manage risk, you can set your stop loss slightly above the last high of the pattern. To determine the take profit, calculate the distance between the diamond's highest point and the pattern's lower trendline (the diamond's depth) and add this distance to the breakout level.
Diamond Pattern Indicator Settings
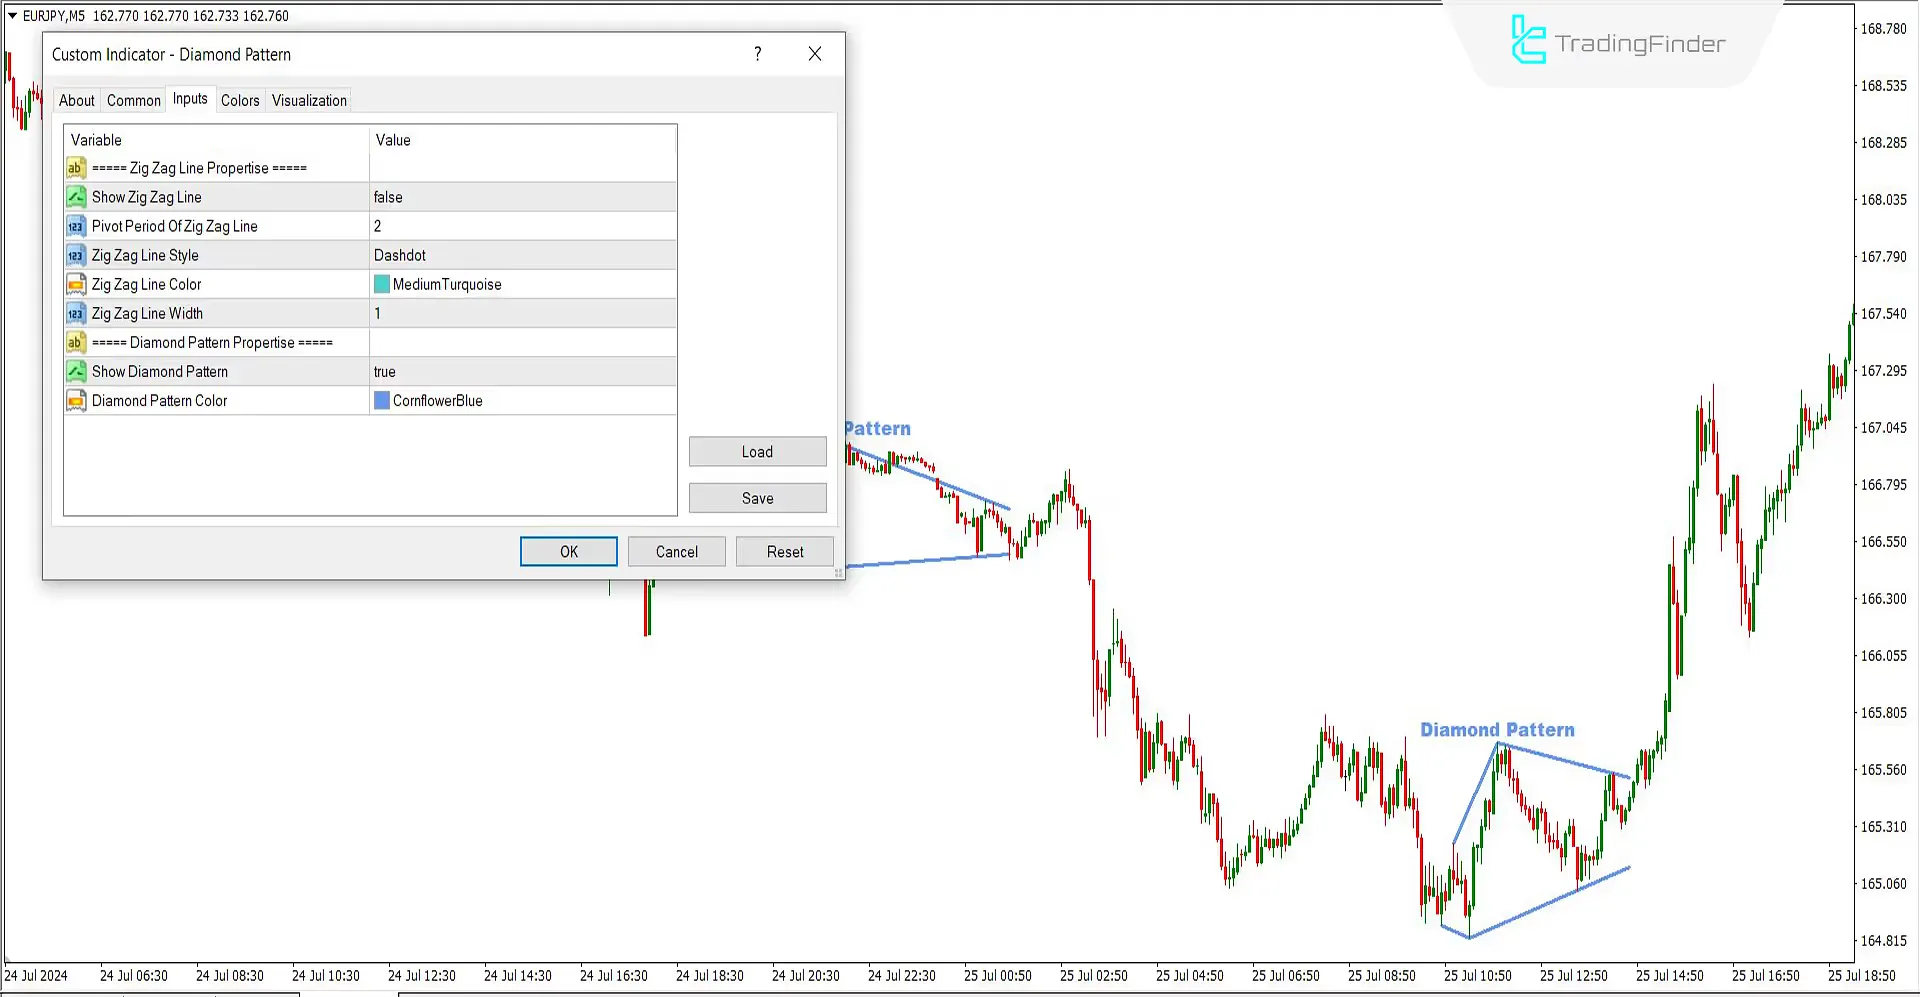
- Zig Zag Line Properties:
- Show Zig Zag Line: Set to true to display the Zig Zag line
- Pivot Period of Zig Zag Line: The Zig Zag line period is set to 2
- Zig Zag Line Style: Displayed as a Dashdot line
- Zig Zag Line Color: Blue, customizable
- Zig Zag Line Width: Set to 1
- Diamond Pattern Properties:
- Show Diamond Pattern: Set to true to display the pattern
- Diamond Pattern Color: Dark Blue
Conclusion
The Diamond Pattern Indicator is a powerful tool in Technical Analysis that helps traders identify suitable trading opportunities.
For more effective use and better trading results, you can determine the price trend in higher timeframes and trade when the overall trend aligns with the diamond pattern.
Also, various technical analysis tools, such as MetaTrader 4 Buy Sell Pressure indicators, should be used for further confirmation.
Diamond Pattern MT4 PDF
Diamond Pattern MT4 PDF
Click to download Diamond Pattern MT4 PDFHow does the Diamond Pattern Indicator work?
How does the Diamond Pattern Indicator work?
What is the breakout strategy in the Diamond Pattern?
Entering a trade should occur when the price exits the pattern, confirmed by an increase in trading volume.


