![Didi Index Indicator for MT4 Download – Free – [TradingFinder]](https://cdn.tradingfinder.com/image/524682/13-203-en-didi-index-mt4-01.webp)
![Didi Index Indicator for MT4 Download – Free – [TradingFinder] 0](https://cdn.tradingfinder.com/image/524682/13-203-en-didi-index-mt4-01.webp)
![Didi Index Indicator for MT4 Download – Free – [TradingFinder] 1](https://cdn.tradingfinder.com/image/524681/13-203-en-didi-index-mt4-02.webp)
![Didi Index Indicator for MT4 Download – Free – [TradingFinder] 2](https://cdn.tradingfinder.com/image/524683/13-203-en-didi-index-mt4-03.webp)
![Didi Index Indicator for MT4 Download – Free – [TradingFinder] 3](https://cdn.tradingfinder.com/image/524685/13-203-en-didi-index-mt4-04.webp)
The Didi Index indicator, using two oscillating lines (green and yellow), displays changes in trend strength. Additionally, this trading tool features a middle line that serves as a baseline or equilibrium level.
The variations of these lines relative to one another and their positions in relation to the middle line form the foundation for analysis and trading decisions.
Didi Index Indicator Specifications Table
The specifications of the Didi Index indicator are provided in the table below:
Indicator Categories: | Oscillators MT4 Indicators Signal & Forecast MT4 Indicators Currency Strength MT4 Indicators |
Platforms: | MetaTrader 4 Indicators |
Trading Skills: | Elementary |
Indicator Types: | Reversal MT4 Indicators |
Timeframe: | Multi-Timeframe MT4 Indicators |
Trading Style: | Day Trading MT4 Indicators Scalper MT4 Indicators Swing Trading MT4 Indicators |
Trading Instruments: | Share Stocks MT4 Indicators Indices Market MT4 Indicators Commodity Market MT4 Indicators Stock Market MT4 Indicators Cryptocurrency MT4 Indicators Forex MT4 Indicators |
Didi Index Indicator at a Glance
Trading signals in the Didi Index indicator are determined by the positions of the lines relative to the middle line; these positions are described as follows:
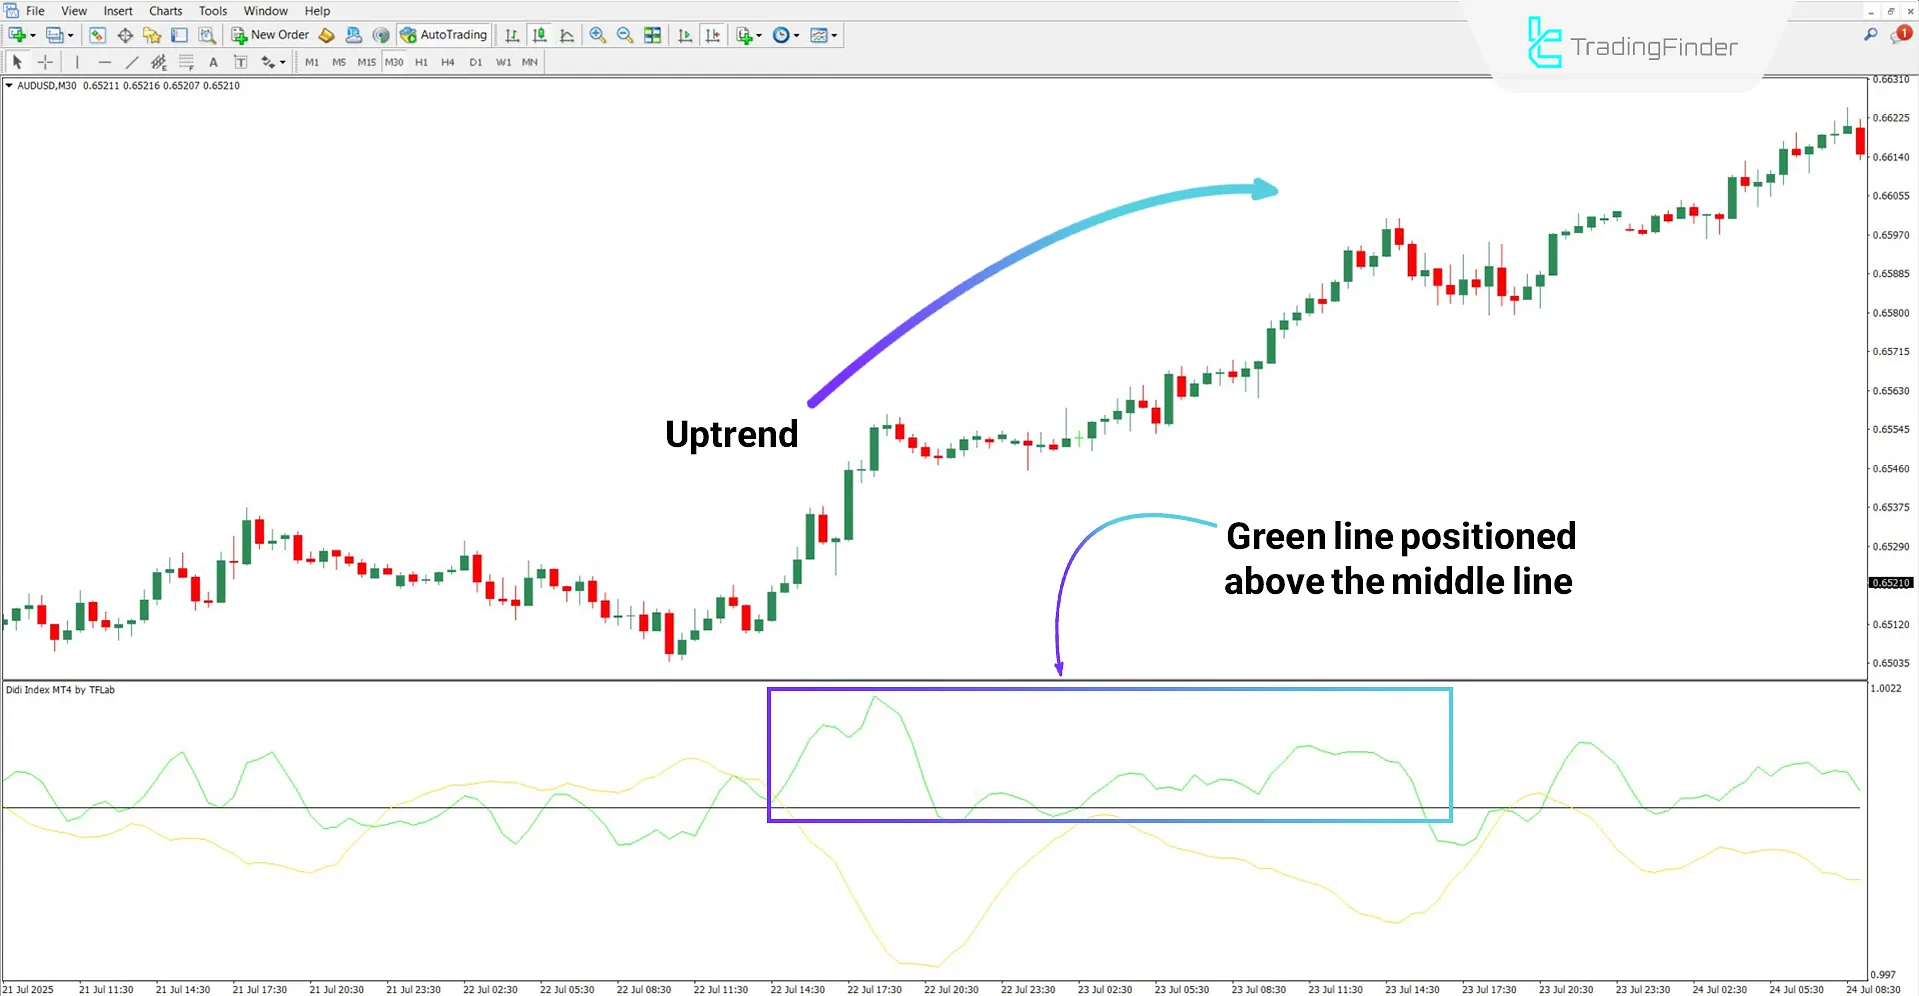
- Buy Signal: When the green line is positioned above the middle line, it indicates the formation of an upward trend;
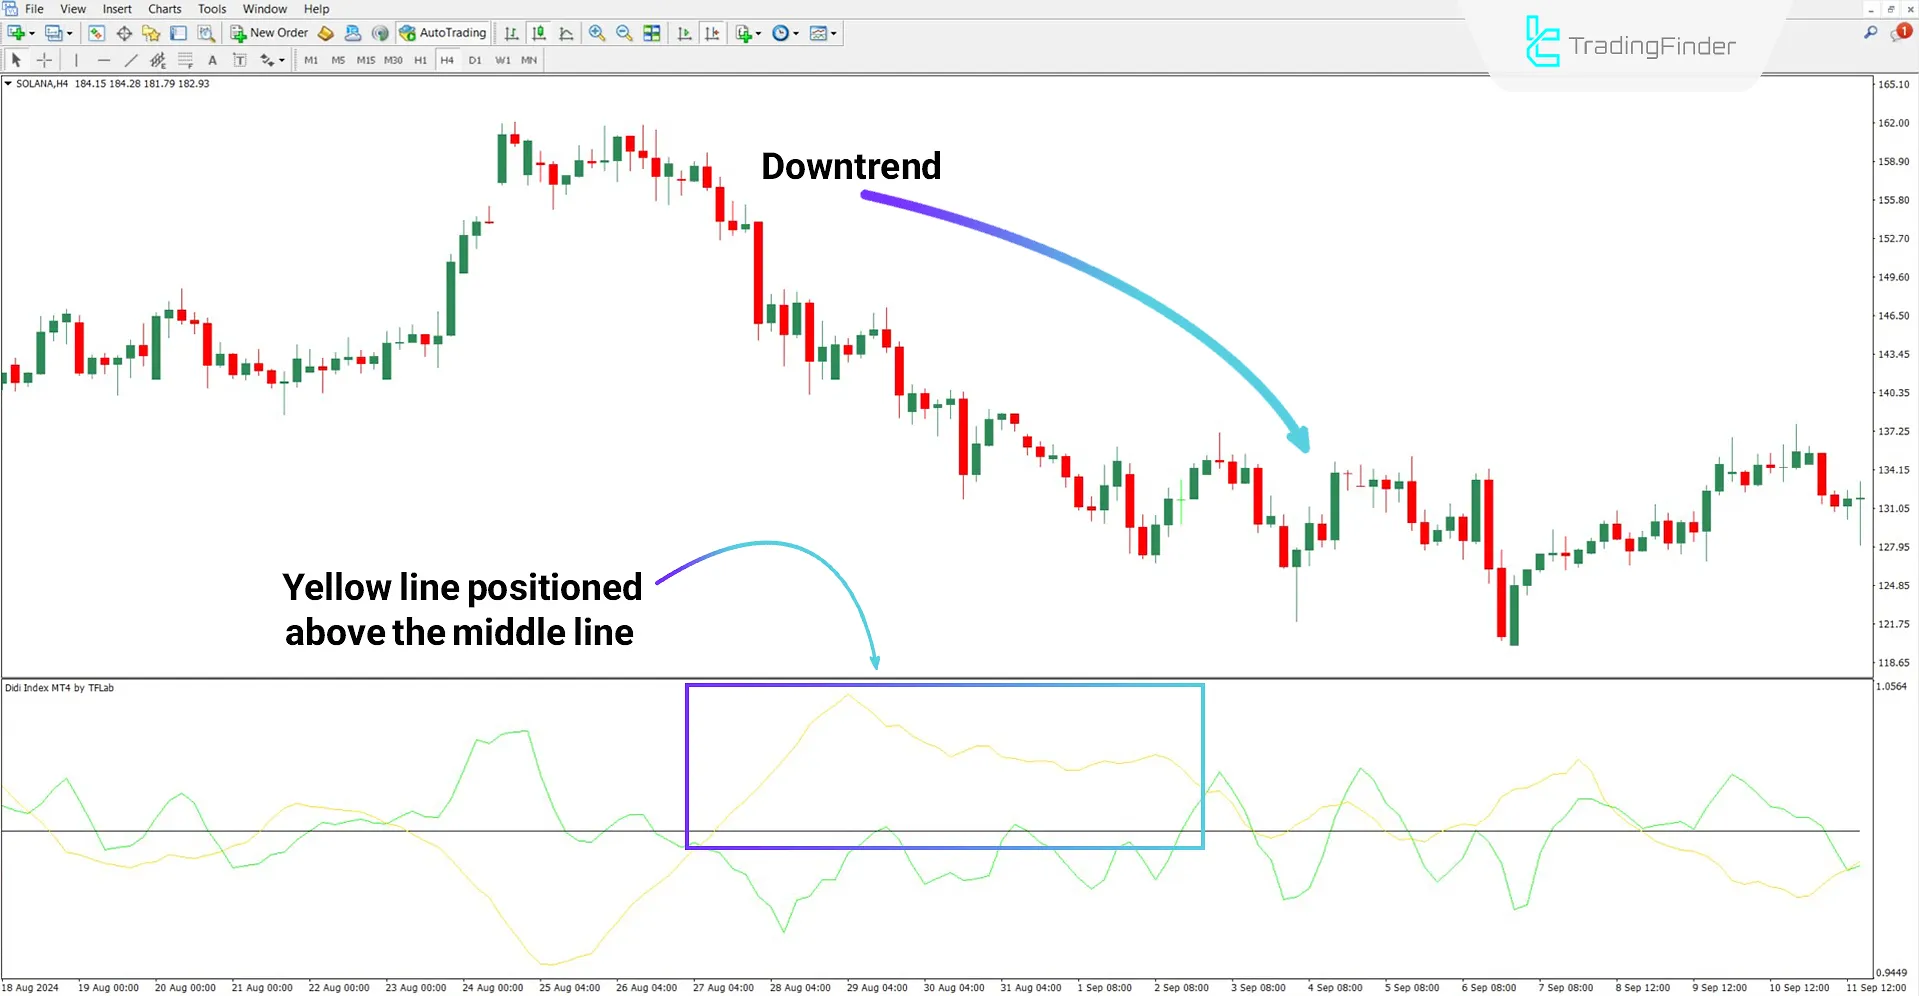
- Sell Signal: When the yellow line fluctuates in the area above the middle line, it signals a downward trend.
Uptrend Signal
Based on the 30-minute chart of AUD/USD, the green line fluctuates above the middle line.
As shown in the chart, once the green line crosses above the oscillator’s midpoint, the trend turns bullish.

Downtrend Signal
According to the 4-hour chart of Solana (SOL) cryptocurrency, the yellow line is positioned above the middle line, indicating a potential bearish trend.

Didi Index Indicator Settings
The following items relate to the settings of the Didi Index indicator:

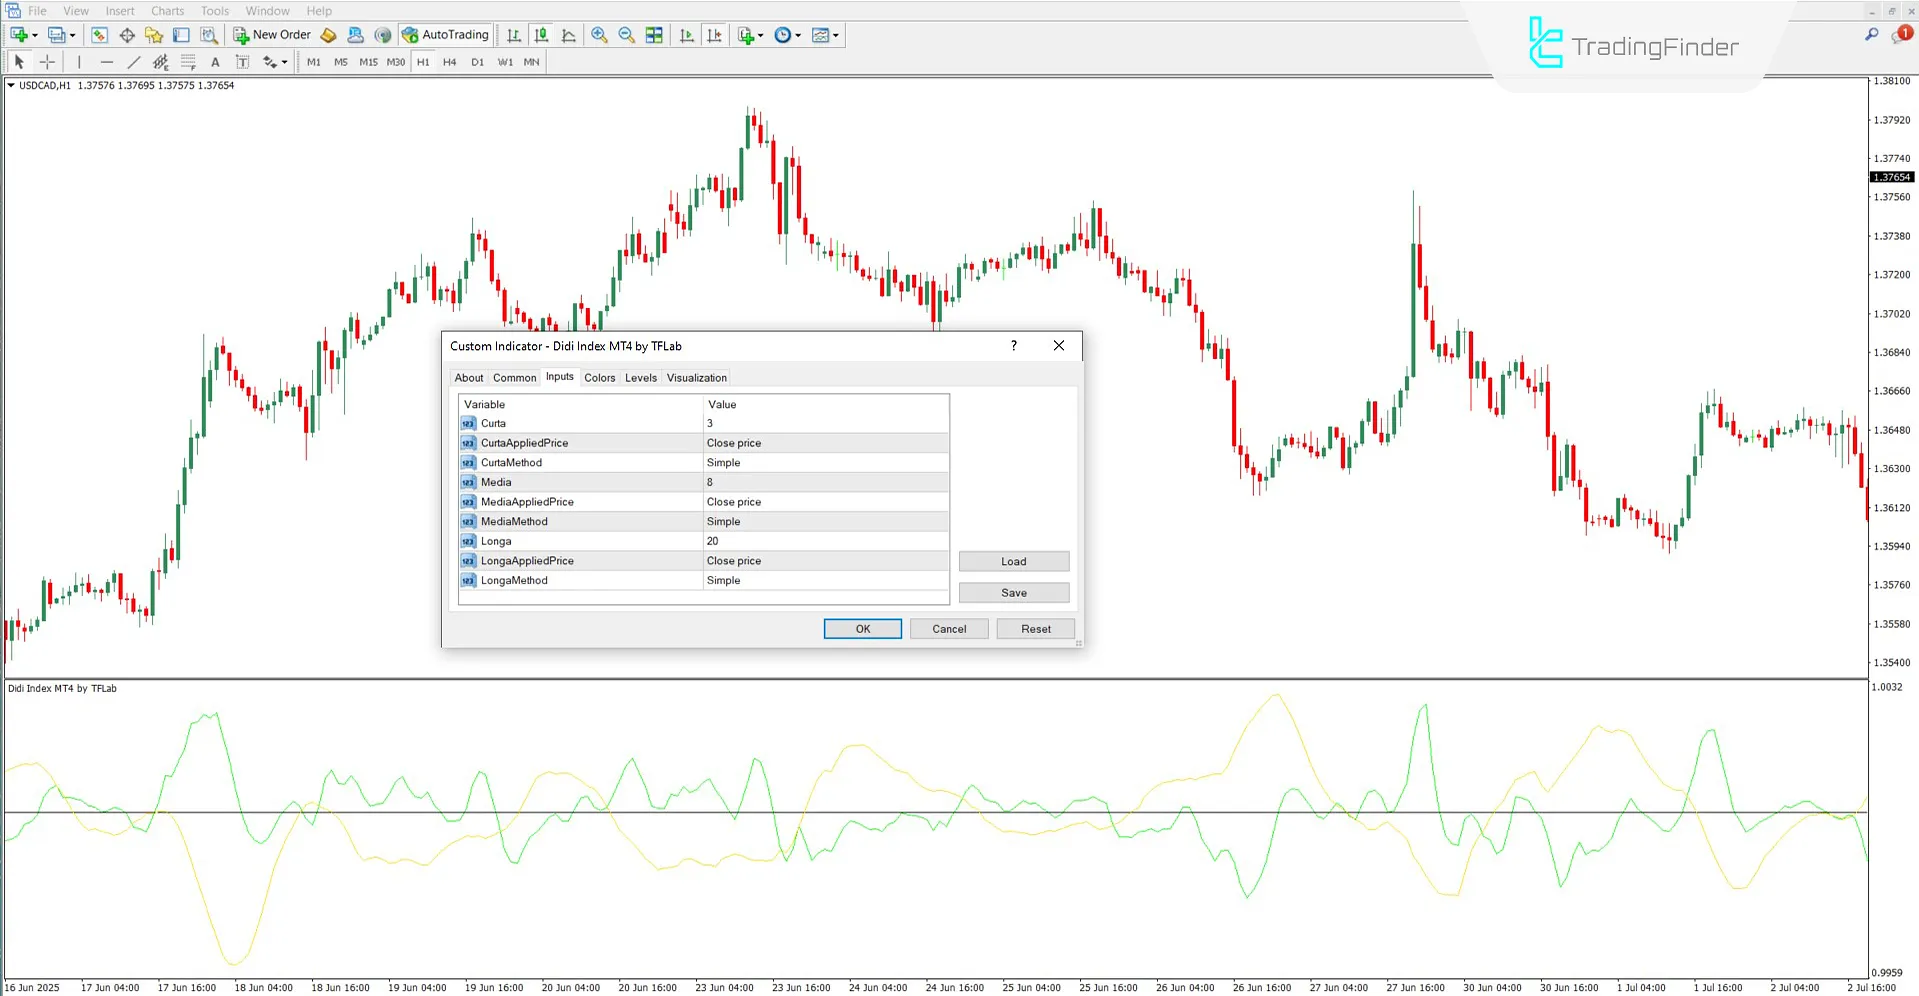
- Curta: Short-term period for index calculation
- CurtaAppliedPrice: Closing price as basis of short-term period
- CurtaMethod: Simple moving average method for short-term period
- Media: Medium-term period for index calculation
- MediaAppliedPrice: Closing price as basis of medium-term period
- MediaMethod: Simple moving average method for medium-term period
- Longa: Long-term period for index calculation
- LongaAppliedPrice: Closing price as basis of long-term period
- LongaMethod: Simple moving average method for long-term period
Conclusion
The Didi Index indicator, by using 3 moving averages with short term, medium term, and long term periods, identifies entry and exit points in trades.
The main application of this oscillator is in determining crossover moments of the lines as trading signals.
Didi Index Indicator for MT4 PDF
Didi Index Indicator for MT4 PDF
Click to download Didi Index Indicator for MT4 PDFHow are trading signals determined in this indicator?
Green line positioned above the middle line indicates a bullish signal, while yellow line positioned above the middle line indicates a bearish signal.
Can this indicator be used in the stock market?
Yes, the Didi Index indicator can be used in all markets including Forex, cryptocurrency, stocks, and commodities.


