![DMI ADX Histogram Indicator for MetaTrader 4 Download - Free - [TFlab]](https://cdn.tradingfinder.com/image/154867/4-17-en-dmi-adx-histogram-oscillator-mt4-1.webp)
![DMI ADX Histogram Indicator for MetaTrader 4 Download - Free - [TFlab] 0](https://cdn.tradingfinder.com/image/154867/4-17-en-dmi-adx-histogram-oscillator-mt4-1.webp)
![DMI ADX Histogram Indicator for MetaTrader 4 Download - Free - [TFlab] 1](https://cdn.tradingfinder.com/image/154834/4-17-en-dmi-adx-histogram-oscillator-mt4-2.webp)
![DMI ADX Histogram Indicator for MetaTrader 4 Download - Free - [TFlab] 2](https://cdn.tradingfinder.com/image/154845/4-17-en-dmi-adx-histogram-oscillator-mt4-3.webp)
![DMI ADX Histogram Indicator for MetaTrader 4 Download - Free - [TFlab] 3](https://cdn.tradingfinder.com/image/154856/4-17-en-dmi-adx-histogram-oscillator-mt4-4.webp)
The DMI ADX Histogram Oscillator is a combination of the ADX and DMI indicators and is a practical tool among MetaTrader 4 oscillators.
This indicator analyzes market trends (DMI) and trend strength (ADX); green histogram bars represent an uptrend, while red bars indicate a downtrend.
Indicator Table
Indicator Categories: | Oscillators MT4 Indicators Pivot Points & Fractals MT4 Indicators Trading Assist MT4 Indicators |
Platforms: | MetaTrader 4 Indicators |
Trading Skills: | Intermediate |
Indicator Types: | Leading MT4 Indicators Trend MT4 Indicators |
Timeframe: | Multi-Timeframe MT4 Indicators |
Trading Style: | Day Trading MT4 Indicators |
Trading Instruments: | Share Stocks MT4 Indicators Forward Market MT4 Indicators Stock Market MT4 Indicators Cryptocurrency MT4 Indicators Forex MT4 Indicators |
Overview of the Indicator
Calculating the ADX line can be complex, but in simple terms, the stronger the trend, the higher the ADX line value. The DMI Histogram shows the difference between these two lines. Forex and other market traders can combine the DMI Histogram with the ADX line to incorporate it into theirtrading strategies.
Indicator in an Uptrend
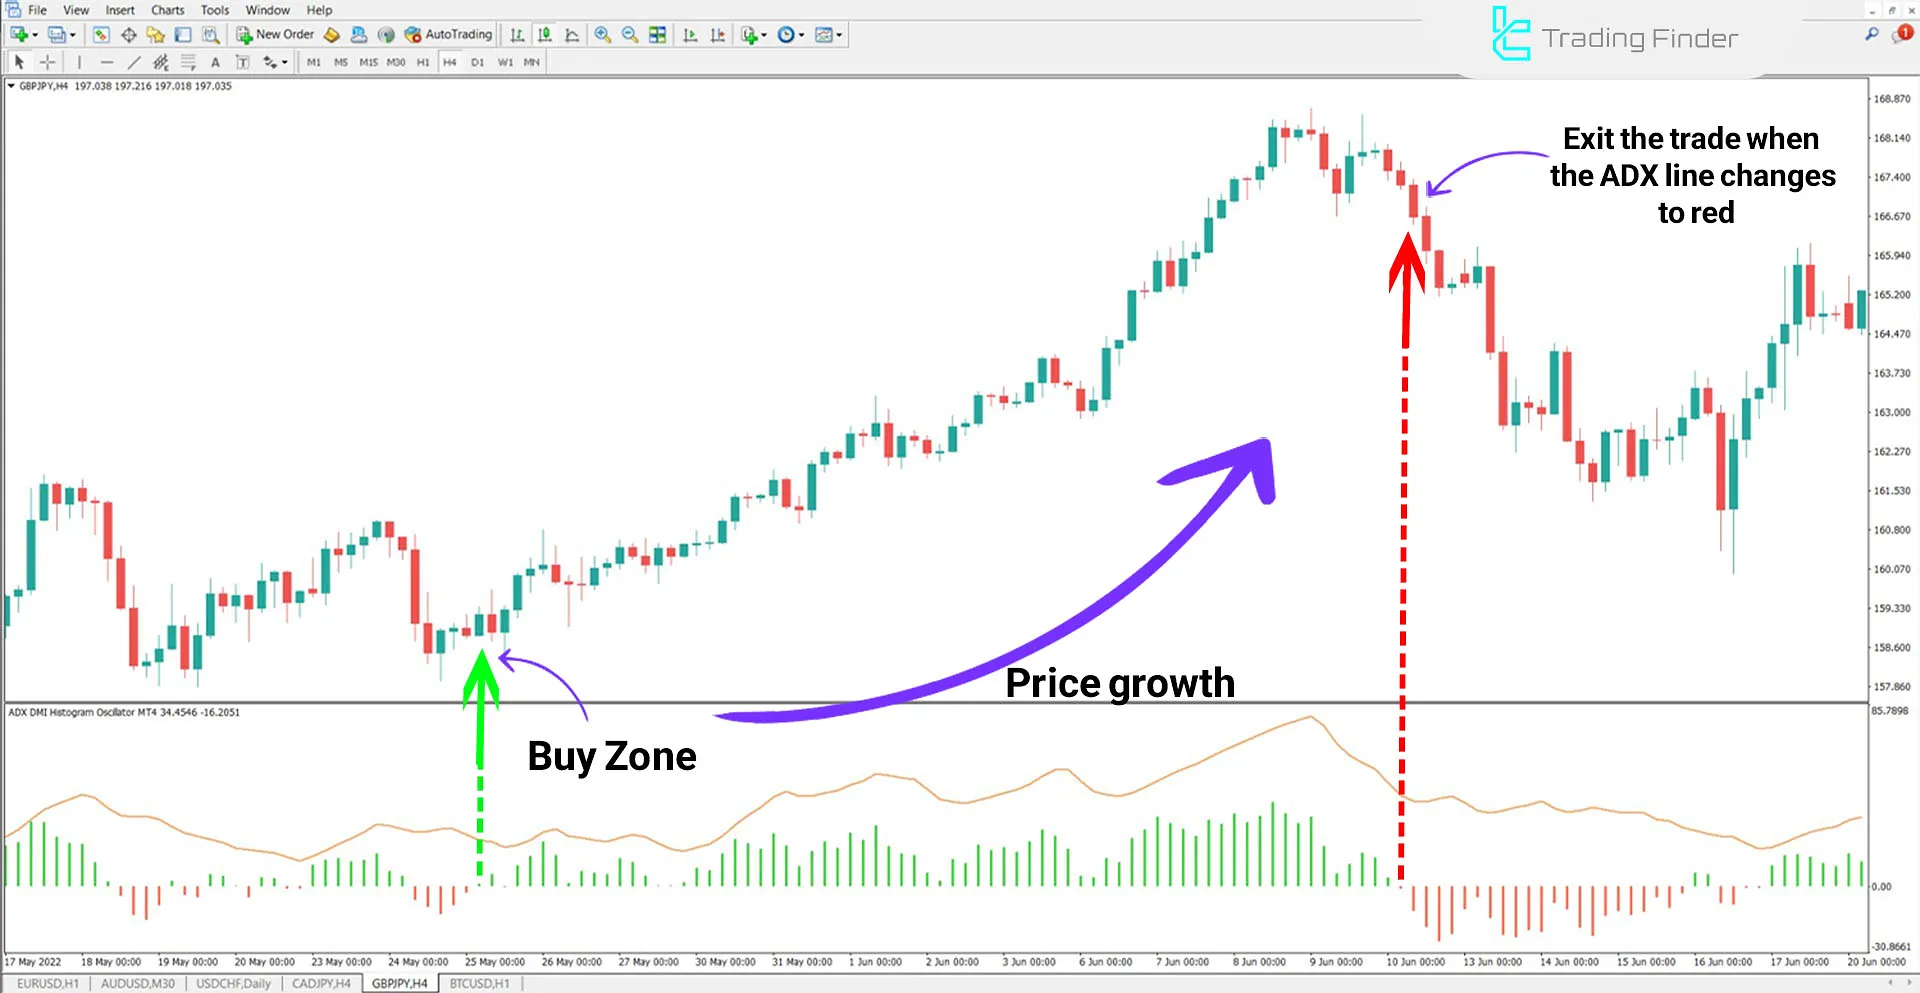
In the price chart of the GBP/JPY currency pair, when the indicator's histogram turns green and crosses above the zero line, traders can enter a buy trade.
Additionally, after the histogram turnsred, they can exit the trade.

Indicator in a Downtrend
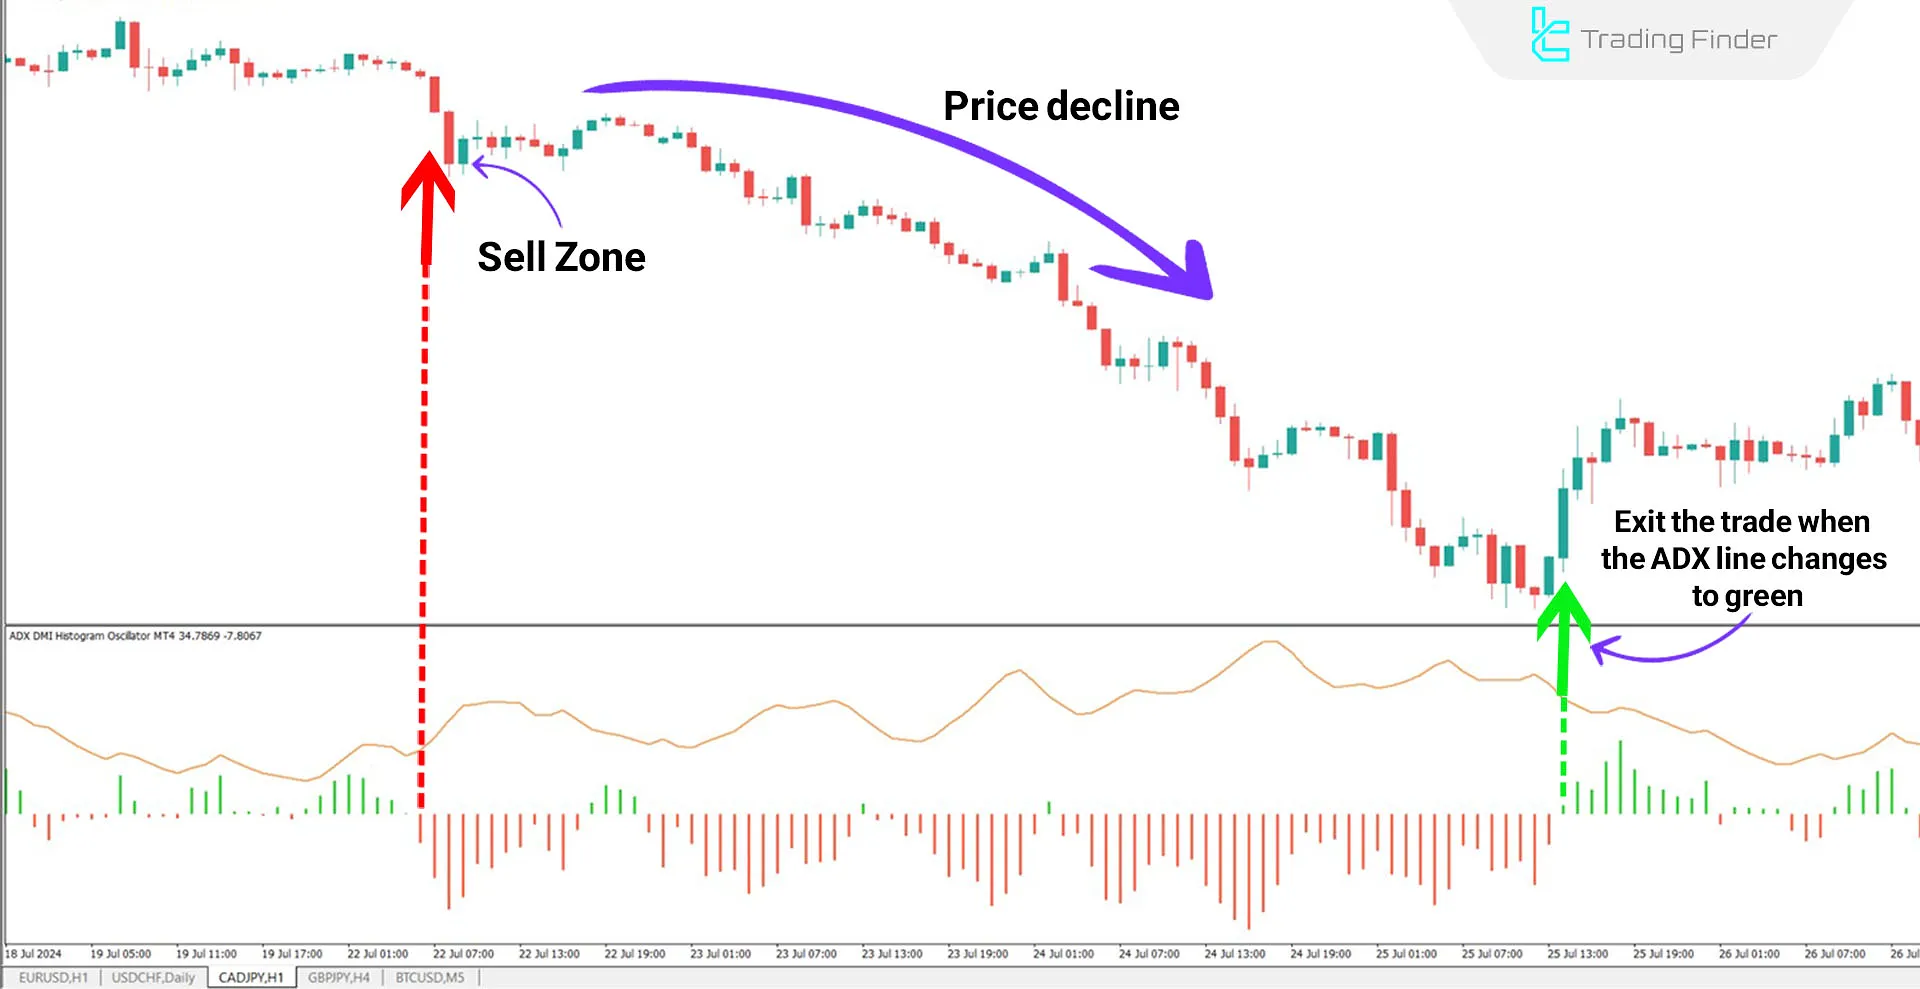
In the image below, the price chart of the CAD/JPY currency pair is shown in a 1-hour timeframe.
When the histogram changes from green to red, it highlights a suitable selling zone for traders.
After the histogram turns back to green, traders can take theexit signal for the trade.

Indicator Settings

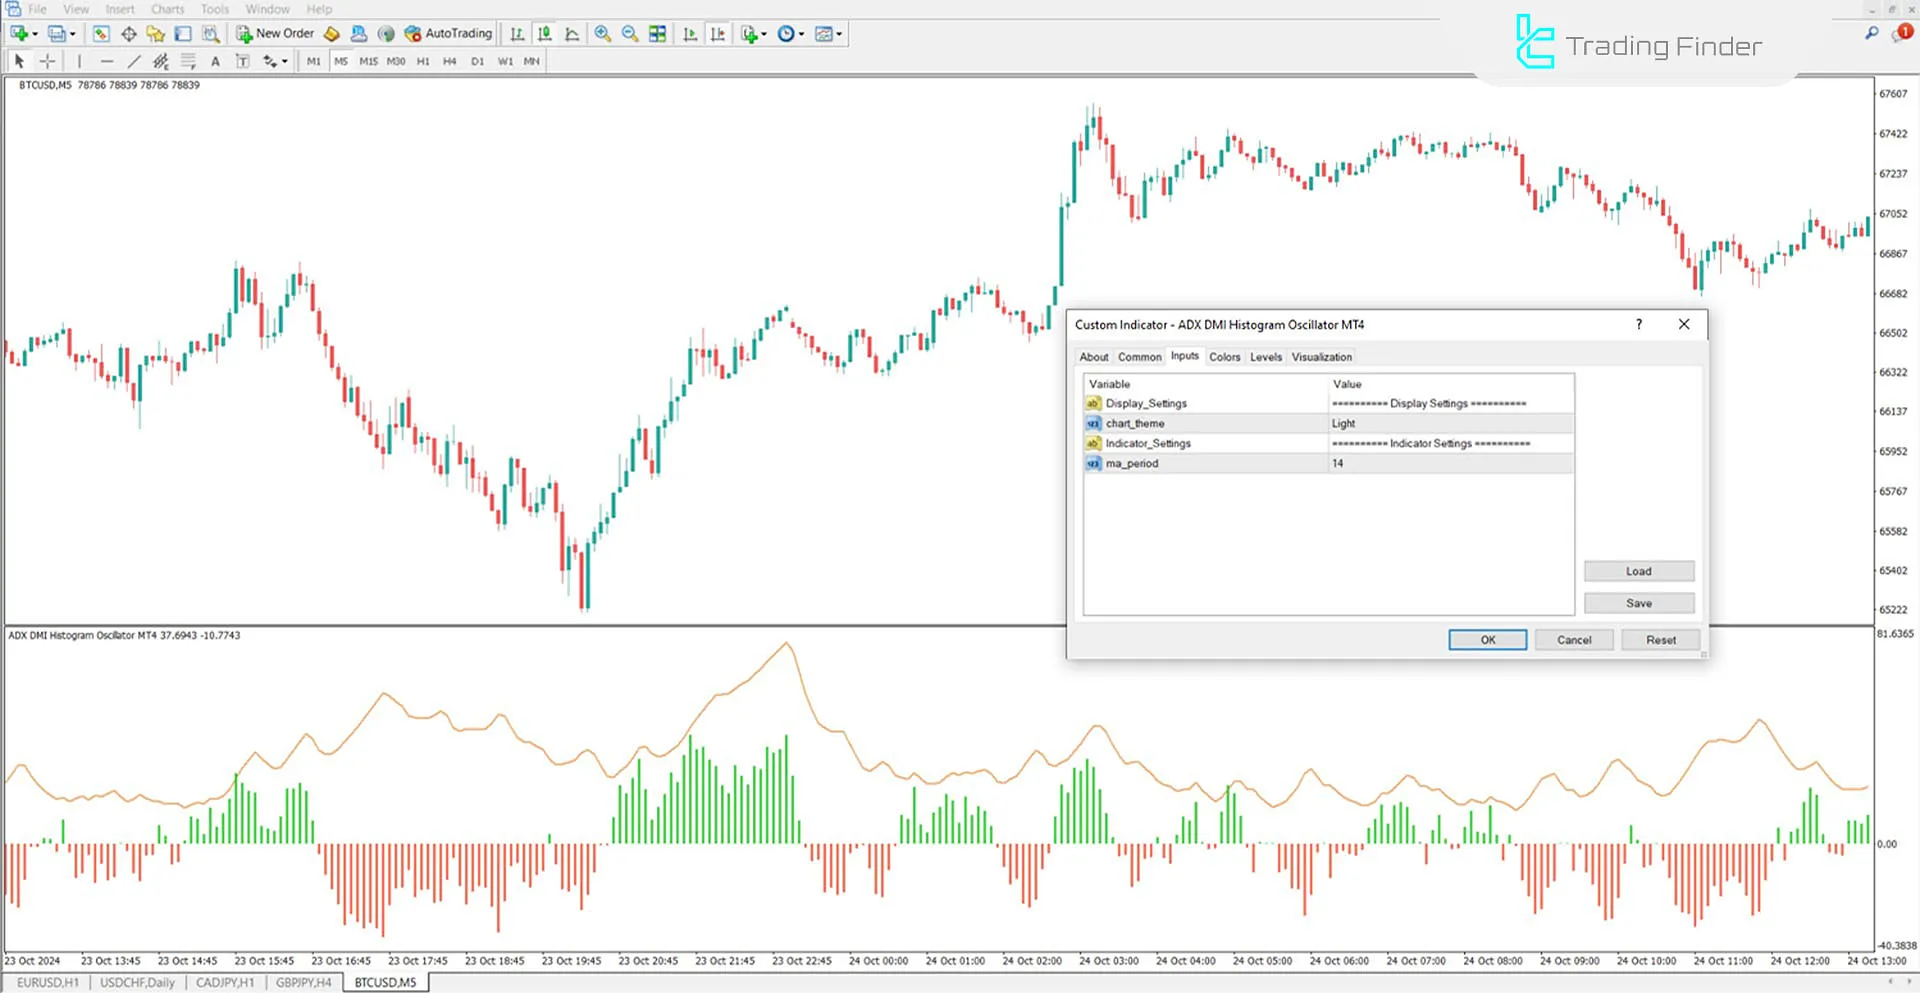
- Chart Theme: Background color of the chart;
- Ma Period: The calculation period for ADX, default set to 14.
Conclusion
Among the MetaTrader 4 Indicators, this tool is recognized as an effective instrument in forex trading; by incorporating the Directional Movement Index (DMI), the analytical power and accuracy of market trend predictions are significantly enhanced.
Additionally, traders can enhance theirbuy and sell trades using multiple timeframes (MTF) and leveraging the DMI ADX Histogram Indicator.
DMI ADX Histogram MT4 PDF
DMI ADX Histogram MT4 PDF
Click to download DMI ADX Histogram MT4 PDFHow can this indicator be used in trading?
Traders can enter a buy trade when the histogram turns green and rises above the zero line. When it turns red, they can exit the trade.
Is this indicator suitable for all timeframes?
Yes, the DMI ADX Histogram Oscillator can be used on any timeframe and is effective for buy and sell confirmations across all financial markets.


