![Donchain Channel Indicator for MetaTrader4 Download - Free - [Trading Finder]](https://cdn.tradingfinder.com/image/342702/4en.webp)
![Donchain Channel Indicator for MetaTrader4 Download - Free - [Trading Finder] 0](https://cdn.tradingfinder.com/image/342702/4en.webp)
![Donchain Channel Indicator for MetaTrader4 Download - Free - [Trading Finder] 1](https://cdn.tradingfinder.com/image/342703/10-07-en-donchain-channel-mt4-02.webp)
![Donchain Channel Indicator for MetaTrader4 Download - Free - [Trading Finder] 2](https://cdn.tradingfinder.com/image/342700/10-07-en-donchain-channel-mt4-03.webp)
![Donchain Channel Indicator for MetaTrader4 Download - Free - [Trading Finder] 3](https://cdn.tradingfinder.com/image/342701/10-07-en-donchain-channel-mt4-04.webp)
On June 23, 2025, in version 2, alert/notification functionality was added to this indicator
The Donchian Channel indicator, part of the MetaTrader 4 suite of indicators, effectively signals the start of trends during retracements and pullbacks. The channel is drawn based on the high and low prices over a defined period set within the indicator. A break above the upper band triggers a buy signal, while a break below the lower band triggers a sell signal. This indicator is particularly suitable for trending and volatile markets but may need to perform better in range-bound (sideways) markets.
Indicator Table
Indicator Categories: | Signal & Forecast MT4 Indicators Bands & Channels MT4 Indicators Levels MT4 Indicators |
Platforms: | MetaTrader 4 Indicators |
Trading Skills: | Elementary |
Indicator Types: | Leading MT4 Indicators Breakout MT4 Indicators Non-Repainting MT4 Indicators |
Timeframe: | Multi-Timeframe MT4 Indicators |
Trading Style: | Day Trading MT4 Indicators Intraday MT4 Indicators Scalper MT4 Indicators |
Trading Instruments: | Indices Market MT4 Indicators Commodity Market MT4 Indicators Cryptocurrency MT4 Indicators Forex MT4 Indicators Stock MT5 Indicators Share Stock MT5 Indicators |
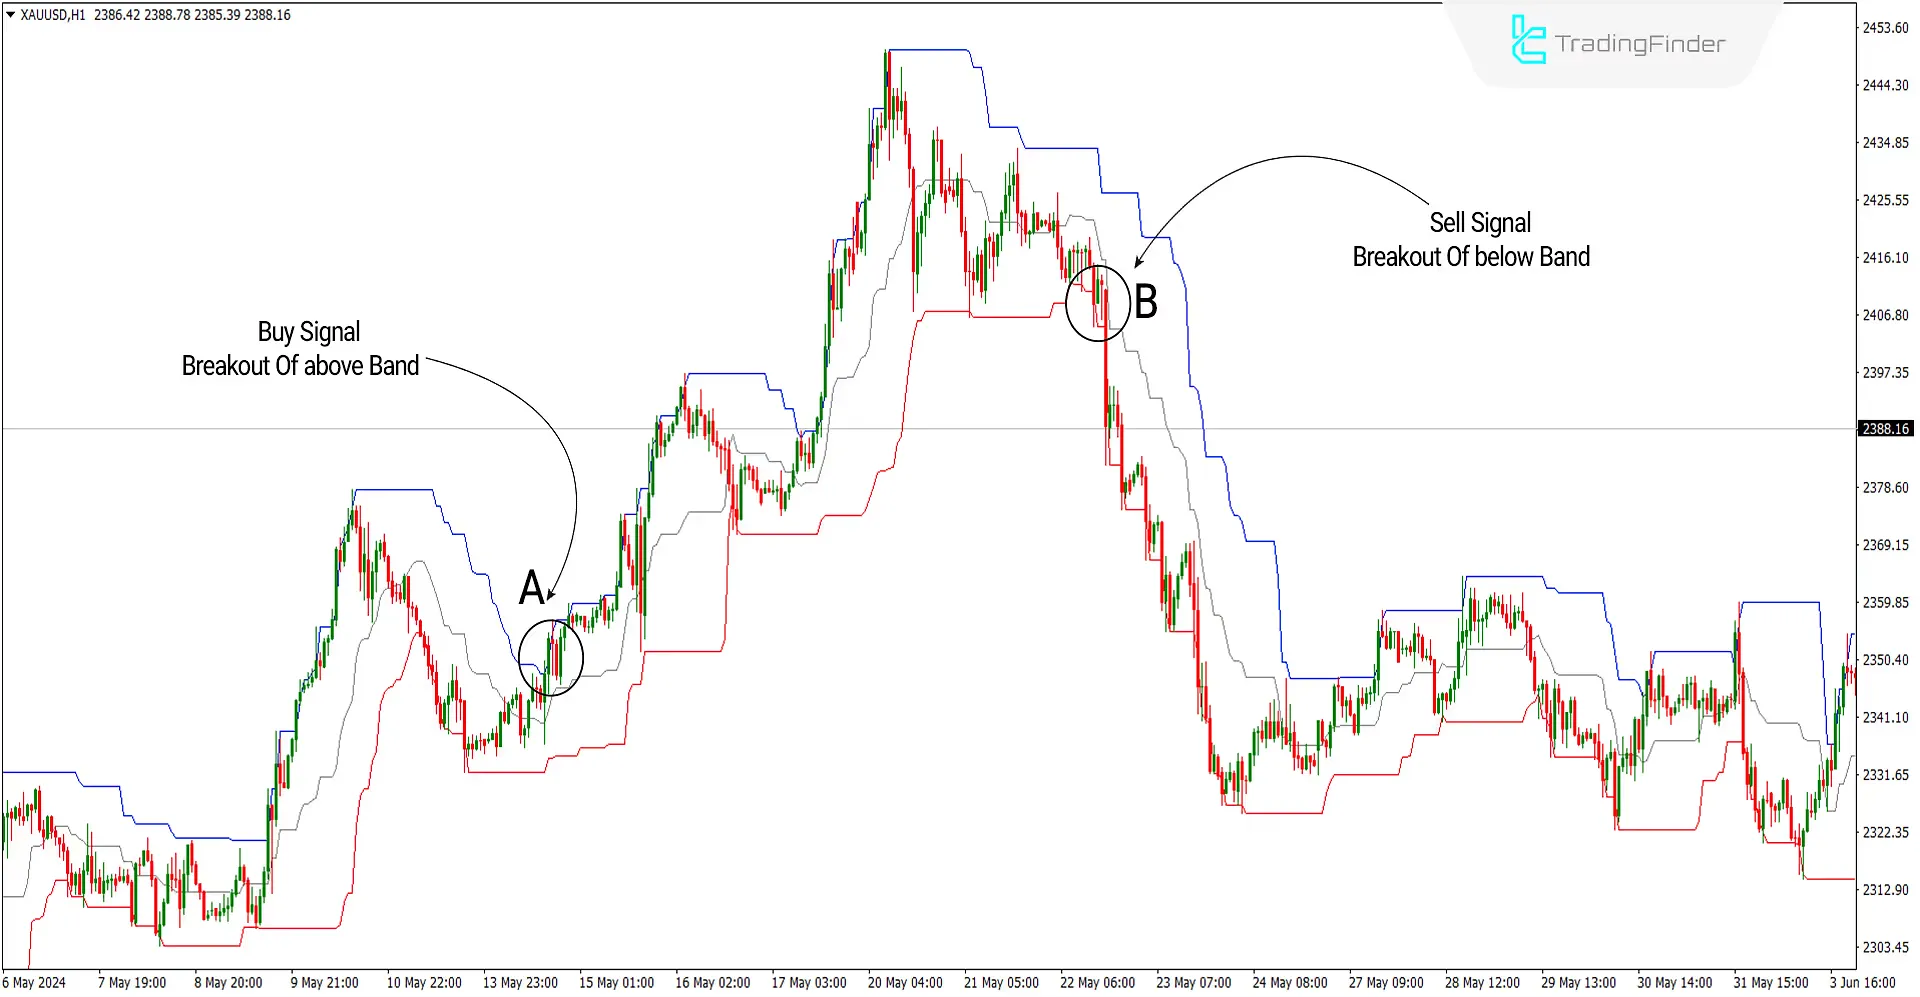
The image below displays the gold price chart with the symbol [XAUUSD] in a 1-hour timeframe. At point A, marked by a circle, the price breaks the upper boundary of the donchian Channel with a solid bullish candle, signaling an entry for a long (buy) trade. Similarly, at point B, with a solid bearish candle breaking through the channel's lower boundary, a signal for a short (sell) trade is issued. This illustrates how the donchian Channel can capture significant moves by tracking breakouts from established ranges.

Overview
The donchian Channel indicator is a technical trading tool used to identify breakout points and trend changes in the market. This indicator consists of adjustable bands that depend on the highest (High) and lowest (Low) prices within a specific period. The upper band represents the highest price, and the lower band represents the lowest price during that period. The middle line displays the average of the high and low prices. The bands of this indicator can serve as dynamic support and resistance levels, helping traders make strategic decisions based on these pivotal price levels.
Uptrend Signals (Buy Positions)
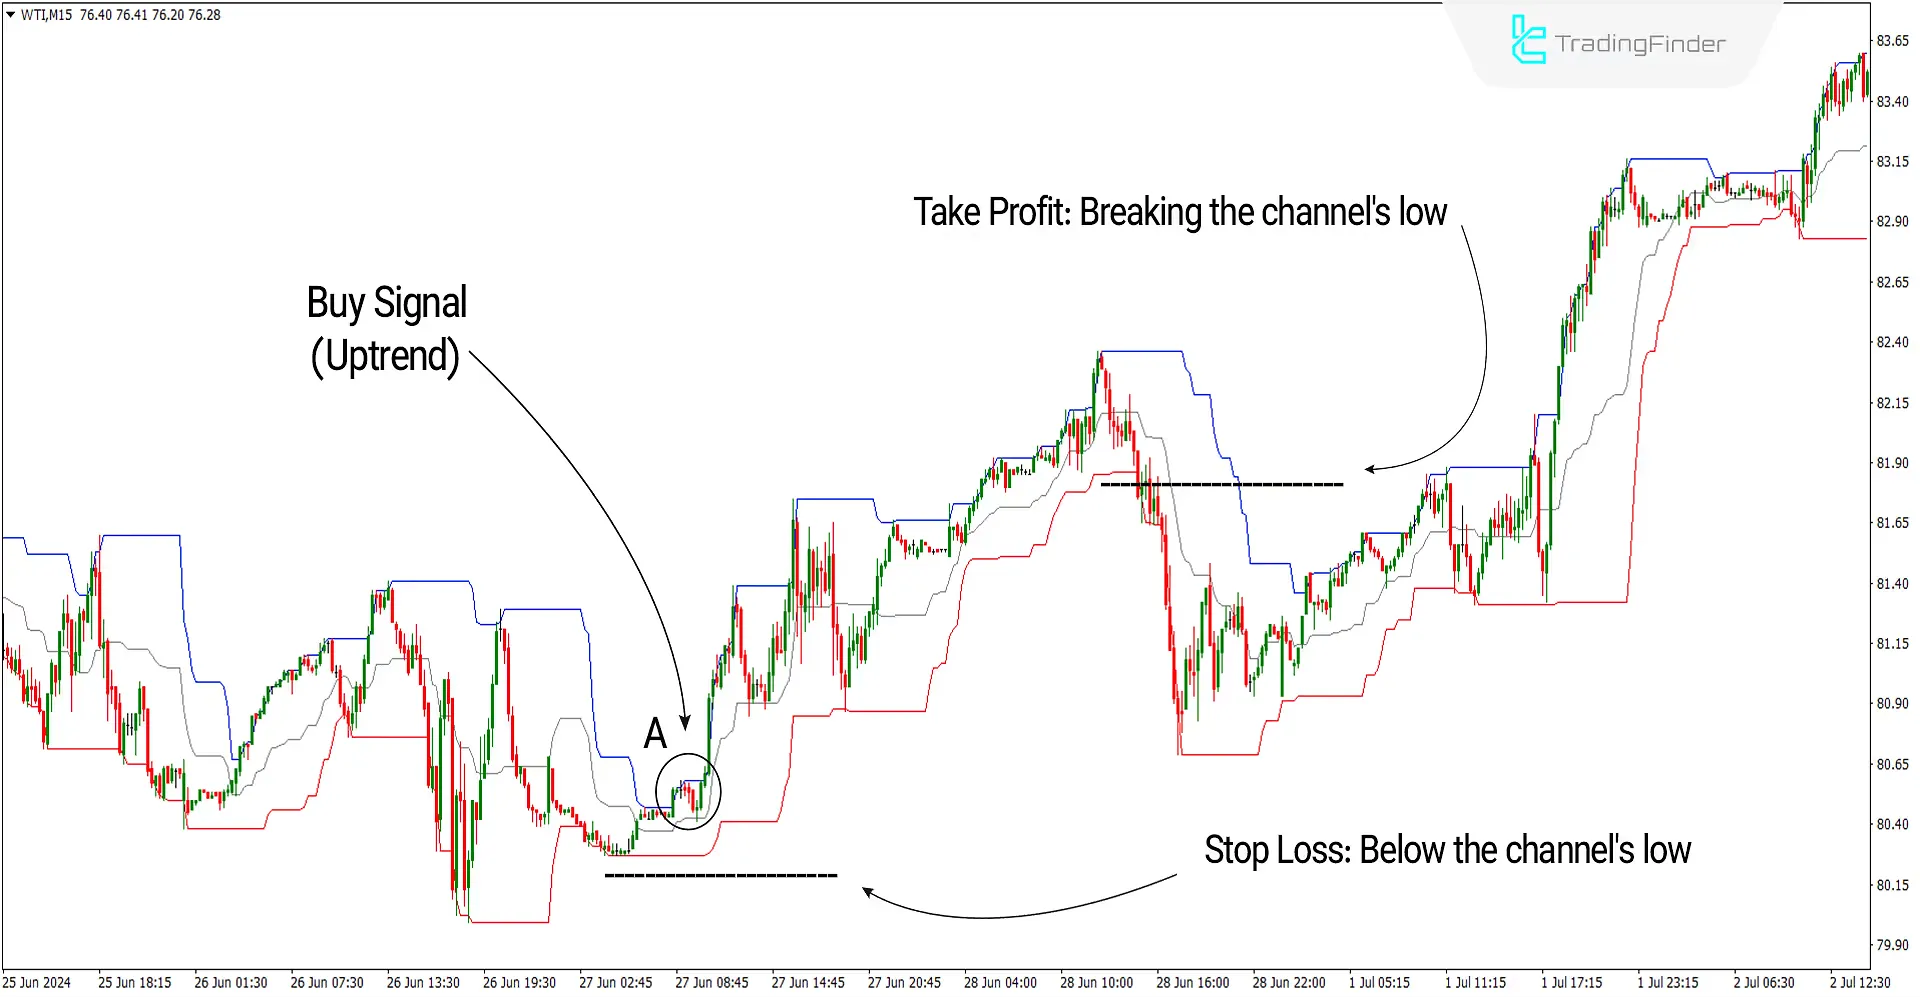
The image below displays the price chart for oil with the symbol (WTI) on a 15-minute timeframe. At point A, the price powerfully breaks through the upper band of the donchian Channel. Under these conditions, a signal to enter a long (buy) trade is issued. This indicates a potential upward movement, prompting traders to consider a buy position based on the breakout momentum.
Take Profit and Stop Loss for Buy Signals
To set the take profit, the price reaching the opposite band (breaking through the channel's lower boundary) can be considered the criterion. The stop loss, as shown in the image, should be set below the channel's low.

Downtrend Signals (Sell Positions)
In the image below, the chart for the currency pair US Dollar to Swiss Franc with the symbol (USDCHF) on a 4-hour timeframe is displayed. At point A, the price strongly breaks through the lower band of the channel. Under these conditions, a signal to enter a short (sell) trade is issued. This suggests a potential downward movement, prompting traders to consider a sell position based on the breakout strength.
Take Profit and Stop Loss for Sell Signals
To set the take profit, one could use the price reaching the opposite band (breaking the channel's upper boundary) as the criterion. As depicted in the image, the stop loss should be placed above the channel's high.

Settings of the donchian Channel

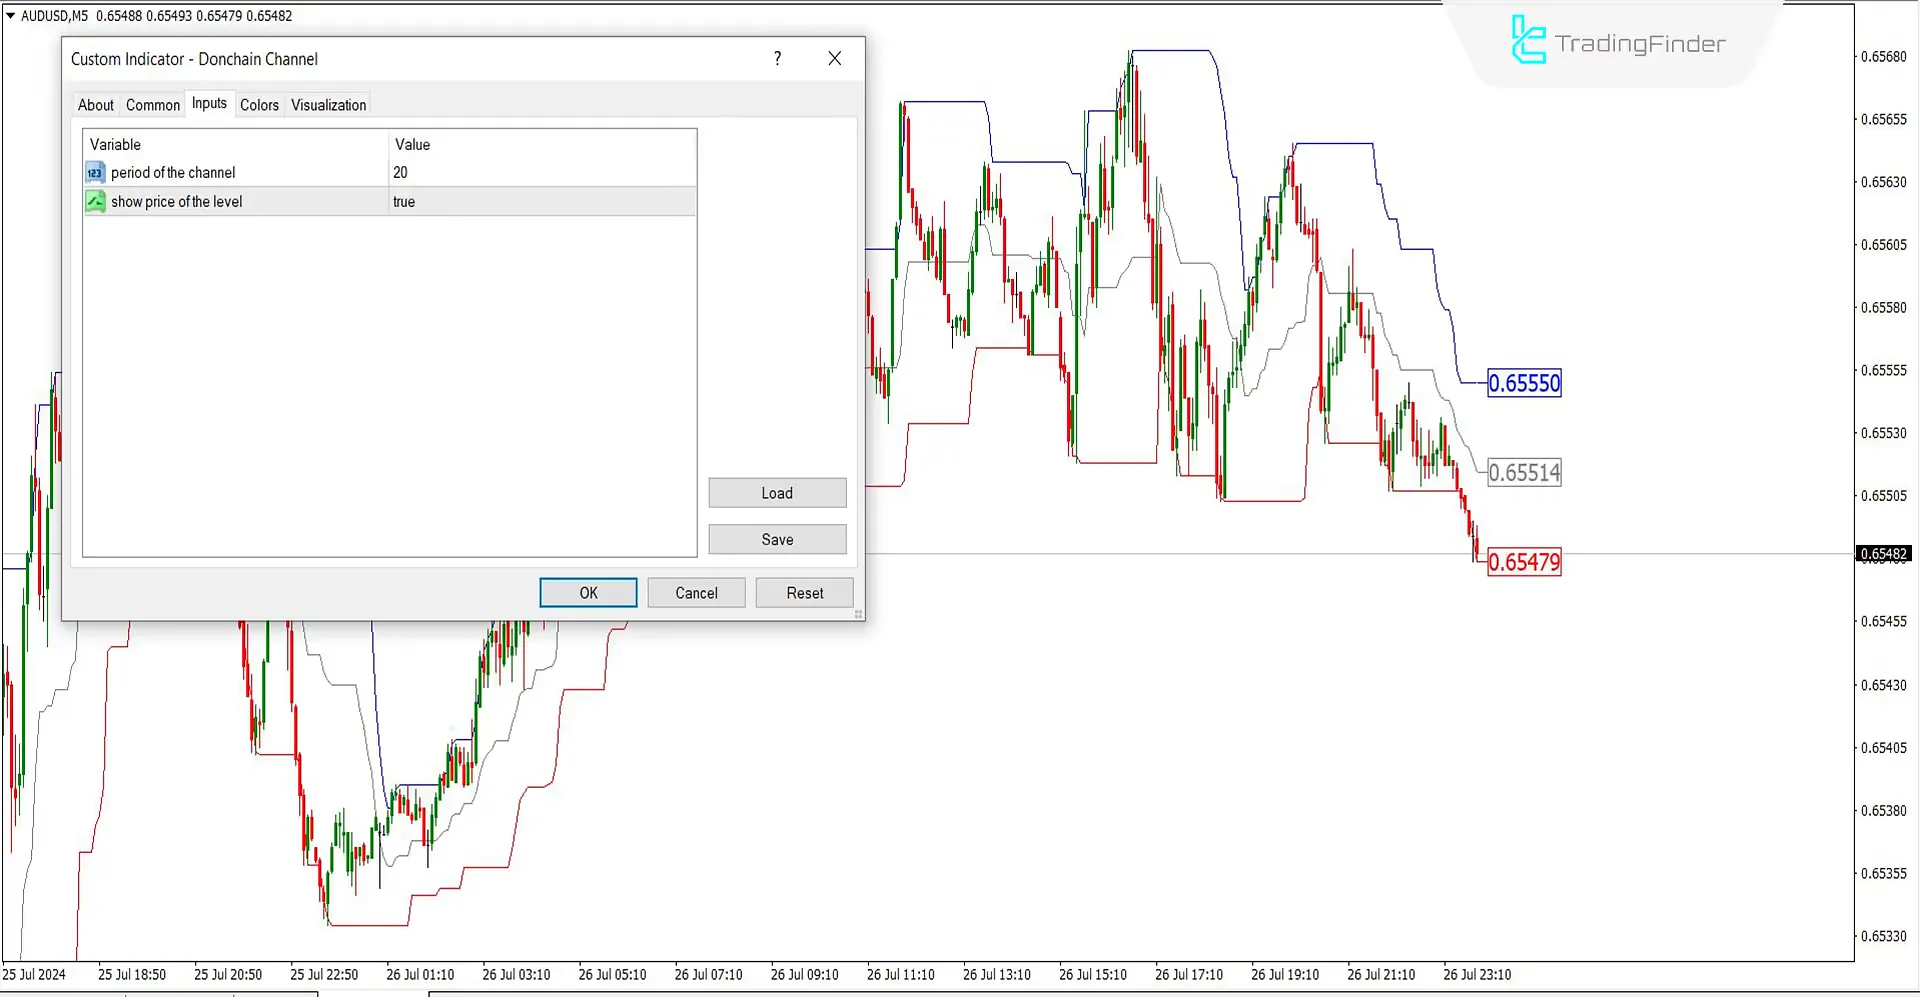
- Period of the channel: 20 is used for the channel's timeframe.
- Show price of the level: The option 'true' displays numbers on the chart.
Summary
The Donchian Channel indicator is a simple and effective technical tool that helps identify breakout points and trend reversals. It is beneficial in markets characterized by strong trends and high volatility, and can be effectively incorporated into a comprehensive trading strategy. While this Metatrader 4 Band and channel indicator is suitable for all timeframes, using it in higher timeframes, such as 15 minutes or more, is recommended due to the high volatility present in shorter timeframes. This ensures more reliable signals and minimizes the potential for false breakouts.
Donchain Channel MT4 PDF
Donchain Channel MT4 PDF
Click to download Donchain Channel MT4 PDFCan the signals from the Donchain Channel indicator be used on their own?
Yes, traders can use this indicator to select optimal trade entry and exit points. The Donchain Channel provides clear signals for breakouts and breakdowns, which can be powerful indicators for opening or closing positions.
Is the Donchain Channel suitable for all market conditions?
No, this indicator best suits trending and fast-moving markets like Forex and cryptocurrencies. It performs poorly in range-bound or sideways markets, as it might generate false signals in these conditions. The Donchain Channel is most effective when markets show clear directional trends.


