


![Double Fibonacci Indicator for MetaTrader 4 Download – [TradingFinder]](https://cdn.tradingfinder.com/image/301606/2-42-en-double-fib-mt4-1.webp)
![Double Fibonacci Indicator for MetaTrader 4 Download – [TradingFinder] 1](https://cdn.tradingfinder.com/image/301607/2-42-en-double-fib-mt4-2.webp)
![Double Fibonacci Indicator for MetaTrader 4 Download – [TradingFinder] 2](https://cdn.tradingfinder.com/image/301608/2-42-en-double-fib-mt4-3.webp)
![Double Fibonacci Indicator for MetaTrader 4 Download – [TradingFinder] 3](https://cdn.tradingfinder.com/image/301605/2-42-en-double-fib-mt4-4.webp)
The Double Fibonacci (Double Fib) Indicator is designed to identify key support and resistance levels by combining two types of Fibonacci tools Retracement Fibonacci and Expansion Fibonacci.
This MT4 indicator identifies fractal price levels and key market turning points. When these fractal zones overlap with Fibonacci retracement and extension levels, traders can more precisely define entry areas across all markets, including the Forex market.
Double Fibonacci Specification Table
The following table provides a summary of the key features of the Double Fibonacci Indicator.
Indicator Categories: | Pivot Points & Fractals MT4 Indicators Support & Resistance MT4 Indicators Levels MT4 Indicators |
Platforms: | MetaTrader 4 Indicators |
Trading Skills: | Intermediate |
Indicator Types: | Reversal MT4 Indicators |
Timeframe: | Multi-Timeframe MT4 Indicators |
Trading Style: | Intraday MT4 Indicators |
Trading Instruments: | Share Stocks MT4 Indicators Forward Market MT4 Indicators Stock Market MT4 Indicators Cryptocurrency MT4 Indicators Forex MT4 Indicators |
Indicator Overview
The Double Fibonacci Indicator for MetaTrader 4 identifies zones where retracement Fibonacci, expansion Fibonacci, and fractal levels overlap. These areas are considered Reversal Zones.
The retracement and expansion Fibonacci levels are drawn automatically in yellow and blue, while fractal levels are drawn using solid and dashed lines based on significant and minor pivot points.
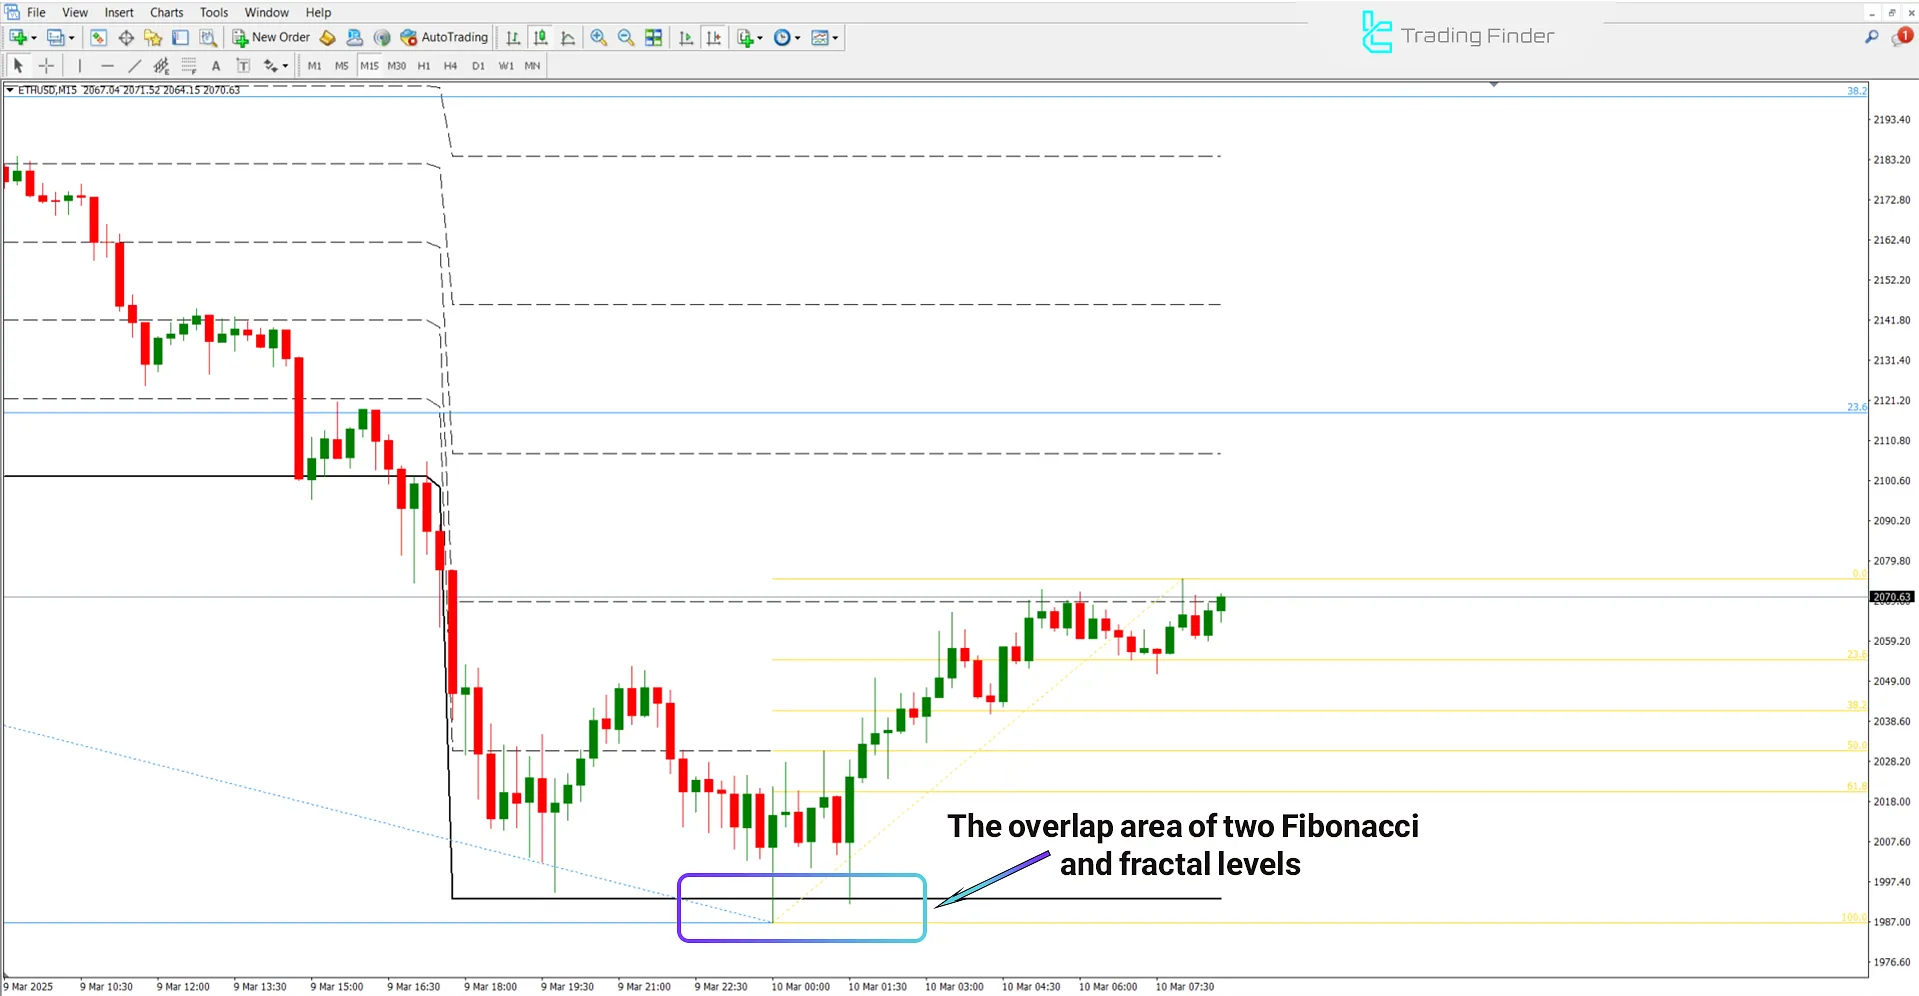
Uptrend Conditions
The chart below shows the Ethereum Index (ETH/USD) in a 15-minute timeframe.In this chart, the Double Fibonacci Indicator plots both the retracement and expansion of Fibonacci simultaneously.
These levels overlap with price fractal levels, creating a potential entry zone for buy trades.
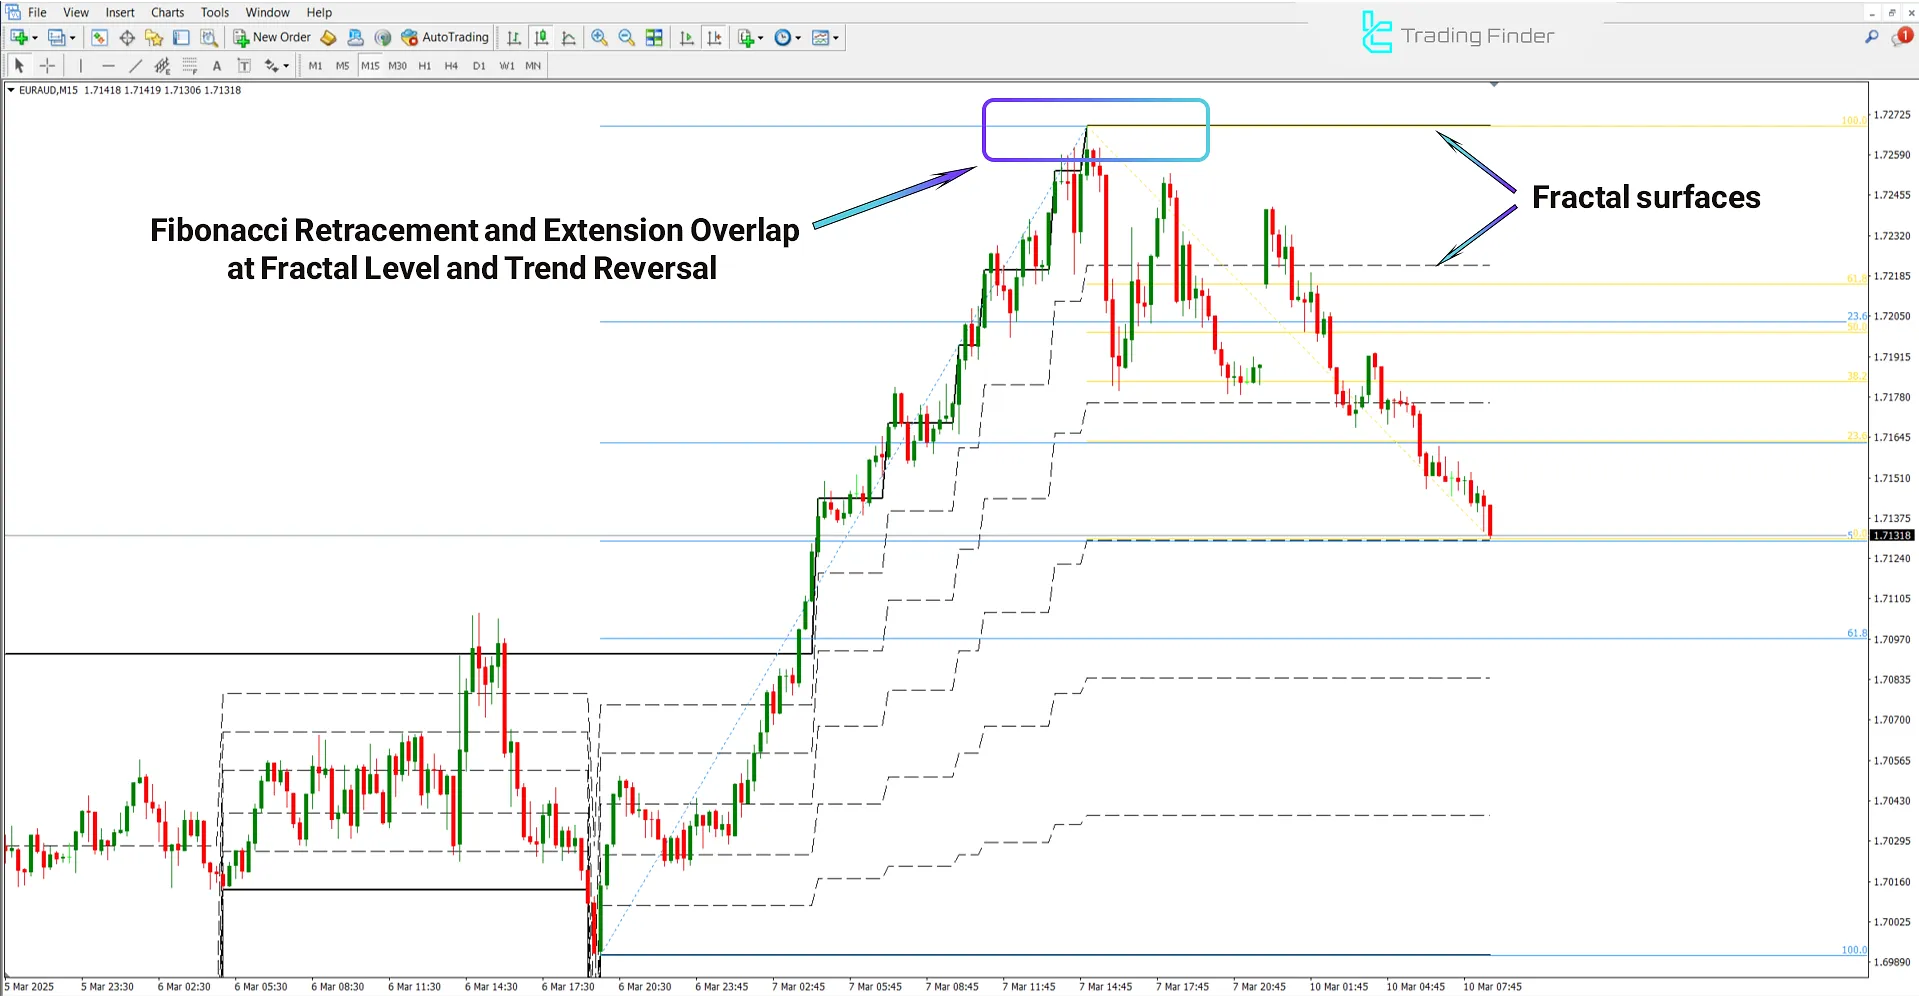
Downtrend Conditions
The following price chart shows the EUR/AUD currency pair in a 15-minute timeframe. In this chart, overlapping Fibonacci retracement and expansion levels align with fractal levels.
This confluence and a price retracement to the 61.8% Fibonacci level presents an ideal sell entry opportunity.
Indicator Settings
The settings panel of the Double Fibonacci Indicator is shown in the image below:
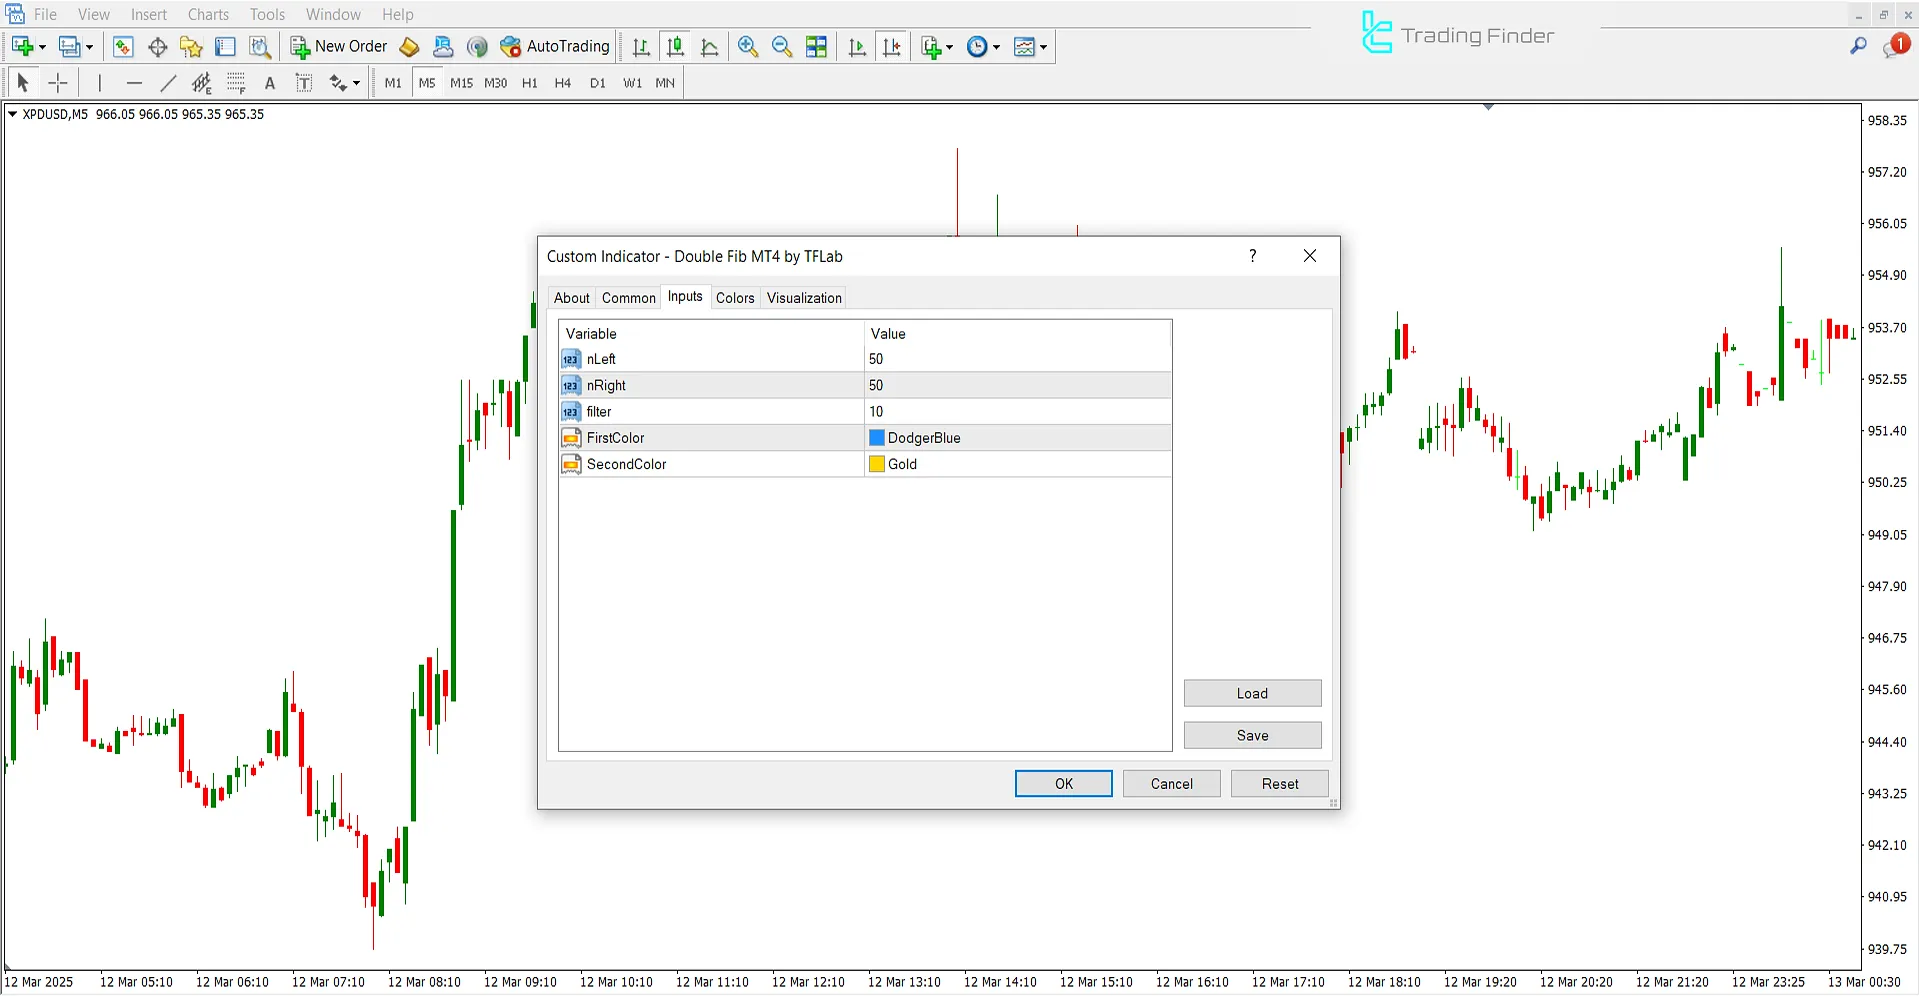
- NLeft: Left pivot
- NRight: Right pivot
- Filter: Signal refinement
- First Color: Primary trend color
- Second Color: Secondary trend color
Conclusion
The Double Fib Indicator is a MT4 support and resistance indicator. It is suitable for all timeframes and automatically plots Fibonacci levels.
By using this trading tool and combining Fibonacci retracement and extension levels with reversal fractals, the precision and effectiveness of technical analysis can be significantly enhanced.
Double Fibonacci MT4 PDF
Double Fibonacci MT4 PDF
Click to download Double Fibonacci MT4 PDFIs the Double Fibonacci Indicator available only for MetaTrader 4?
No, this indicator is available for both MetaTrader 4 and MetaTrader 5.
Can this indicator be used in daily timeframes?
Yes, this multi-timeframe indicator can be used in all timeframes.


