![Engulfing Pattern Indicator for Meta Trader 4 Download - Free - [Trading Finder]](https://cdn.tradingfinder.com/image/107935/11-18-en-engulfing-mt4.webp)
![Engulfing Pattern Indicator for Meta Trader 4 Download - Free - [Trading Finder] 0](https://cdn.tradingfinder.com/image/107935/11-18-en-engulfing-mt4.webp)
![Engulfing Pattern Indicator for Meta Trader 4 Download - Free - [Trading Finder] 1](https://cdn.tradingfinder.com/image/36391/11-18-en-engulfing-mt4-02.avif)
![Engulfing Pattern Indicator for Meta Trader 4 Download - Free - [Trading Finder] 2](https://cdn.tradingfinder.com/image/36392/11-18-en-engulfing-mt4-03.avif)
![Engulfing Pattern Indicator for Meta Trader 4 Download - Free - [Trading Finder] 3](https://cdn.tradingfinder.com/image/36390/11-18-en-engulfing-mt4-04.avif)
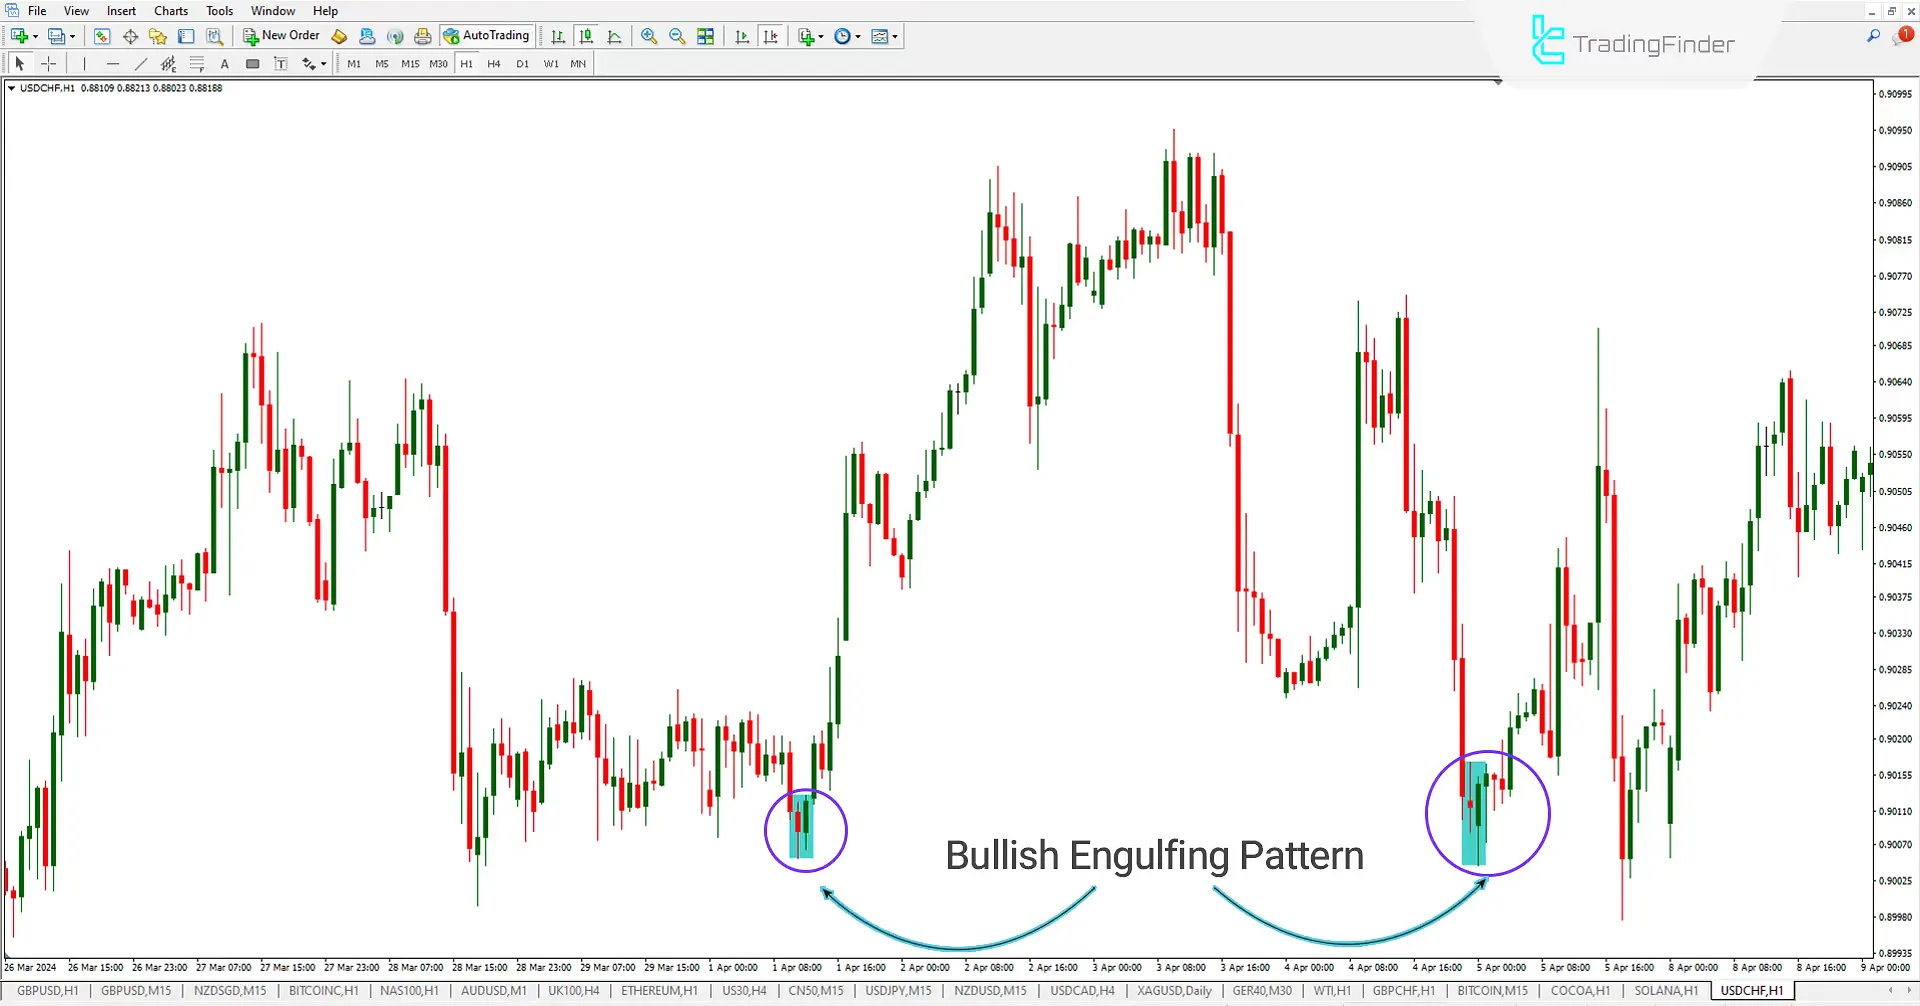
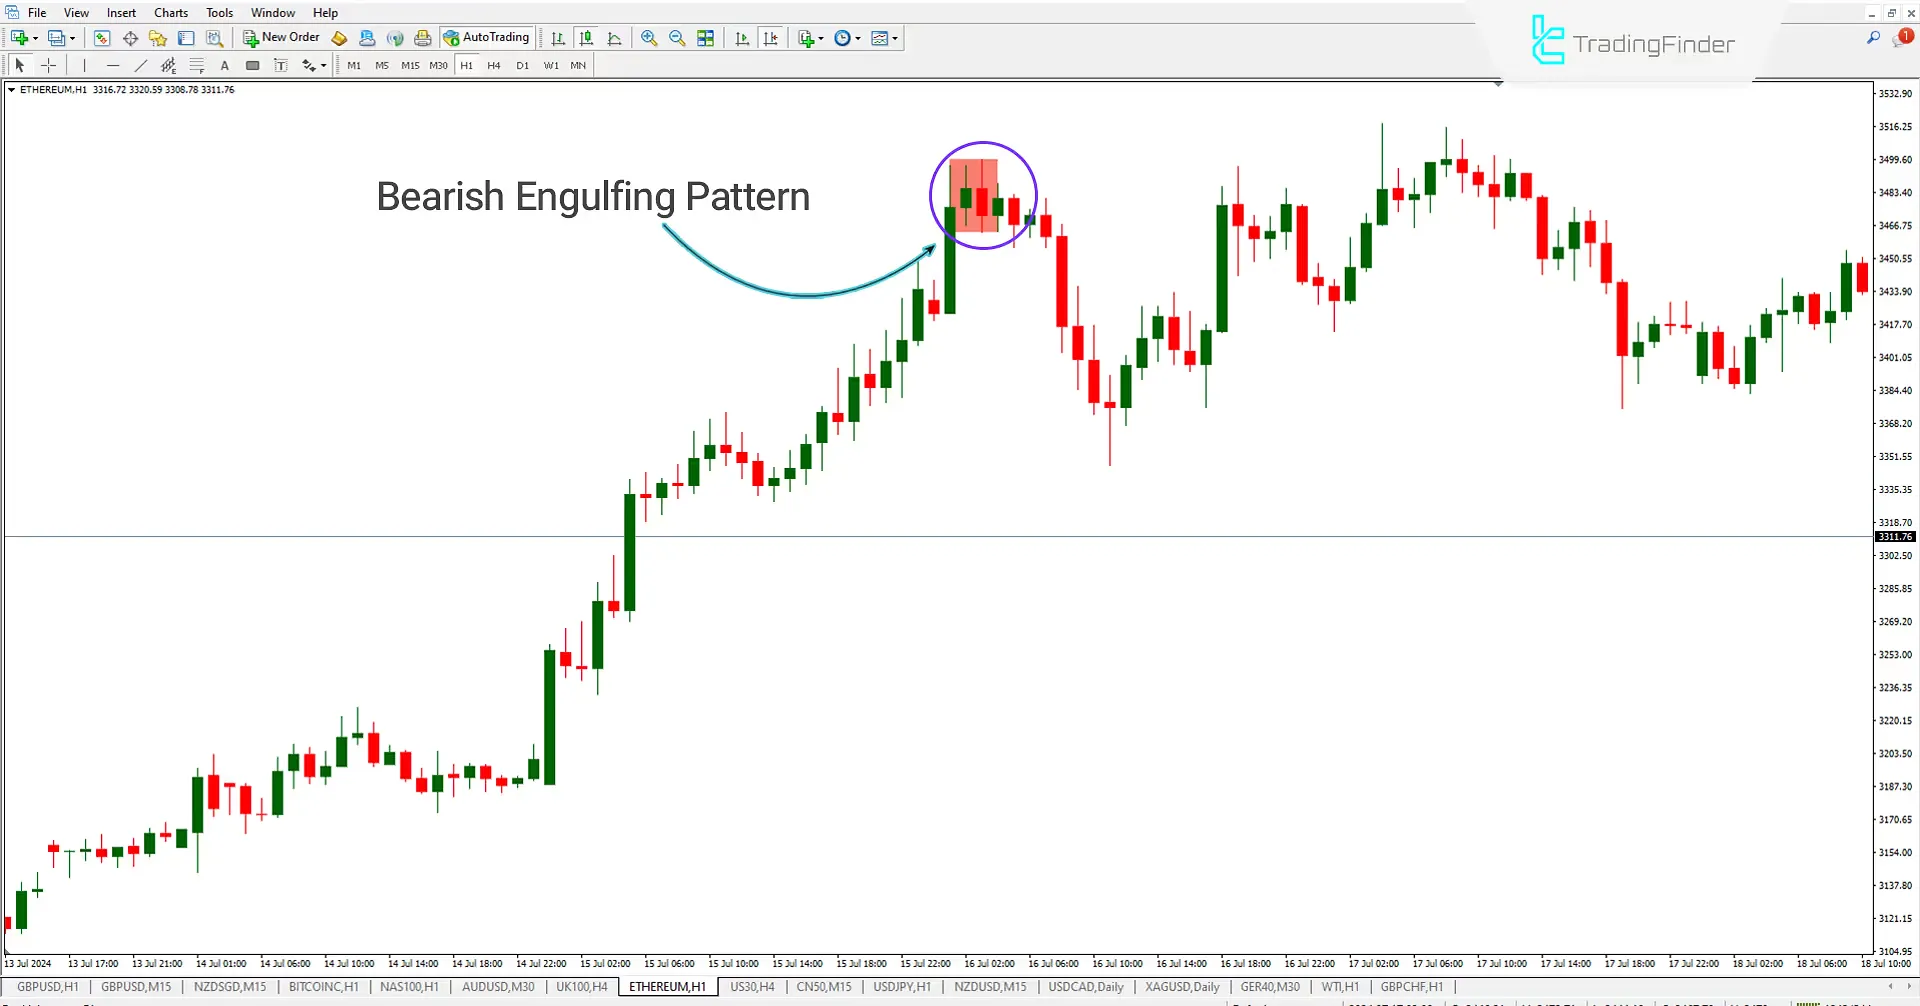
The Engulfing Pattern Indicator quickly identifies and displays bullish engulfing patterns in turquoise blue and bearish red in the Meta Trader 4 indicator.
The Engulfing Indicator uses two moving averages with periods of (5,20) in its calculations.
Engulfing Pattern Indicator Table
Indicator Categories: | Chart & Classic MT4 Indicators Candle Sticks MT4 Indicators Educational MT4 Indicators |
Platforms: | MetaTrader 4 Indicators |
Trading Skills: | Elementary |
Indicator Types: | Leading MT4 Indicators Reversal MT4 Indicators |
Timeframe: | Multi-Timeframe MT4 Indicators |
Trading Style: | Day Trading MT4 Indicators Intraday MT4 Indicators Scalper MT4 Indicators |
Trading Instruments: | Binary Options MT4 Indicators Indices Market MT4 Indicators Cryptocurrency MT4 Indicators Forex MT4 Indicators |
How the Engulfing Pattern Indicator Works
The Engulfing Indicator operates based on candlestick patterns, displaying bullish engulfing patterns in blue and bearish engulfing patterns in red on the chart.
This indicator helps traders easily identify engulfing patterns by precisely displaying these patterns.
Bullish Pattern of the Engulfing Indicator
The Engulfing Pattern Indicator shows a bullish pattern when it forms below two moving averages with periods of (5,20).
It identifies a bullish pattern when the candle's opening price is lower than the previous bearish candle's closing price, and its closing price is higher than the last bearish candle's.

Bearish Pattern of the Engulfing Indicator
When the pattern forms above the moving averages, with the opening price of the candle being higher than the opening price of the previous bullish candle and the closing price of the candle being lower than the closing price of the last bullish candle, it is considered a bearish engulfing pattern and is displayed on the chart.

Engulfing Indicator Settings
- Fast MA Period: Set the fast-moving average period;
- Slow MA Period: Set the slow-moving average period;
- Bearish Engulfing Color: Set the color for bearish engulfing;
- Engulfing Piercing Color: Set the color for bullish engulfing.
Conclusion
The Engulfing Pattern MT4 Candl Estick Indicator is highly suitable for beginner traders and those looking to identify engulfing patterns. It easily displays both bullish and bearish engulfing patterns on the chart, helping traders accurately identify these patterns.
Engulfing Pattern Meta MT4 PDF
Engulfing Pattern Meta MT4 PDF
Click to download Engulfing Pattern Meta MT4 PDFDoes the Engulfing Pattern (Engulfing) work in all markets?
The engulfing pattern applies to all financial markets, including stock markets, forex, and cryptocurrencies. This pattern generally works based on price behaviour and candlestick patterns, which can be observed in any market.
What is the Engulfing Pattern Indicator?
This indicator displays engulfing patterns for traders on the chart. The patterns are divided into two types: bullish and bearish, and they indicate a change in price trend. A bullish pattern forms when a large candle completely engulfs the previous candle, and a bearish pattern forms when a large candle completely covers the previous one.


