![Execute Line Indicator for MT4 Download – Free – [TradingFinder]](https://cdn.tradingfinder.com/image/591019/13-231-en-execute-line-mt4-01.webp)
![Execute Line Indicator for MT4 Download – Free – [TradingFinder] 0](https://cdn.tradingfinder.com/image/591019/13-231-en-execute-line-mt4-01.webp)
![Execute Line Indicator for MT4 Download – Free – [TradingFinder] 1](https://cdn.tradingfinder.com/image/591033/13-231-en-execute-line-mt4-02.webp)
![Execute Line Indicator for MT4 Download – Free – [TradingFinder] 2](https://cdn.tradingfinder.com/image/591034/13-231-en-execute-line-mt4-03.webp)
![Execute Line Indicator for MT4 Download – Free – [TradingFinder] 3](https://cdn.tradingfinder.com/image/591030/13-231-en-execute-line-mt4-04.webp)
The Execute Line Indicator, using the Moving Average line, plays an important role in identifying trends and making trading decisions.
This trading tool is designed based on the slope of the Moving Average and, with simple color changes, clearly displays bullish or bearish market conditions.
The clarity of its signals makes this tool suitable for both beginners and professionals.
Execute Line Indicator Specification Table
The table below shows the specifications of the Execute Line Indicator.
Indicator Categories: | Signal & Forecast MT4 Indicators Trading Assist MT4 Indicators Moving Average MT4 Indicators |
Platforms: | MetaTrader 4 Indicators |
Trading Skills: | Elementary |
Indicator Types: | Reversal MT4 Indicators |
Timeframe: | Multi-Timeframe MT4 Indicators |
Trading Style: | Day Trading MT4 Indicators Scalper MT4 Indicators Swing Trading MT4 Indicators |
Trading Instruments: | Stock Market MT4 Indicators Cryptocurrency MT4 Indicators Forex MT4 Indicators |
Execute Line Indicator at a Glance
The Execute Line Indicator draws a Moving Average line and changes its color to yellow or purple to determine the trend direction. A change to yellow indicates the beginning of a bullish trend, while a change to purple indicates the start of a bearish trend.
Buy Position
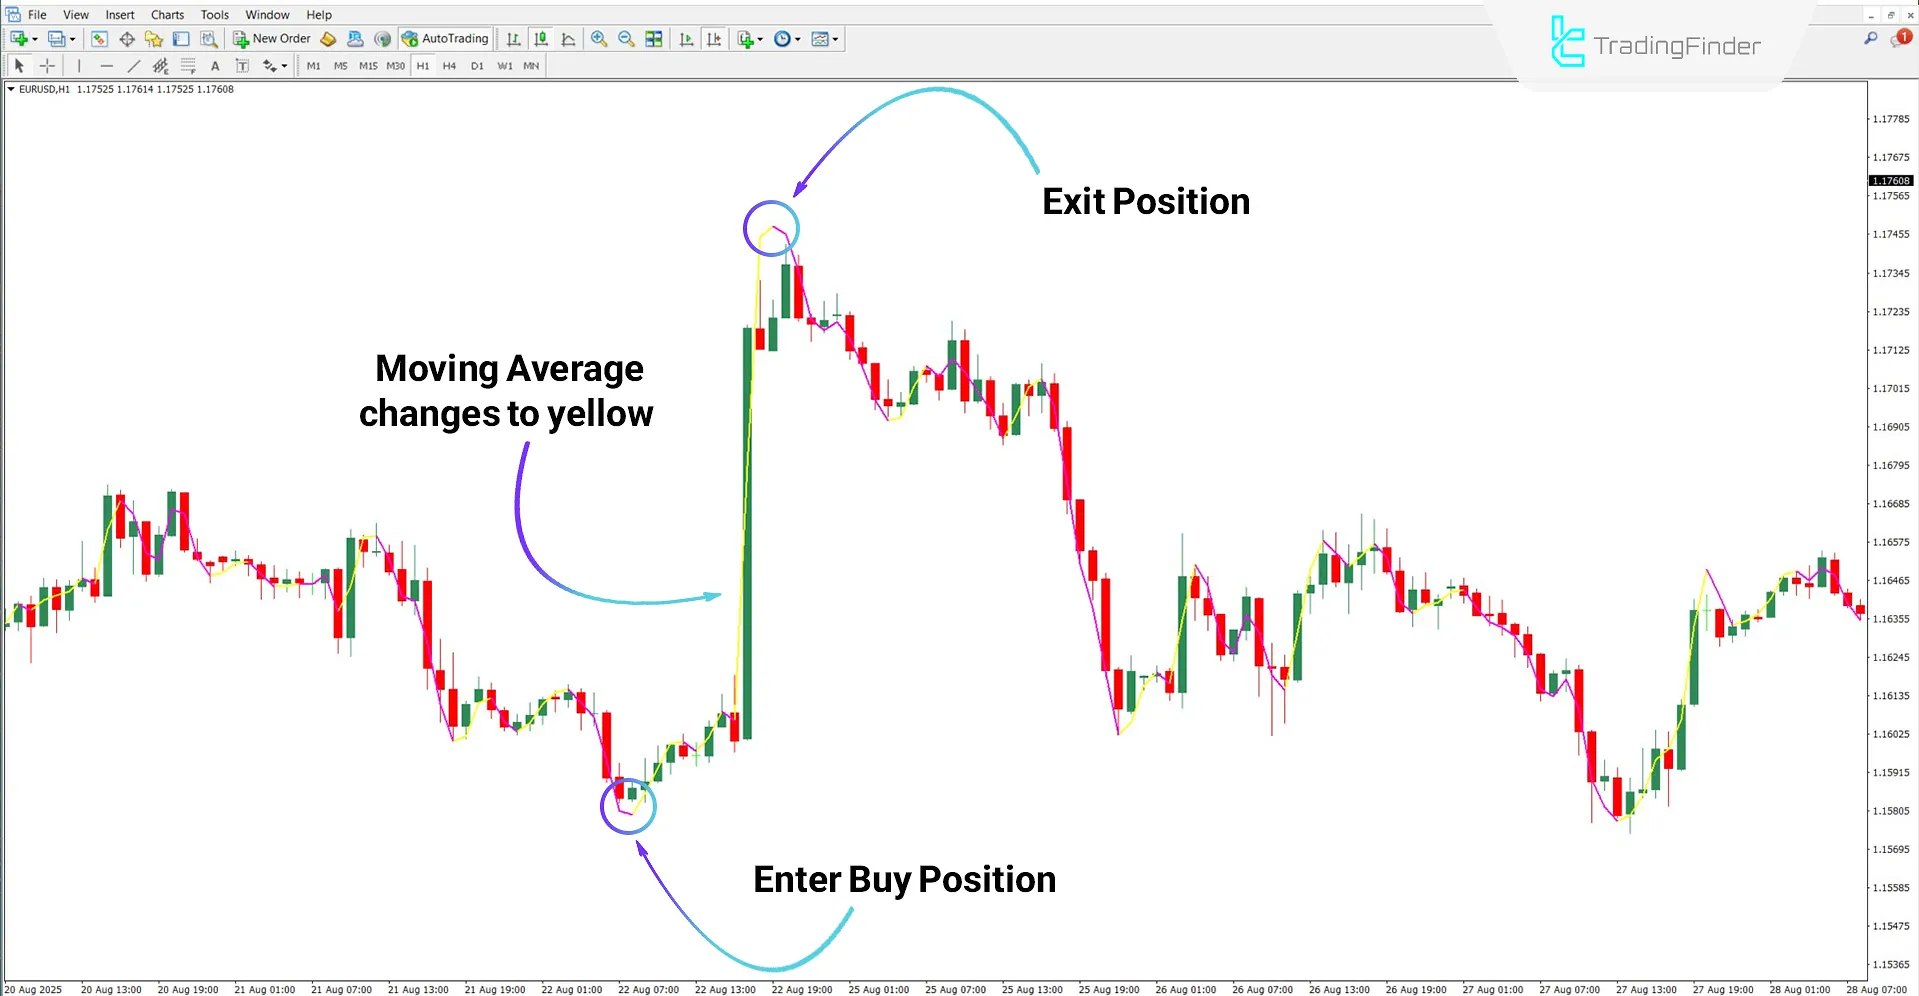
According to the EUR/USD chart on the 1-hour timeframe, when the Moving Average (MA) changes to yellow, it indicates a bullish trend.
Thus, traders can enter a buy position as soon as the line turns yellow and exit the trade when the color changes again.

Sell Position
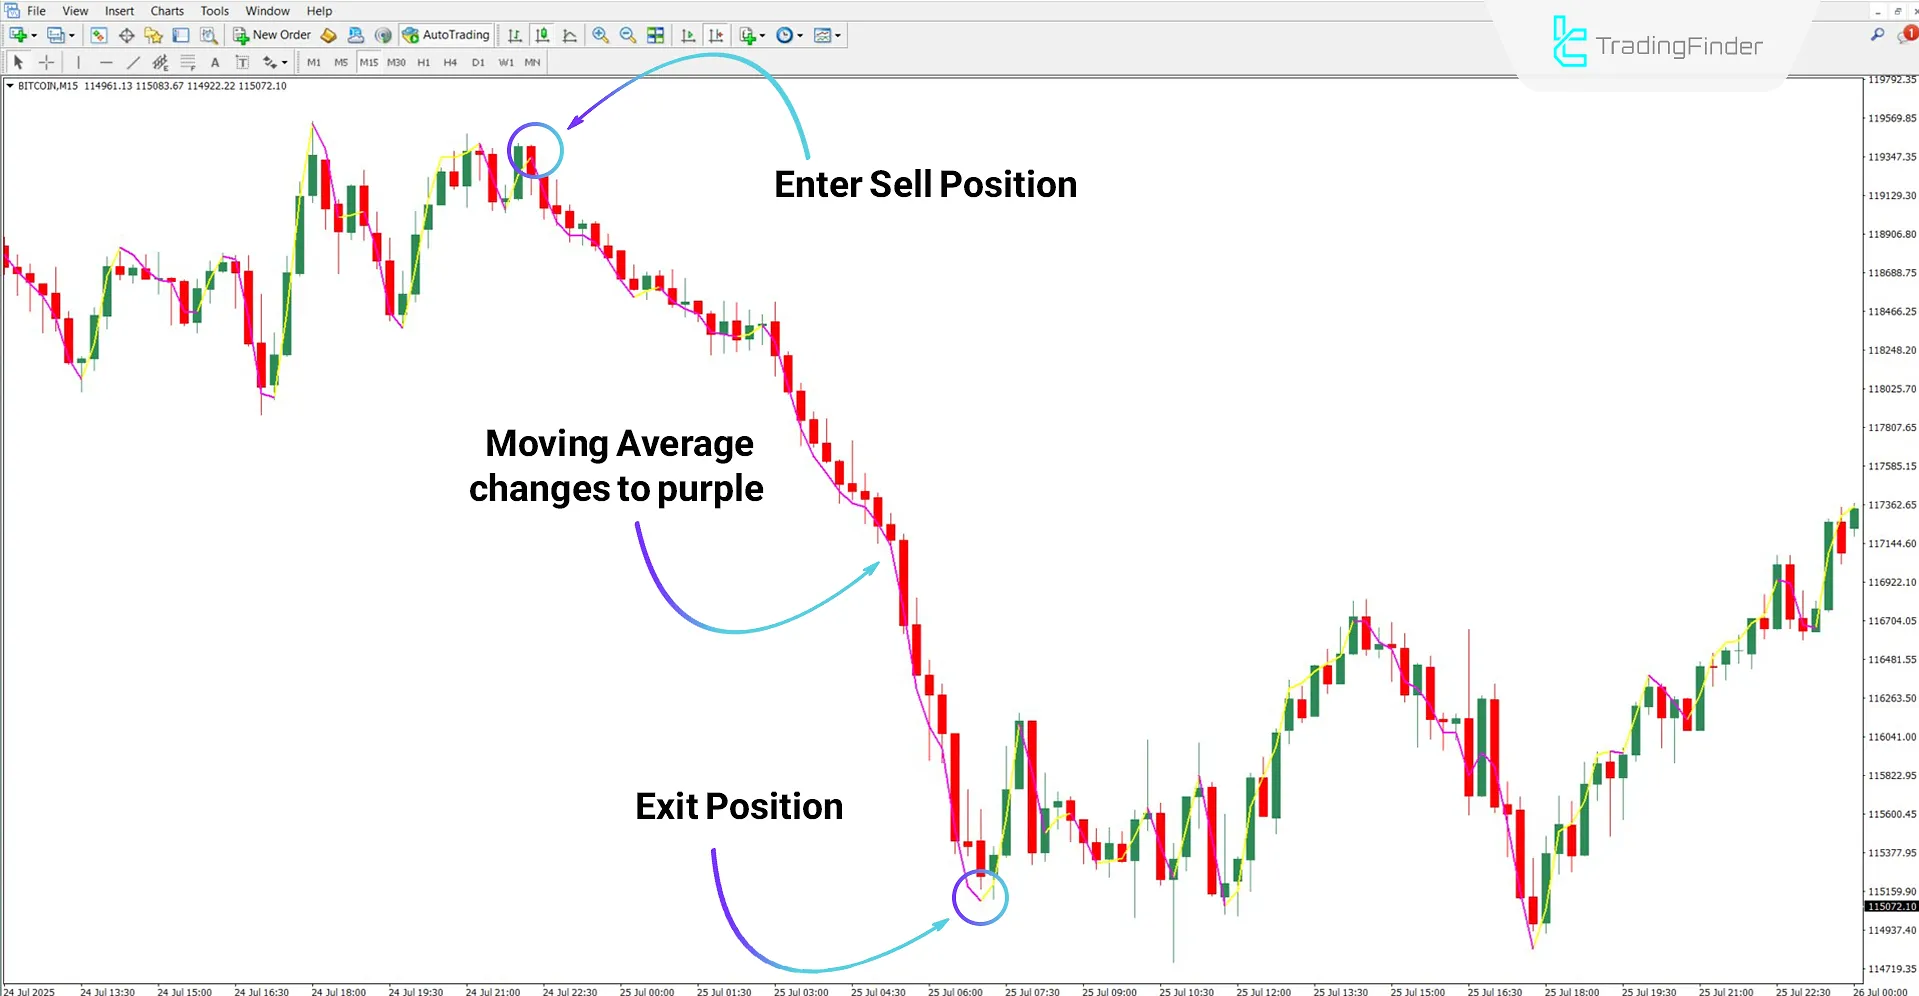
Based on the Bitcoin (BTC) cryptocurrency, chart on the 15-minute timeframe, the start of a bearish trend is confirmed when the Moving Average line turns purple.
In this scenario, traders can open a sell position at the initial color change (to purple) and exit once the color changes again.

Execute Line Indicator Settings
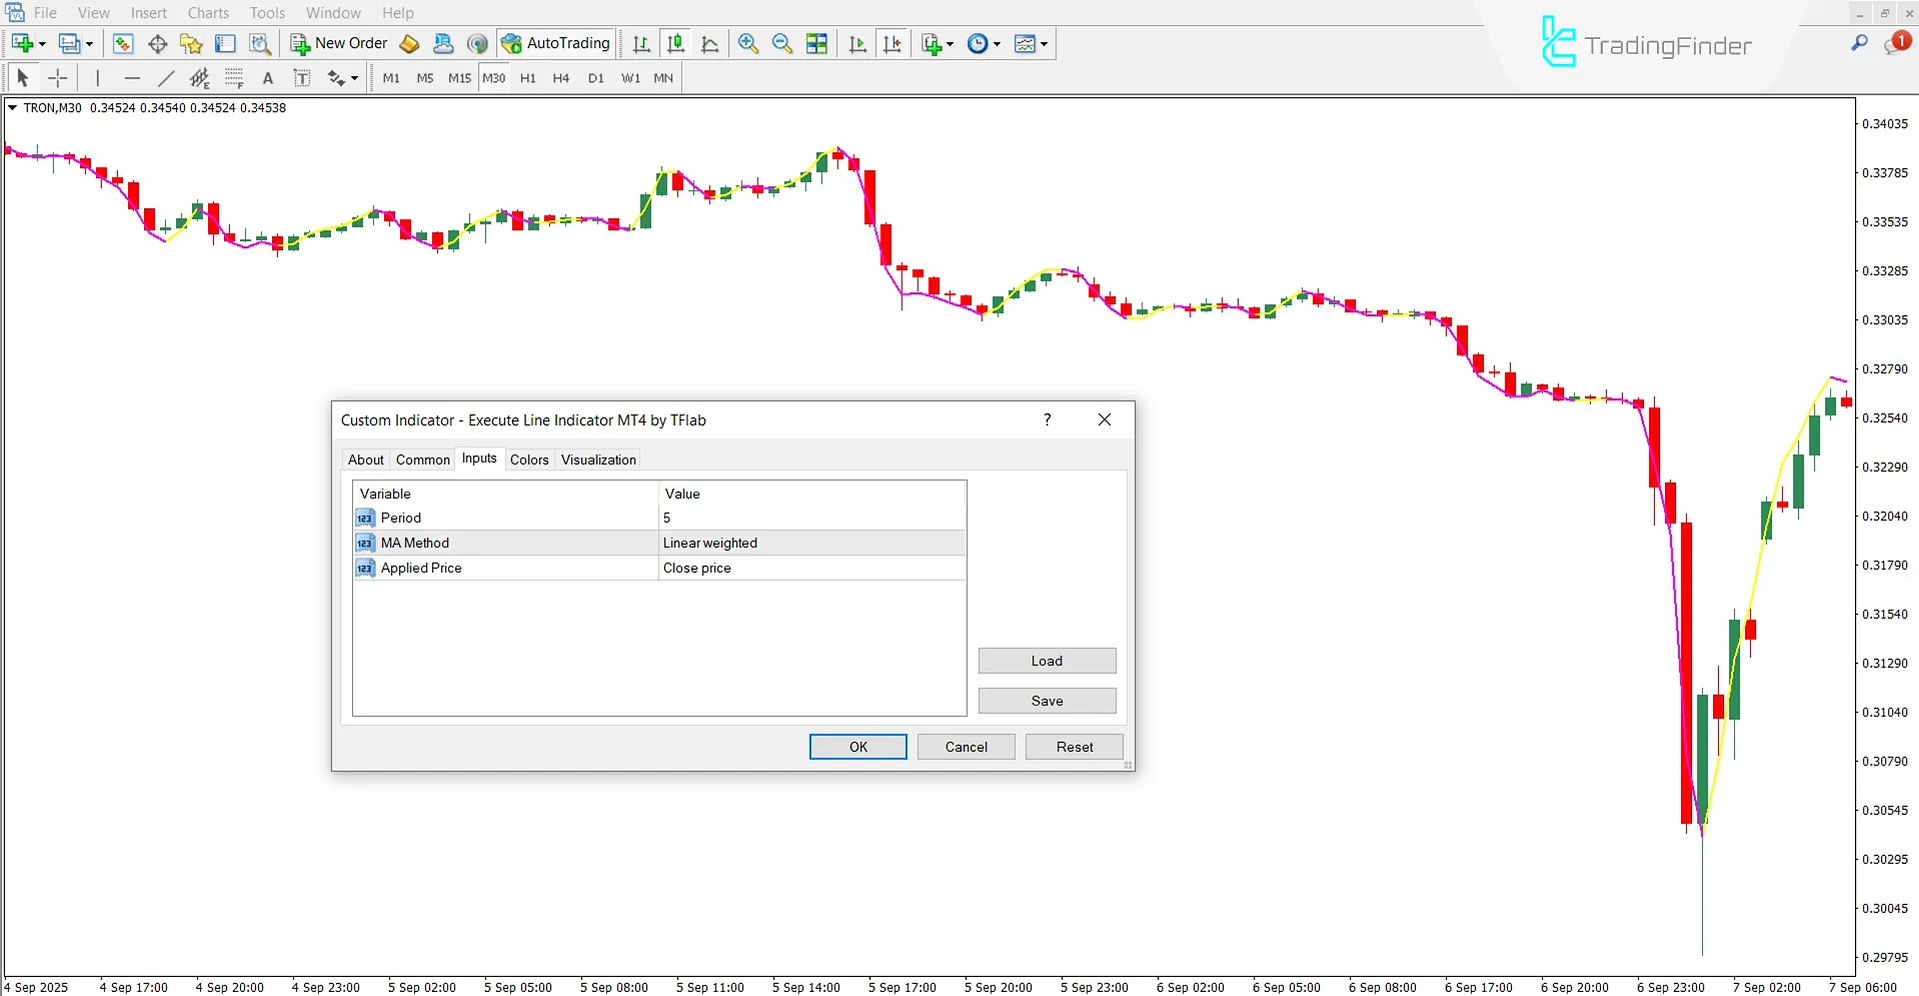
The customizable settings of the Execute Line Indicator are as follows:

- Period: Calculation period of the Moving Average
- MA Method: Type of Moving Average calculation
- Applied Price: Reference price type for calculations
Conclusion
The Execute Line Indicator is a practical tool for identifying market trend direction based on the slope of the Moving Average. Trading signals are generated according to the color changes of the MA line.
When the MA turns yellow, it indicates the start of a bullish trend, while a change to purple signals a bearish trend.
Execute Line Indicator for MT4 PDF
Execute Line Indicator for MT4 PDF
Click to download Execute Line Indicator for MT4 PDFCan beginner traders use this tool?
Yes, the Execute Line Indicator is suitable for beginners due to its clarity in showing market movements.
Can this indicator be used on short-term timeframes?
Yes, the Execute Line Indicator is multi-timeframe and can be applied across all periods.


