![Fibonacci Progression with Breaks Indicator MT4 Download – Free – [TFlab]](https://cdn.tradingfinder.com/image/474462/13-176-en-fibonacci-progression-with-breaks-mt4-01.webp)
![Fibonacci Progression with Breaks Indicator MT4 Download – Free – [TFlab] 0](https://cdn.tradingfinder.com/image/474462/13-176-en-fibonacci-progression-with-breaks-mt4-01.webp)
![Fibonacci Progression with Breaks Indicator MT4 Download – Free – [TFlab] 1](https://cdn.tradingfinder.com/image/474460/13-176-en-fibonacci-progression-with-breaks-mt4-02.webp)
![Fibonacci Progression with Breaks Indicator MT4 Download – Free – [TFlab] 2](https://cdn.tradingfinder.com/image/474464/13-176-en-fibonacci-progression-with-breaks-mt4-03.webp)
![Fibonacci Progression with Breaks Indicator MT4 Download – Free – [TFlab] 3](https://cdn.tradingfinder.com/image/474461/13-176-en-fibonacci-progression-with-breaks-mt4-04.webp)
Fibonacci Progression with Breaks Indicator analyzes price movement step-by-step using the logic of the Fibonacci number sequence.
This trading tool starts from a pivot point and displays price levels based on Fibonacci intervals in the direction of the trend.
Moreover, this indicator issues buy and sell trade signals using green and red arrow markers.
Fibonacci Progression with Breaks Indicator Specifications Table
The features of the Fibonacci Levels Progression with Breaks Indicator are listed in the table below.
Indicator Categories: | Signal & Forecast MT4 Indicators Trading Assist MT4 Indicators Levels MT4 Indicators |
Platforms: | MetaTrader 4 Indicators |
Trading Skills: | Elementary |
Indicator Types: | Breakout MT4 Indicators Reversal MT4 Indicators |
Timeframe: | Multi-Timeframe MT4 Indicators |
Trading Style: | Day Trading MT4 Indicators Scalper MT4 Indicators Swing Trading MT4 Indicators |
Trading Instruments: | Stock Market MT4 Indicators Cryptocurrency MT4 Indicators Forex MT4 Indicators |
Overview of the Fibonacci Progression with Breaks Indicator
Each time the price crosses a level plotted by the indicator, a new stage begins. Unless a structural breakout occurs, no further levels will be drawn.
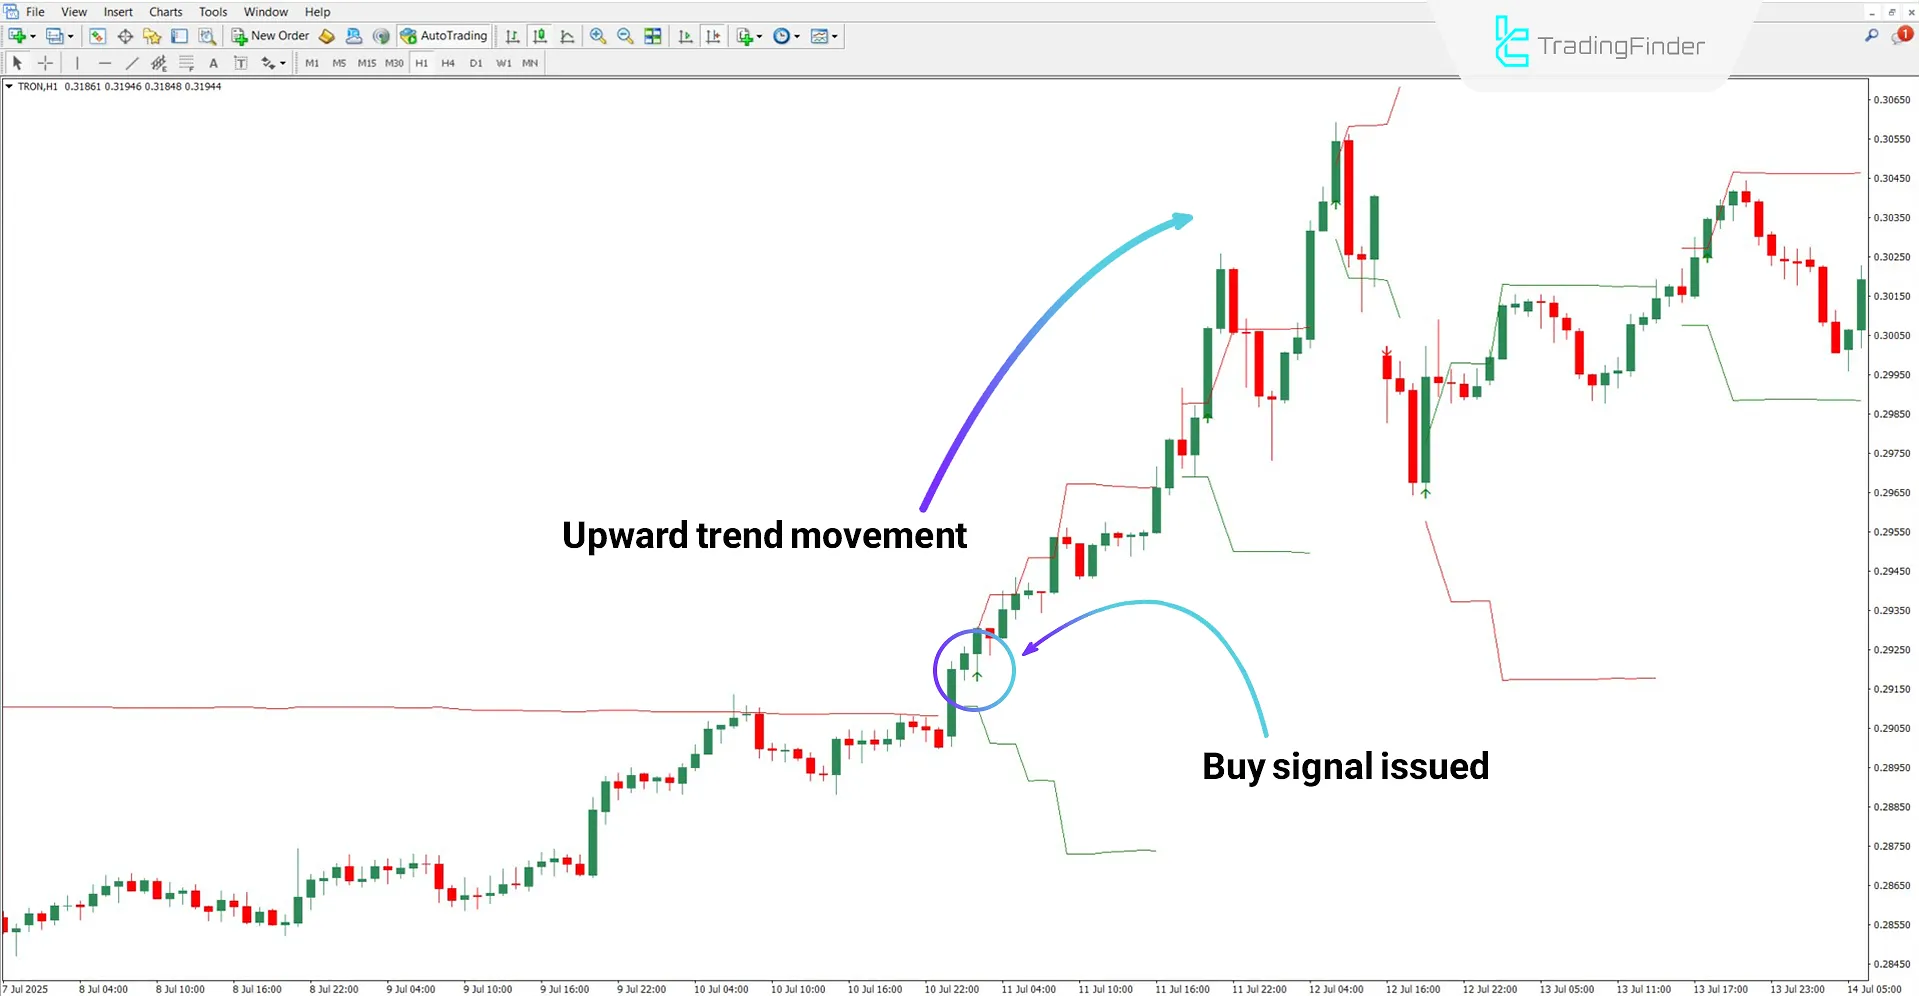
Accordingly, when the price breaks through the levels, the indicator marks suitable trade entry points using green and red arrows.
Buy Signal
Based on the 1-hour timeframe analysis of the cryptocurrency chart Tron (TRX), the Fibonacci Progression with Breaks Indicator issued a buy signal triggered by price breaking above Fibonacci levels.
In such a setup, a long position can be held until the appearance of a red arrow.

Sell Signal
Based on the AUD/USD 30 minute chart, the price reached the upper Fibonacci structure zone and then broke the support structure with a strong bearish candle. This breakdown was detected and marked with a red arrow by the indicator.

Fibonacci Progression with Breaks Indicator Settings
The following are the available settings of the Fibonacci Progression with Breaks Indicator:

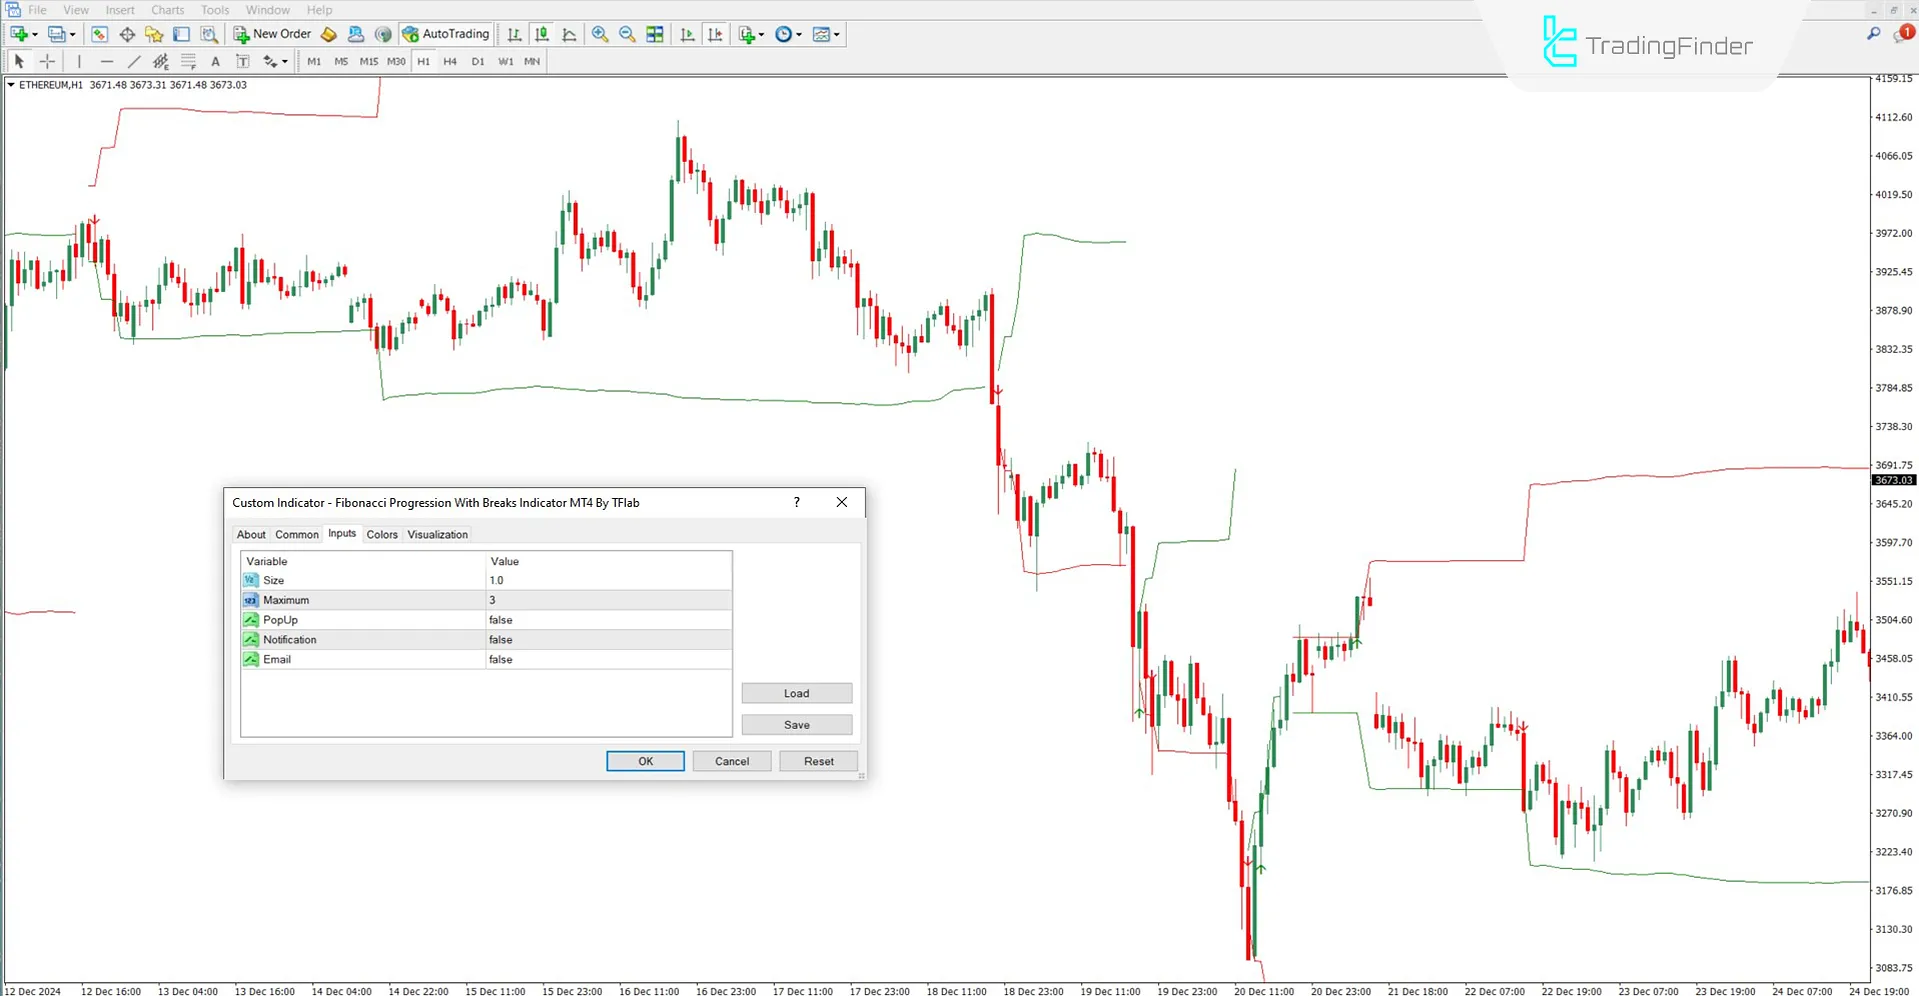
- Size: Zoom level of the drawn Fibonacci levels
- Maximum: Maximum number of Fibonacci levels
- PopUp: Enable/disable visual alerts
- Notification: Enable/disable internal notifications
- Email: Enable email alerts for signals
Conclusion
The Fibonacci Levels Progression with Breaks Indicator is a practical tool for identifying price movement stages using Fibonacci sequences and structural breakouts.
It identifies target levels, retracement zones, and trend continuation areas, and issues buy and sell signals using arrow markers when favorable conditions are met.
Fibonacci Progression With Breaks MT4 PDF
Fibonacci Progression With Breaks MT4 PDF
Click to download Fibonacci Progression With Breaks MT4 PDFDo I need to manually draw Fibonacci levels to use this indicator?
No, the Fibonacci Progression with Breaks Indicator automatically analyzes Fibonacci ratios and plots the levels based on its internal settings.
Does this tool also issue signals on higher timeframes?
Yes, the Fibonacci Progression with Breaks Indicator works across all timeframes and generates signals accordingly.
Nice and clear to understand


