![Flat Market Indicator in MetaTrader 4 Download – [TradingFinder]](https://cdn.tradingfinder.com/image/552369/11-103-en-flat-market-mt4-01.webp)
![Flat Market Indicator in MetaTrader 4 Download – [TradingFinder] 0](https://cdn.tradingfinder.com/image/552369/11-103-en-flat-market-mt4-01.webp)
![Flat Market Indicator in MetaTrader 4 Download – [TradingFinder] 1](https://cdn.tradingfinder.com/image/552363/11-103-en-flat-market-mt4-02.webp)
![Flat Market Indicator in MetaTrader 4 Download – [TradingFinder] 2](https://cdn.tradingfinder.com/image/552362/11-103-en-flat-market-mt4-03.webp)
![Flat Market Indicator in MetaTrader 4 Download – [TradingFinder] 3](https://cdn.tradingfinder.com/image/552364/11-103-en-flat-market-mt4-04.webp)
The Flat Market Indicator is a practical oscillator for technical traders, designed to identify range areas and detect price breakouts from these zones, signaling the start of a market trend.
This indicator is designed for the MetaTrader 4 platform and uses a histogram along with two calculated lines to show whether the market is in a ranging or trending condition.
When the histogram moves between the two oscillator lines, it indicates a ranging market. Once it breaks out of these boundaries, it signals the formation of a trending market.
Flat Market Indicator Table
The following section contains information about the Flat Market Indicator:
Indicator Categories: | Oscillators MT4 Indicators Currency Strength MT4 Indicators Trading Assist MT4 Indicators |
Platforms: | MetaTrader 4 Indicators |
Trading Skills: | Elementary |
Indicator Types: | Range MT4 Indicators Trend MT4 Indicators Lagging MT4 Indicators |
Timeframe: | Multi-Timeframe MT4 Indicators |
Trading Style: | Day Trading MT4 Indicators Intraday MT4 Indicators Scalper MT4 Indicators |
Trading Instruments: | Share Stocks MT4 Indicators Indices Market MT4 Indicators Cryptocurrency MT4 Indicators Forex MT4 Indicators |
Flat Market Indicator at a Glance
The Flat Market indicator is an analytical histogram that shows traders whether the market is ranging or trending.
When the histogram remains between the two oscillator lines, the market is in a range condition. Once the histogram breaks out of this area, it signals the start of a new trend to forex traders.
Traders can use their trading strategies to identify buy or sell opportunities as soon as the histogram exits the range.
Indicator in Uptrend
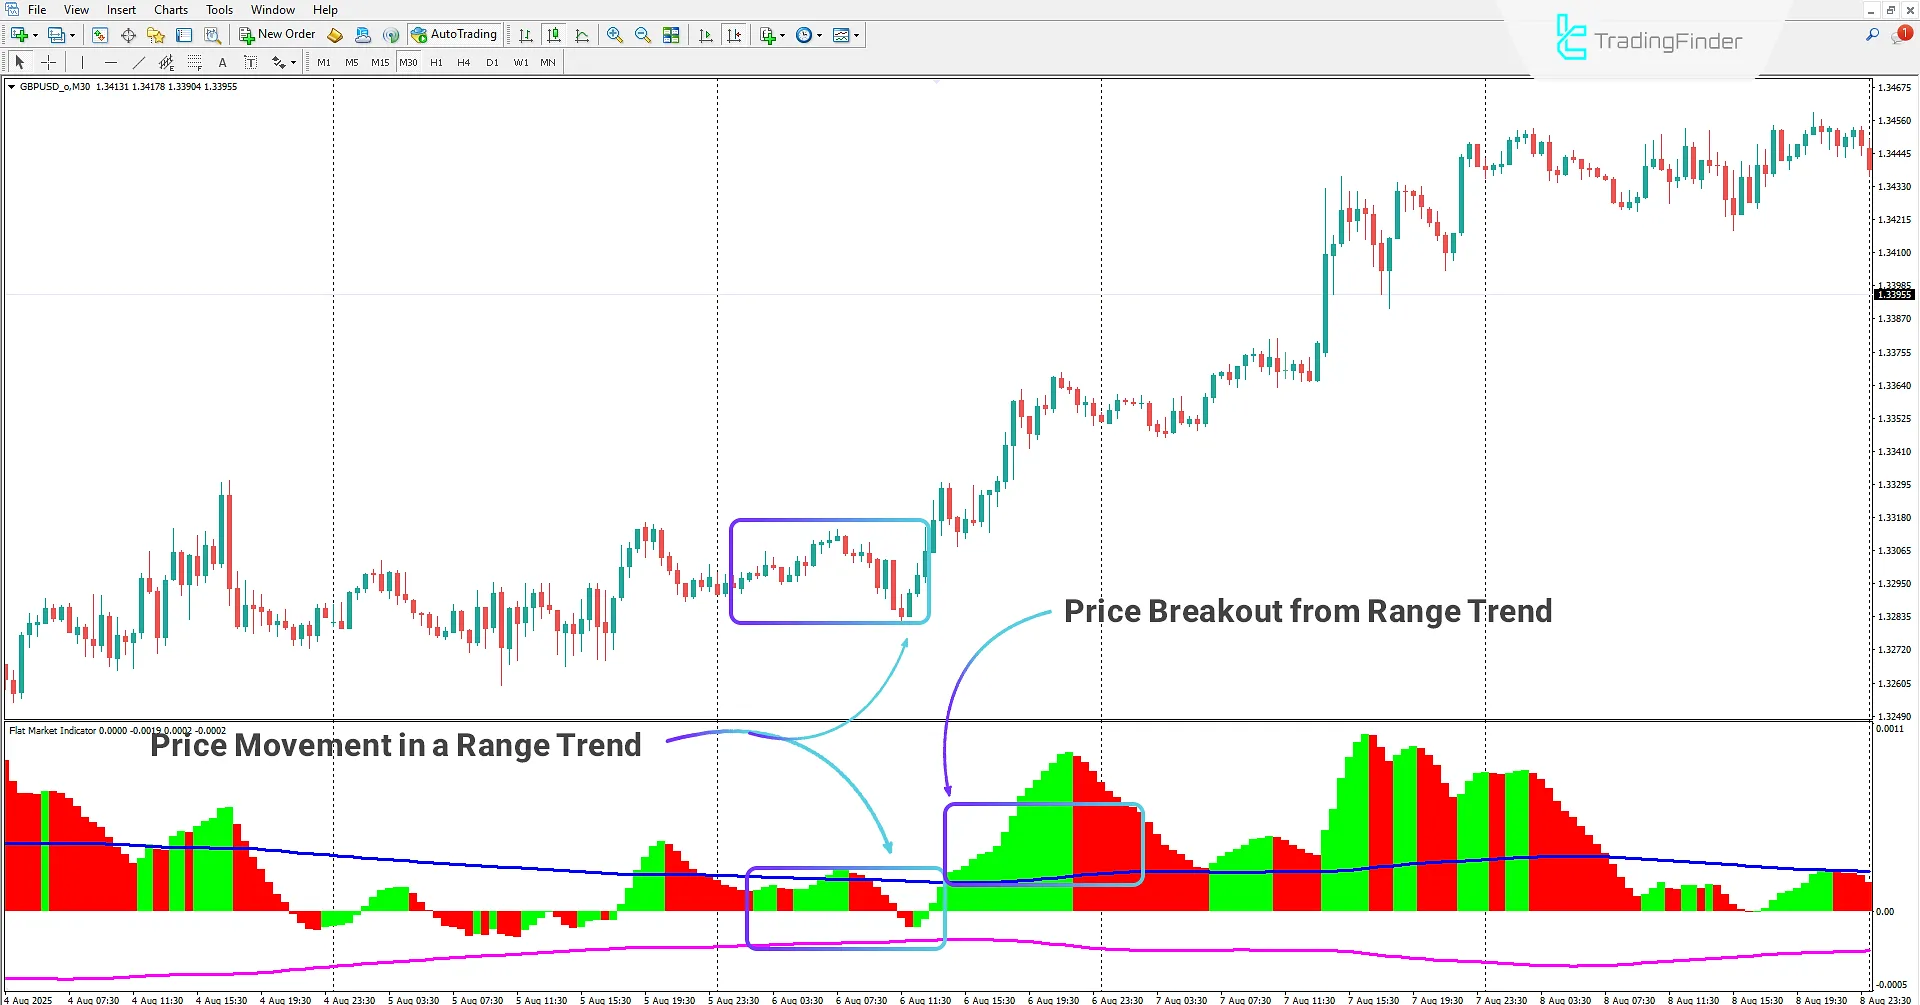
On the 30-minute GBPUSD chart, when the Flat Market Indicator is applied, a histogram panel is displayed on the chart.
When the price moves within a range, traders can wait for the histogram to break out of the oscillator boundaries.
If the histogram moves upward and exits the upper band, it signals the beginning of an uptrend, which can be used to enter a buy position.

Indicator in Downtrend
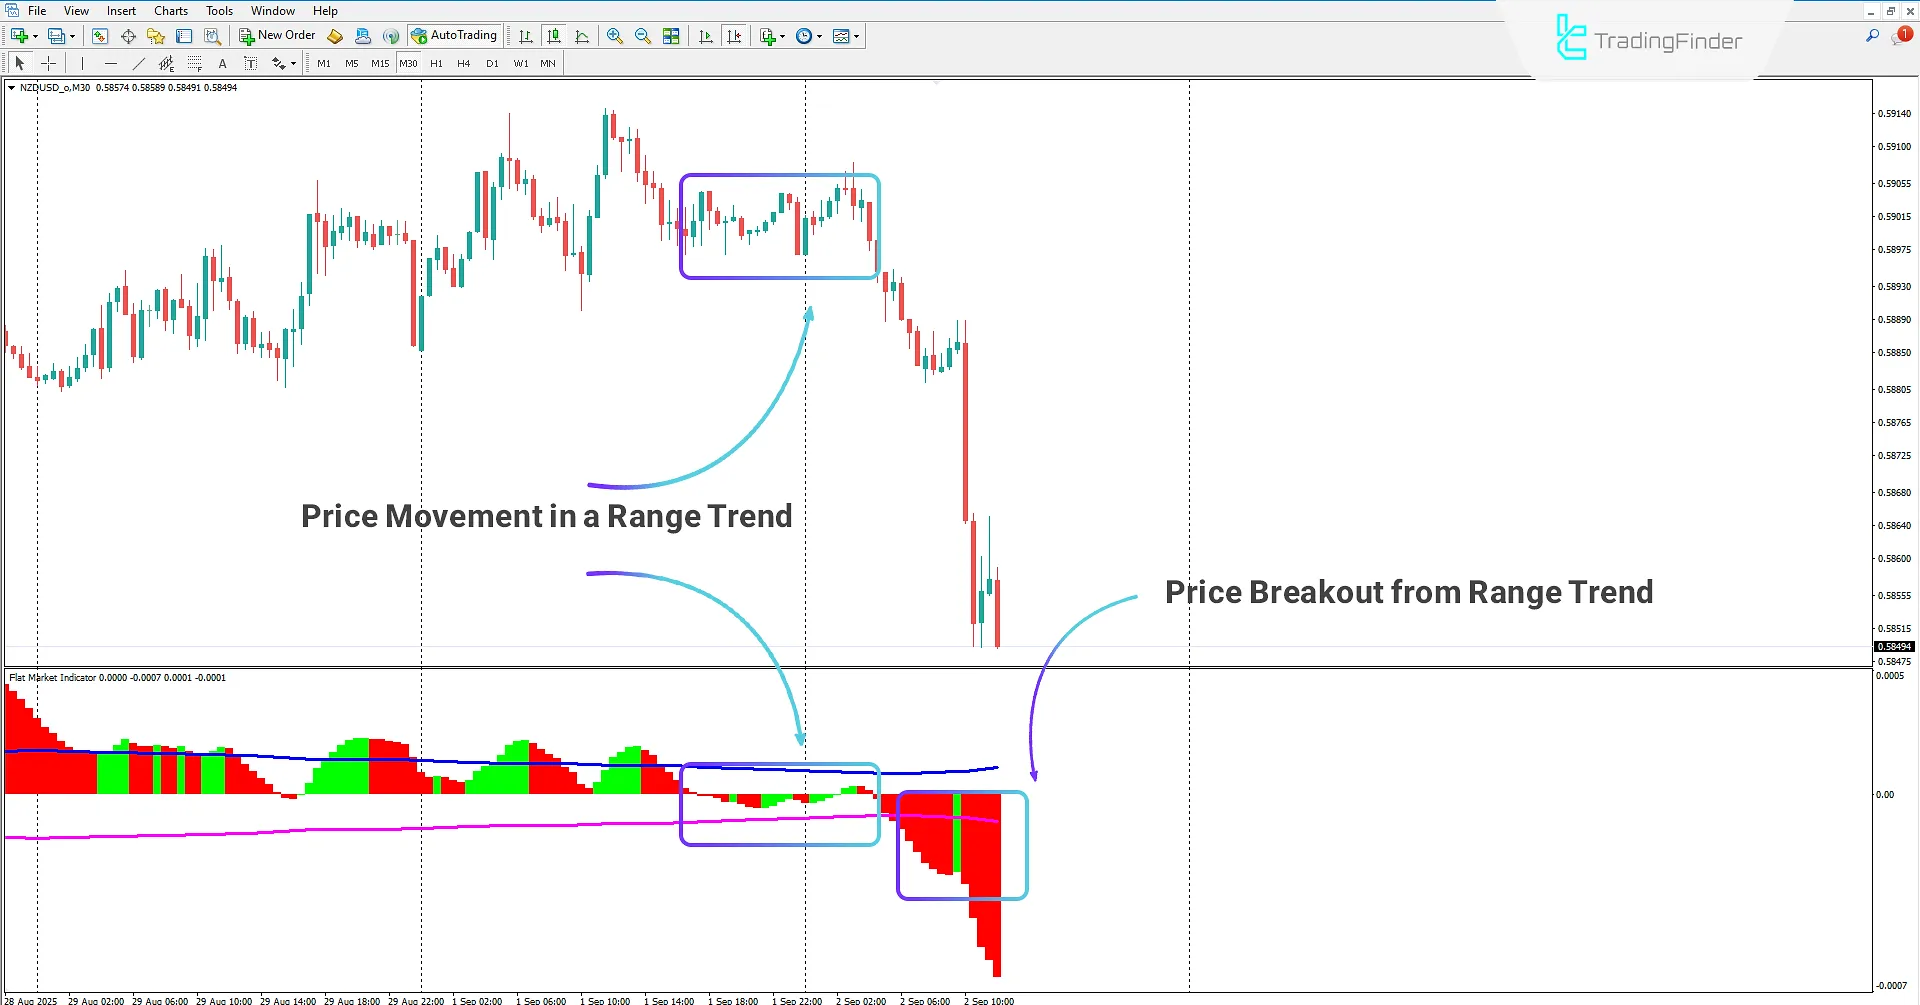
On the 30-minute NZDUSD chart, after moving within a range, the price shifts into a downtrend.
By applying the Flat Market Indicator, traders can identify the range phases, and when the histogram exits the range and crosses below the lower band, it indicates the start of a downtrend, offering an opportunity for entering a sell position.

Flat Market Indicator Settings
The following section contains the settings of the Flat Market Indicator:

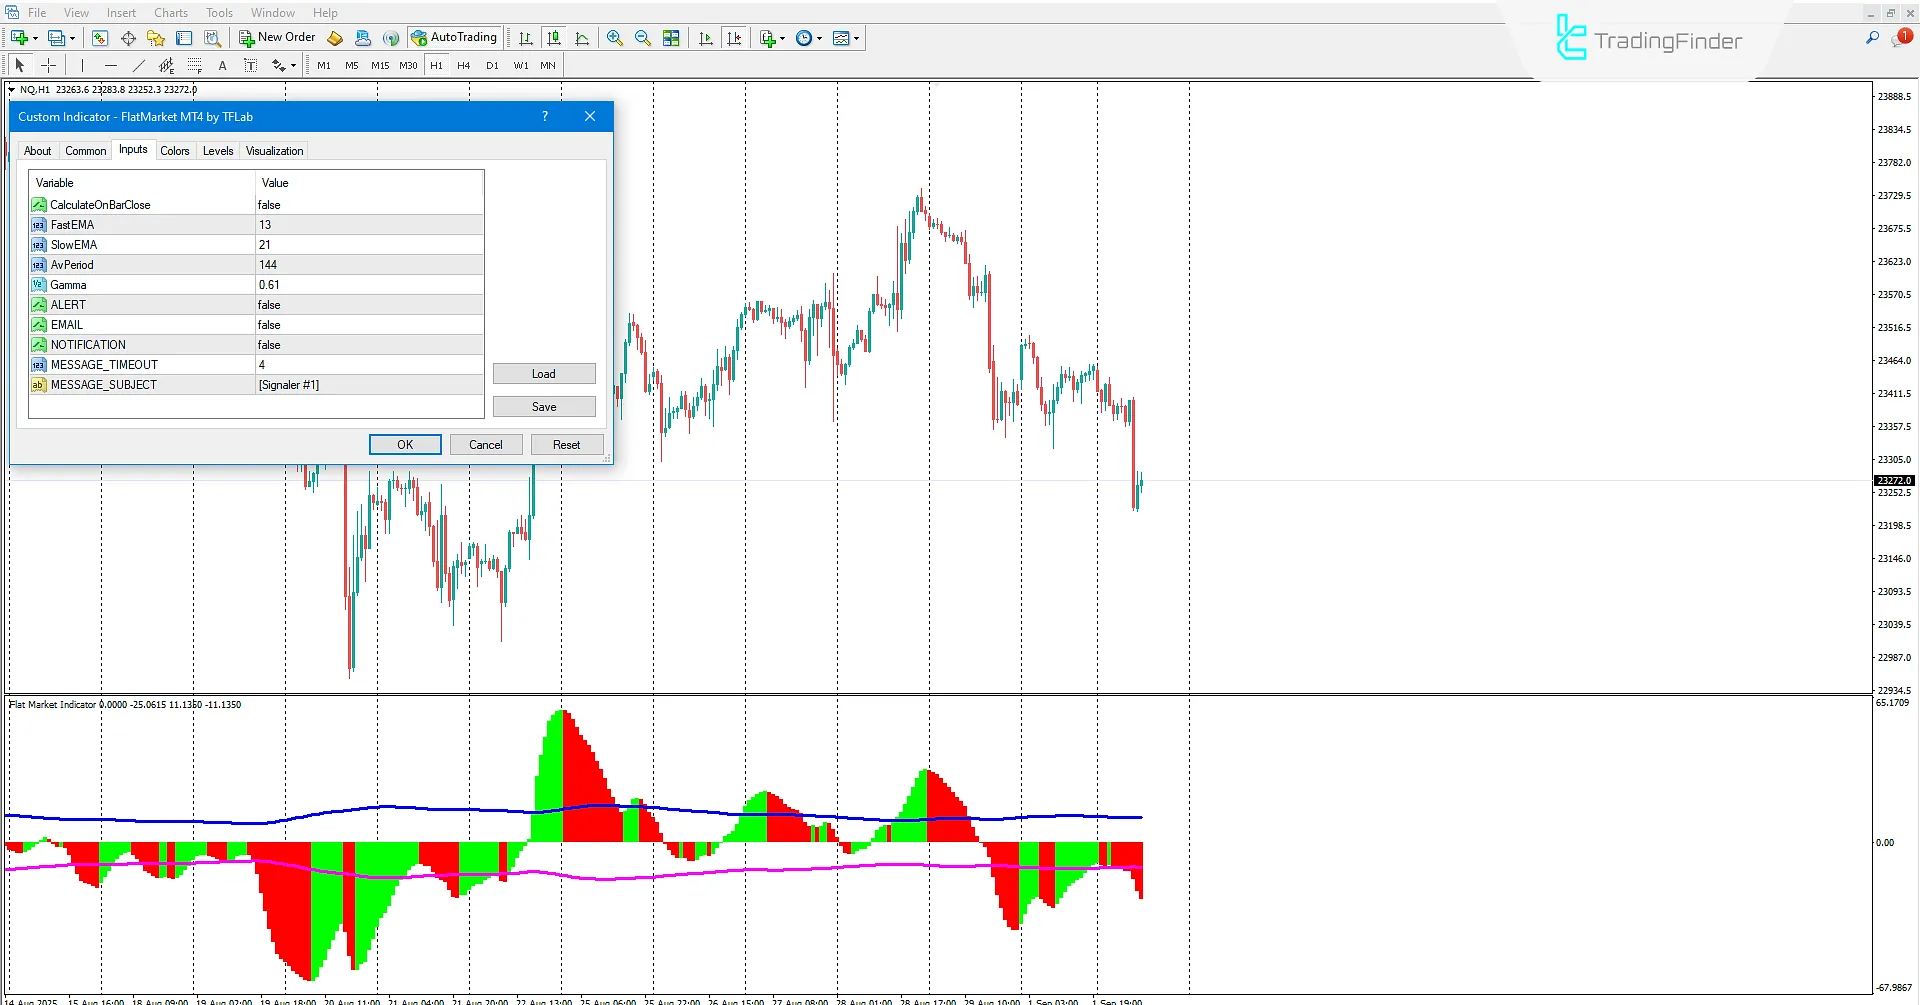
- Calculate On Bar Close: By default, this is set to the close of candles (Close). If set to False, the indicator calculates based on the median price (High + Low / 2);
- Fast EMA: Period setting for the fast or short-term moving average;
- Slow EMA: Period setting for the slow or long-term moving average;
- Av Period: Calculation length for the average line of the range highs and lows. Increasing this value includes more candles in the calculation, resulting in smoother lines;
- Gamma: Distance between the blue line and the purple line. A higher value creates a wider range zone, while a lower value generates quicker range breakout signals;
- ALERT: Enable/disable alerts when the histogram exits the range;
- EMAIL: Enable/disable sending alerts to mailbox when the histogram exits the range;
- NOTIFICATION: Enable/disable push notifications to mobile when the histogram exits the range;
- MESSAGE_TIMEOUT: Time interval between alert messages;
- MESSAGE_SUBJECT: Custom subject for alerts or messages.
Conclusion
The Flat Market Indicator is a specialized tool for detecting ranging conditions in the market.
Traders can combine this indicator with their technical analysis to identify range zones and, upon recognizing the start of new trends, enter buy or sell trades accordingly.
Flat Market Indicator in MetaTrader 4 PDF
Flat Market Indicator in MetaTrader 4 PDF
Click to download Flat Market Indicator in MetaTrader 4 PDFWhat is the Flat Market Indicator?
It is a specialized analytical oscillator that helps traders detect ranging conditions as well as price breakouts, signaling the beginning of new trends.
What components make up this indicator?
It consists of a histogram and two calculated lines that show whether the market is ranging or trending.


