![Forex MTN Indicator for MetaTrader 4 – Free – [TradingFinder]](https://cdn.tradingfinder.com/image/421516/2-74-en-forex-mtn-mt4-1.webp)
![Forex MTN Indicator for MetaTrader 4 – Free – [TradingFinder] 0](https://cdn.tradingfinder.com/image/421516/2-74-en-forex-mtn-mt4-1.webp)
![Forex MTN Indicator for MetaTrader 4 – Free – [TradingFinder] 1](https://cdn.tradingfinder.com/image/421514/2-74-en-forex-mtn-mt4-2.webp)
![Forex MTN Indicator for MetaTrader 4 – Free – [TradingFinder] 2](https://cdn.tradingfinder.com/image/421512/2-74-en-forex-mtn-mt4-3.webp)
On July 6, 2025, in version 2, alert/notification and signal functionality was added to this indicator
The Forex MTN Indicator is a momentum-based technical analysis tool used on the MetaTrader 4 platform. It identifies overbought and oversold zones in the market by measuring the strengths and weaknesses of momentum.
This indicator consists of histograms that generate buy and sell signals using blue and red dots, respectively.
Forex MTN Indicator Specifications Table
The key specifications of the Forex MTN Indicator are detailed in the table below:
Indicator Categories: | Oscillators MT4 Indicators Signal & Forecast MT4 Indicators Trading Assist MT4 Indicators |
Platforms: | MetaTrader 4 Indicators |
Trading Skills: | Intermediate |
Indicator Types: | Reversal MT4 Indicators |
Timeframe: | Multi-Timeframe MT4 Indicators |
Trading Style: | Intraday MT4 Indicators |
Trading Instruments: | Share Stocks MT4 Indicators Indices Market MT4 Indicators Commodity Market MT4 Indicators Stock Market MT4 Indicators Cryptocurrency MT4 Indicators Forex MT4 Indicators |
Indicator at a Glance
The Forex MTN Indicator is composed of histograms that graphically display the intensity and direction of price momentum.
When momentum reaches extreme levels, the indicator issues entry alerts via colored dots:
- +24: Indicates entry into the overbought zone with red dots
- −24: Indicates entry into the oversold zone with blue dots
Uptrend Conditions
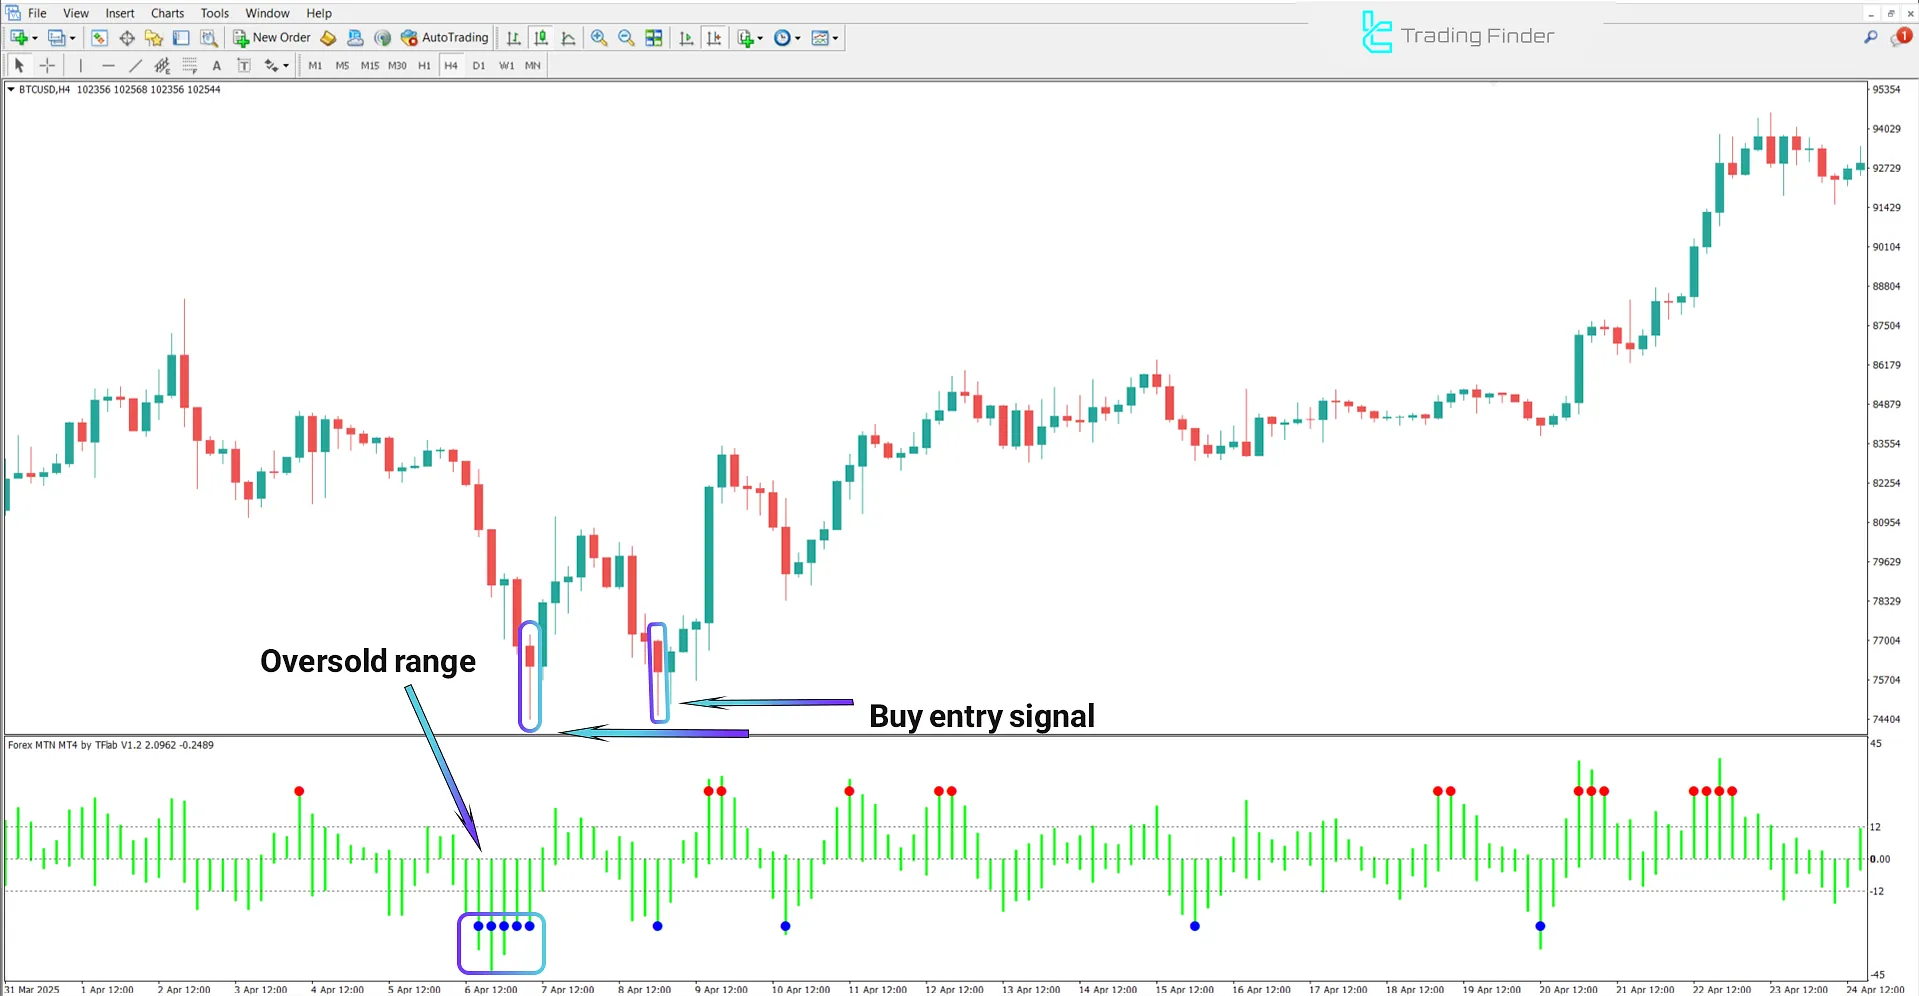
In the chart below, Bitcoin (BTCUSD) is shown in the 4-hour timeframe. When the price is in an uptrend, and the MTN histogram bars enter the oversold zone (−24 level), it signals a weakness in selling momentum.
If a blue dot simultaneously appears below the bars, it is considered a buy signal.

Downtrend Conditions
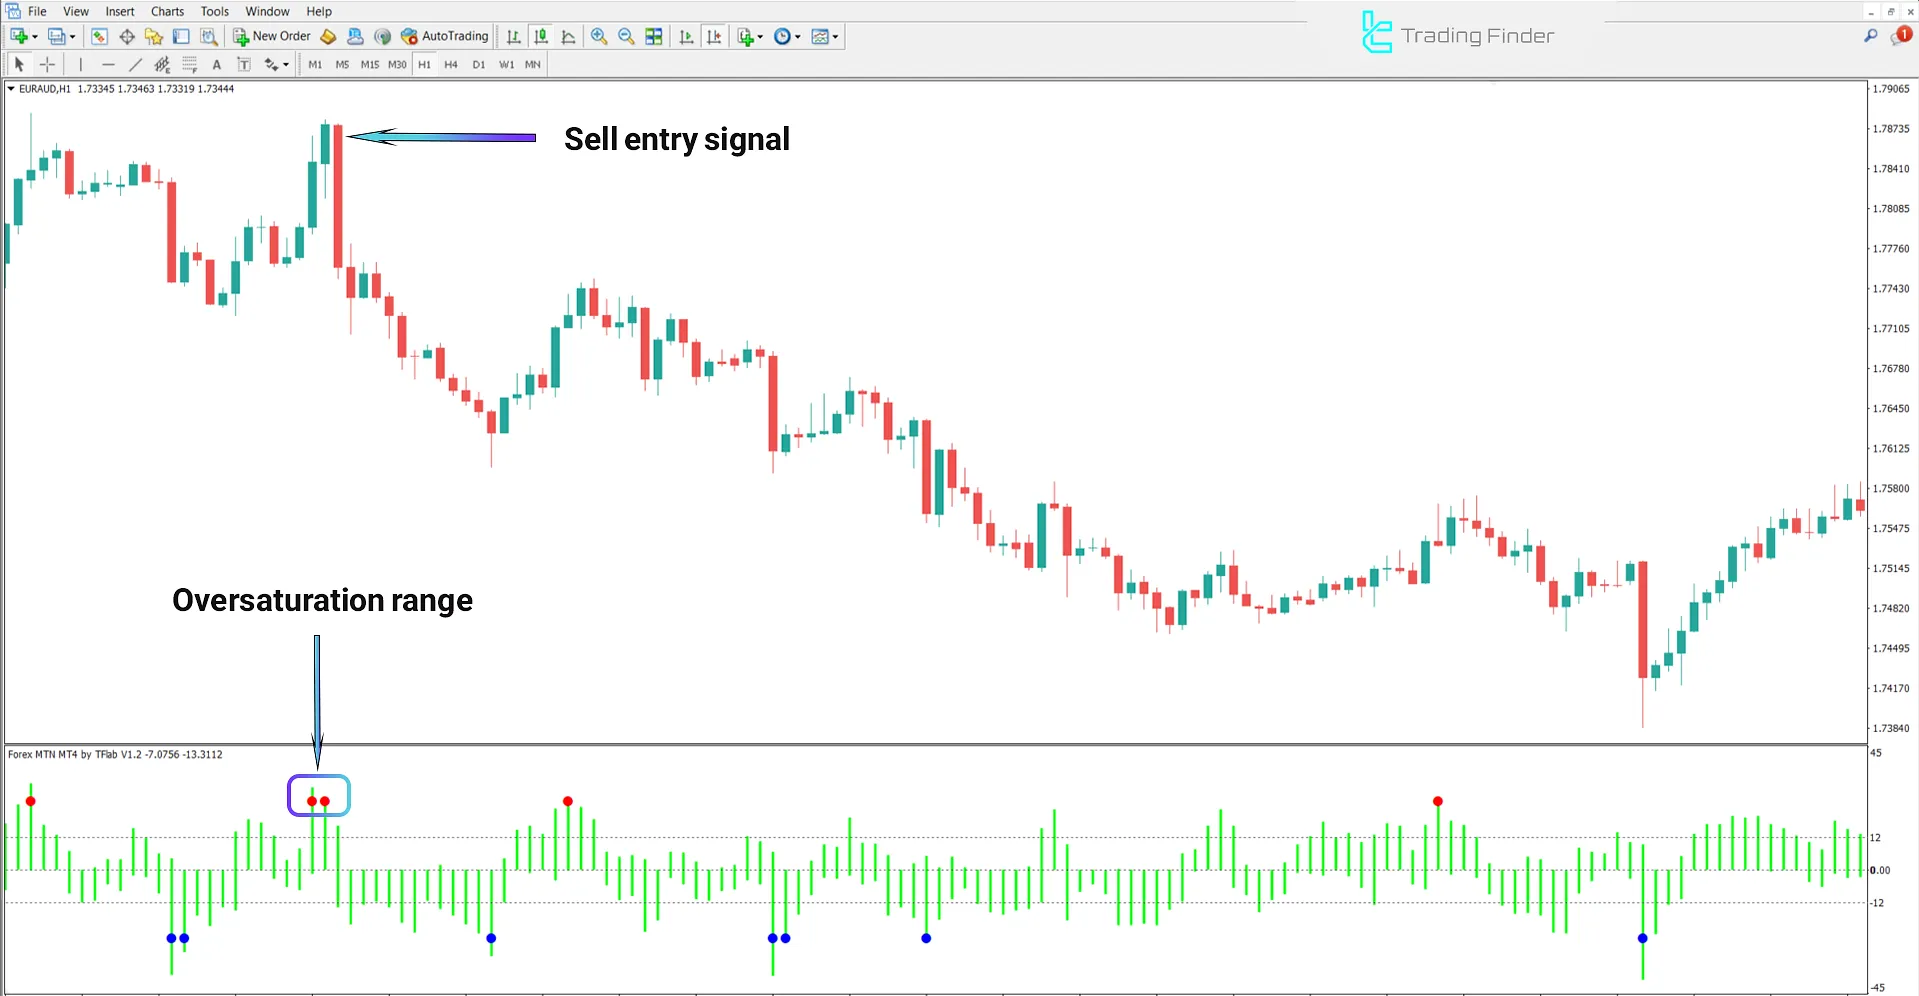
The following chart shows the EUR/AUD currency pair in the 1-hour timeframe.
When the price is in a downtrend, the histogram bars enter the overbought zone, and red dots appear above the bars, which suggests a favorable condition for entering sell trades.

Conclusion
The Forex MTN Indicator operates without any input settings, and issues signals purely based on momentum behavior and overbought/oversold levels.
Trading signals are triggered when the histogram crosses the overbought or oversold thresholds.
Does the Forex MTN Indicator allow adjustment of period or sensitivity?
No; this trading tool has no input parameters and runs with default settings.
Can the Forex MTN Indicator be used in markets other than Forex?
Yes, this oscillator is also suitable for use on commodities, indices, and cryptocurrencies.


