![Fractal Dimension Indicator MetaTrader 4 – [TFlab] - Download](https://cdn.tradingfinder.com/image/443182/2-95-en-fractal-dimension-indicator-mt4-1.webp)
![Fractal Dimension Indicator MetaTrader 4 – [TFlab] - Download 0](https://cdn.tradingfinder.com/image/443182/2-95-en-fractal-dimension-indicator-mt4-1.webp)
![Fractal Dimension Indicator MetaTrader 4 – [TFlab] - Download 1](https://cdn.tradingfinder.com/image/443192/2-95-en-fractal-dimension-indicator-mt4-2.webp)
![Fractal Dimension Indicator MetaTrader 4 – [TFlab] - Download 2](https://cdn.tradingfinder.com/image/443191/2-95-en-fractal-dimension-indicator-mt4-3.webp)
![Fractal Dimension Indicator MetaTrader 4 – [TFlab] - Download 3](https://cdn.tradingfinder.com/image/443183/2-95-en-fractal-dimension-indicator-mt4-4.webp)
The Fractal Dimension Indicator is an advanced technical analysis tool designed to measure the level of complexity and irregularity in price movements within financial markets.
This oscillator utilizes a green median line to indicate whether price behavior over a specific period is trending or oscillating randomly.
Fractal Dimension Indicator Table
The general specifications of the Fractal Dimension Indicator are presented in the following table.
Indicator Categories: | Oscillators MT4 Indicators Volatility MT4 Indicators Trading Assist MT4 Indicators |
Platforms: | MetaTrader 4 Indicators |
Trading Skills: | Intermediate |
Indicator Types: | Reversal MT4 Indicators |
Timeframe: | Multi-Timeframe MT4 Indicators |
Trading Style: | Intraday MT4 Indicators |
Trading Instruments: | Stock Market MT4 Indicators Cryptocurrency MT4 Indicators Forex MT4 Indicators |
Indicator Overview
The Fractal Dimension Oscillator on MetaTrader 4 consists of three distinct lines, defined as follows:
- Reference Line: A dotted horizontal line at the 1.5 level is considered the boundary between trending and ranging market conditions;
- Dynamic Color Line: This line changes color based on the indicator’s value—red in trending conditions (below 1.5), blue in ranging or volatile conditions (above 1.5).
Uptrend Conditions
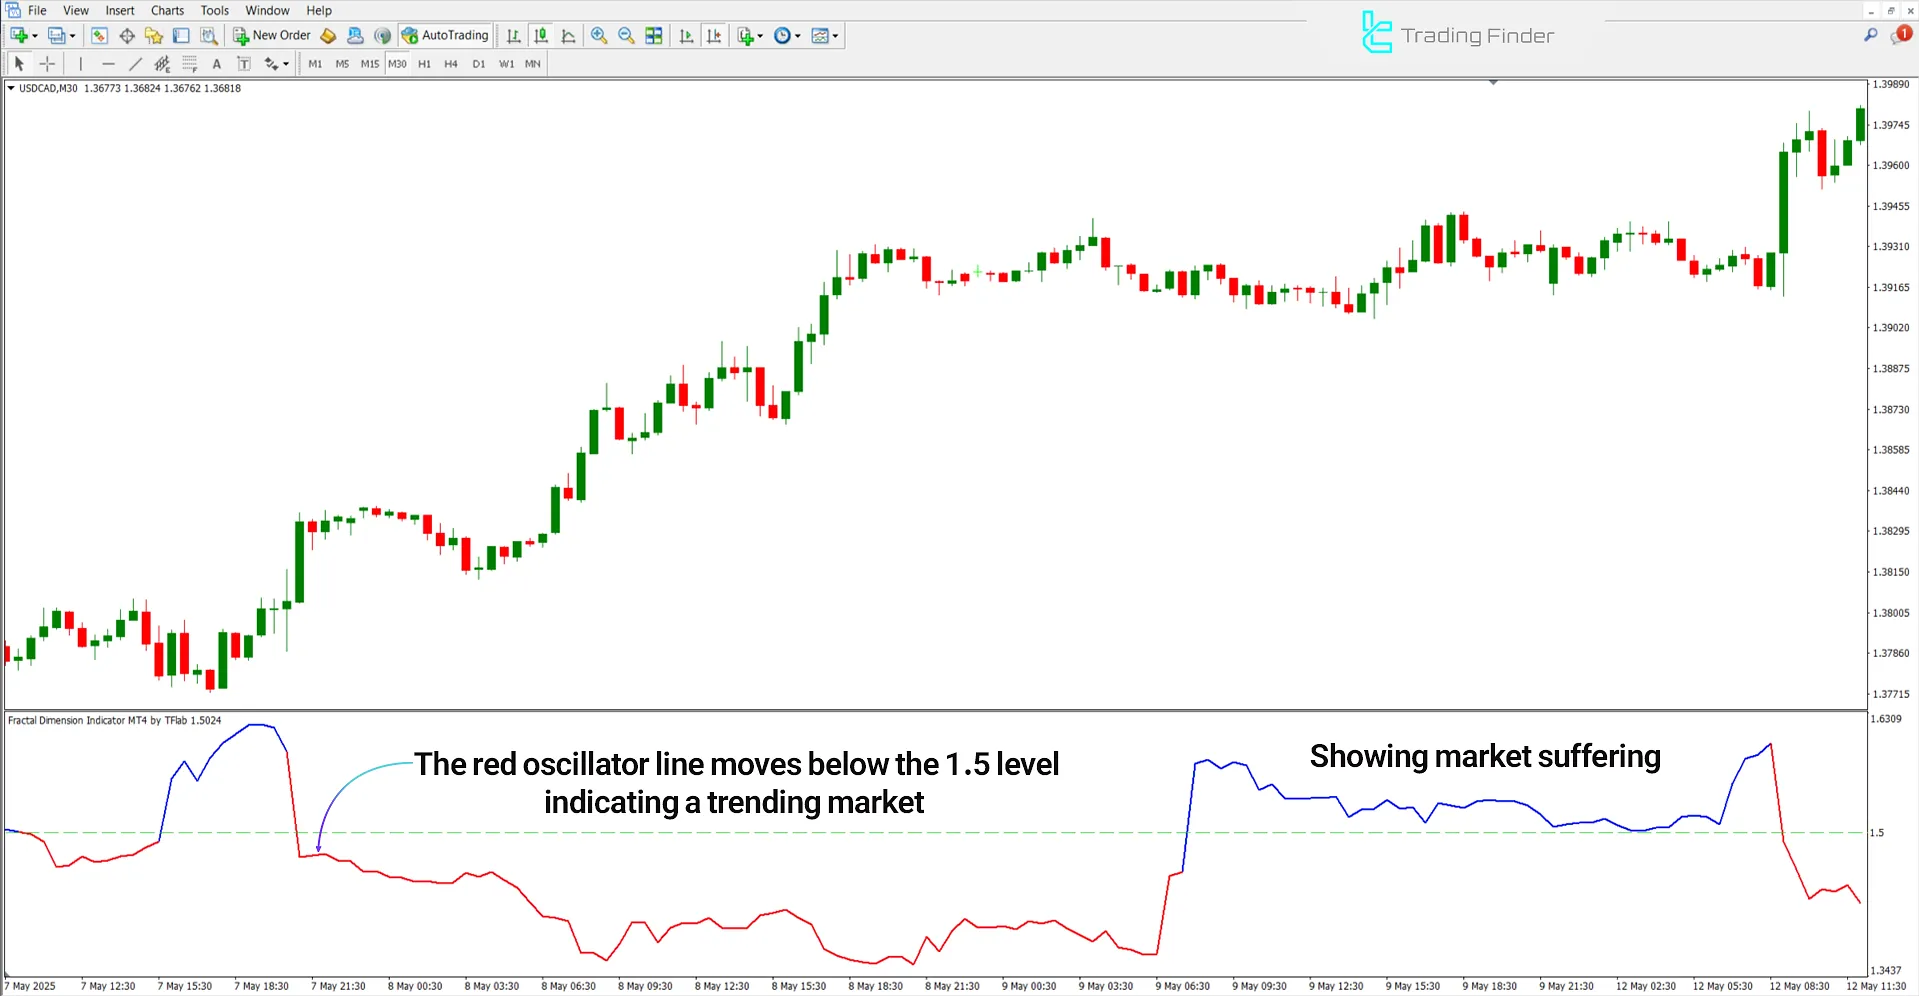
The price chart below shows the USD/CAD currency pair in a 30-minute time frame. When the indicator line gradually moves from above 1.5 to below it, this signals a potential reduction in volatility and the beginning of a market trend.
At this stage, the line color changes from blue to red, and this condition persists across multiple consecutive candles—indicating the stability of an uptrend.

Downtrend Conditions
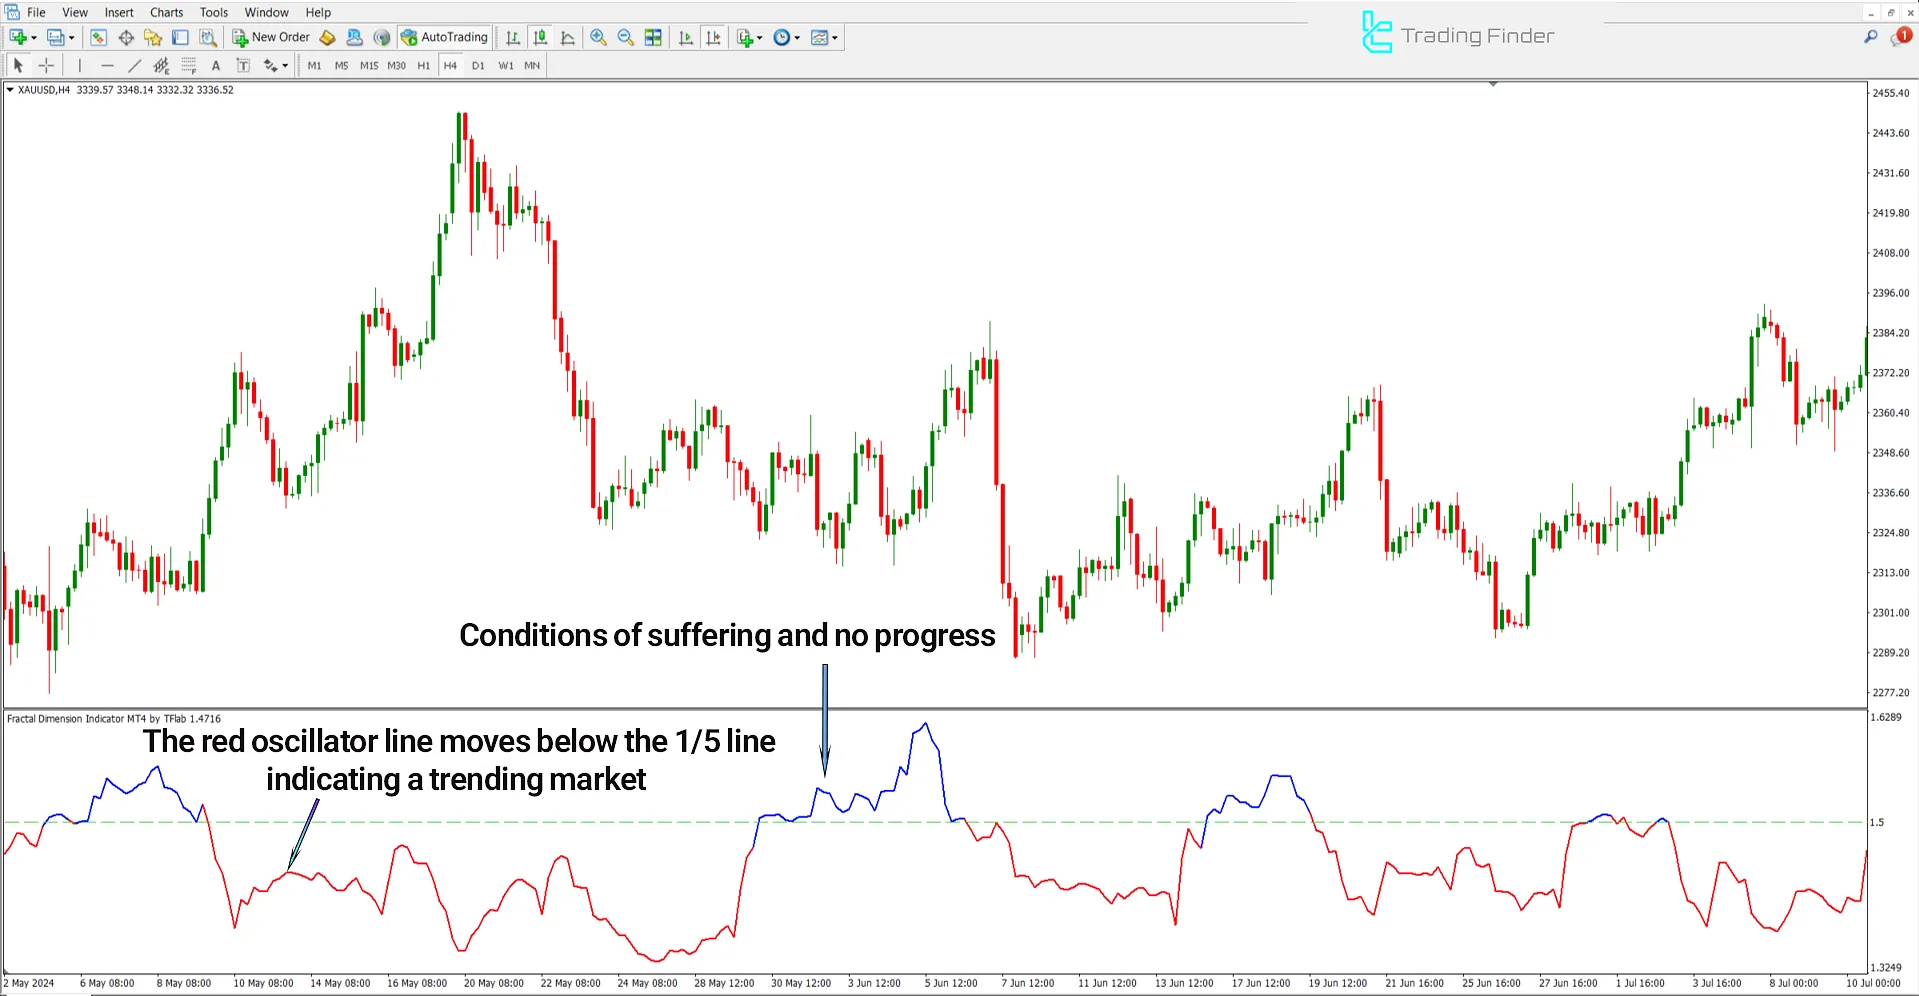
The image below displays the global gold market (XAU/USD) in a 4-hour time frame. When the indicator line stabilizes below the 1.5 level and appears in red, the market is in a trending condition.
As the line gradually turns blue and moves above 1.5, it may indicate a weakening of the prevailing trend and an increase in price volatility.
Furthermore, suppose the price chart also shows signs of decreasing upward momentum or a break of a significant support level. In that case, the market is likely to enter a correction phase or range-bound condition.

Fractal Dimension Indicator Settings
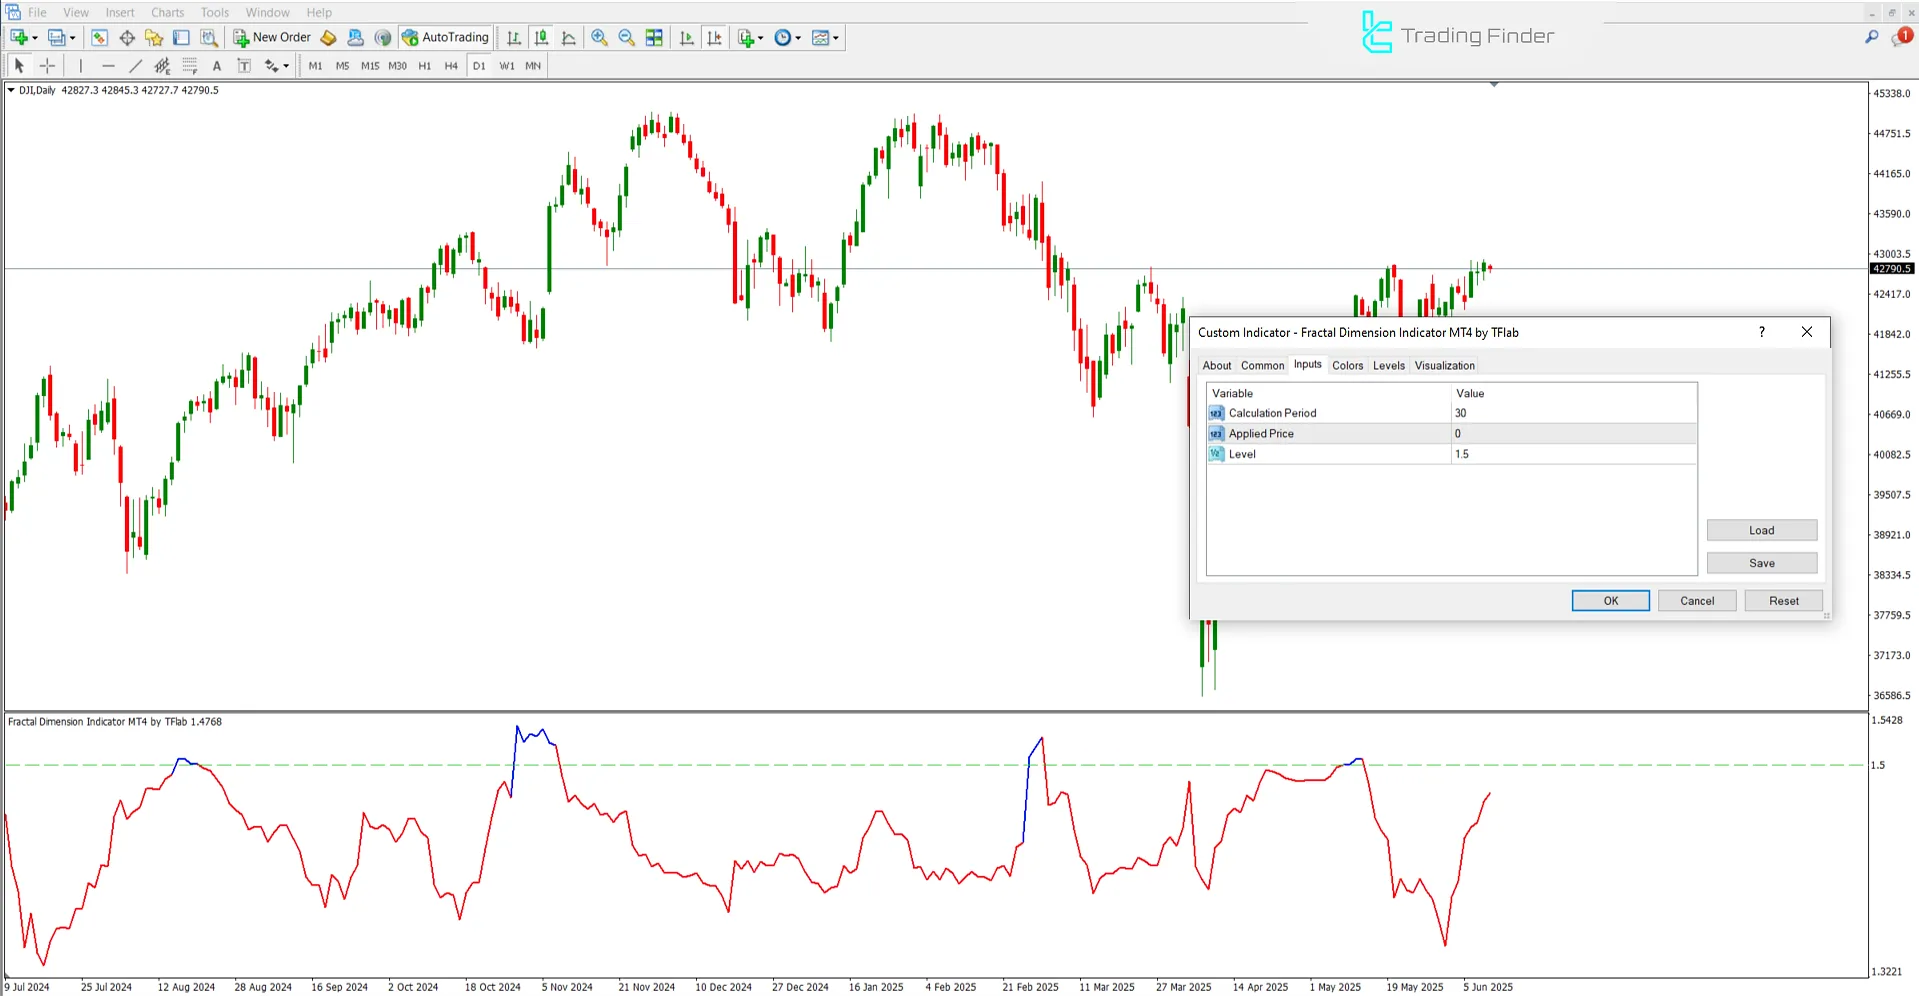
The image below displays the settings panel of the Fractal Dimension Indicator:

- Calculation Period: Defines the period for calculation;
- Applied Price: Specifies the price used for calculations;
- Level: Sets the reference threshold (typically 1.5).
Conclusion
The Fractal Dimension Indicator is a powerful, non-signal-generating analytical tool that provides a deep and accurate view of price dynamics in the market.
It is beneficial for Trading strategies focused on identifying trending versus non-trending conditions.
Fractal Dimension MT4 PDF
Fractal Dimension MT4 PDF
Click to download Fractal Dimension MT4 PDFIs it recommended to use the Fractal Dimension Indicator during economic news releases?
No; during major news events, the market exhibits highly volatile and unpredictable behavior.
Is the Fractal Dimension Indicator suitable for generating entry or exit signals?
No, this is a diagnostic and filtering tool and does not independently generate buy or sell signals.


