![FTLM STLM Indicator in MetaTrader 4 Download – [TradingFinder]](https://cdn.tradingfinder.com/image/581597/11-102-en-ftlm-stlm-mt4-01.webp)
![FTLM STLM Indicator in MetaTrader 4 Download – [TradingFinder] 0](https://cdn.tradingfinder.com/image/581597/11-102-en-ftlm-stlm-mt4-01.webp)
![FTLM STLM Indicator in MetaTrader 4 Download – [TradingFinder] 1](https://cdn.tradingfinder.com/image/581582/11-102-en-ftlm-stlm-mt4-02.webp)
![FTLM STLM Indicator in MetaTrader 4 Download – [TradingFinder] 2](https://cdn.tradingfinder.com/image/581564/11-102-en-ftlm-stlm-mt4-03.webp)
![FTLM STLM Indicator in MetaTrader 4 Download – [TradingFinder] 3](https://cdn.tradingfinder.com/image/581572/11-102-en-ftlm-stlm-mt4-04.webp)
The FTLM STLM indicator is a practical oscillator for traders who aim to identify trend reversals during corrective price movements.
This indicator is designed for MetaTrader 4 and, through its two oscillator lines (blue and red), helps to detect overbought and oversold zones.
By combining this indicator with technical analysis, traders can analyze the main market trend and identify suitable trading opportunities.
FTLM STLM Indicator Table
The following section contains information about the FTLM STLM Indicator:
Indicator Categories: | Oscillators MT4 Indicators Currency Strength MT4 Indicators Trading Assist MT4 Indicators |
Platforms: | MetaTrader 4 Indicators |
Trading Skills: | Elementary |
Indicator Types: | Trend MT4 Indicators Lagging MT4 Indicators |
Timeframe: | Multi-Timeframe MT4 Indicators |
Trading Style: | Day Trading MT4 Indicators Intraday MT4 Indicators Scalper MT4 Indicators |
Trading Instruments: | Share Stocks MT4 Indicators Indices Market MT4 Indicators Stock Market MT4 Indicators Cryptocurrency MT4 Indicators Forex MT4 Indicators |
FTLM STLM Indicator at a Glance
The FTLM STLM indicator is an oscillator designed to detect the continuation of the trend and the end of corrective movements in the forex market.
By identifying the main market trend, traders can determine when the price enters a corrective phase and use this indicator to detect the end of that correction, thereby finding suitable trade entries.
In the oscillator window, there are two lines: when the blue line moves below the red line, it indicates that the market has entered an oversold zone.
Conversely, when the blue line moves above the red line, it signals entry into the overbought zone.
Uptrend in the FTLM STLM Indicator
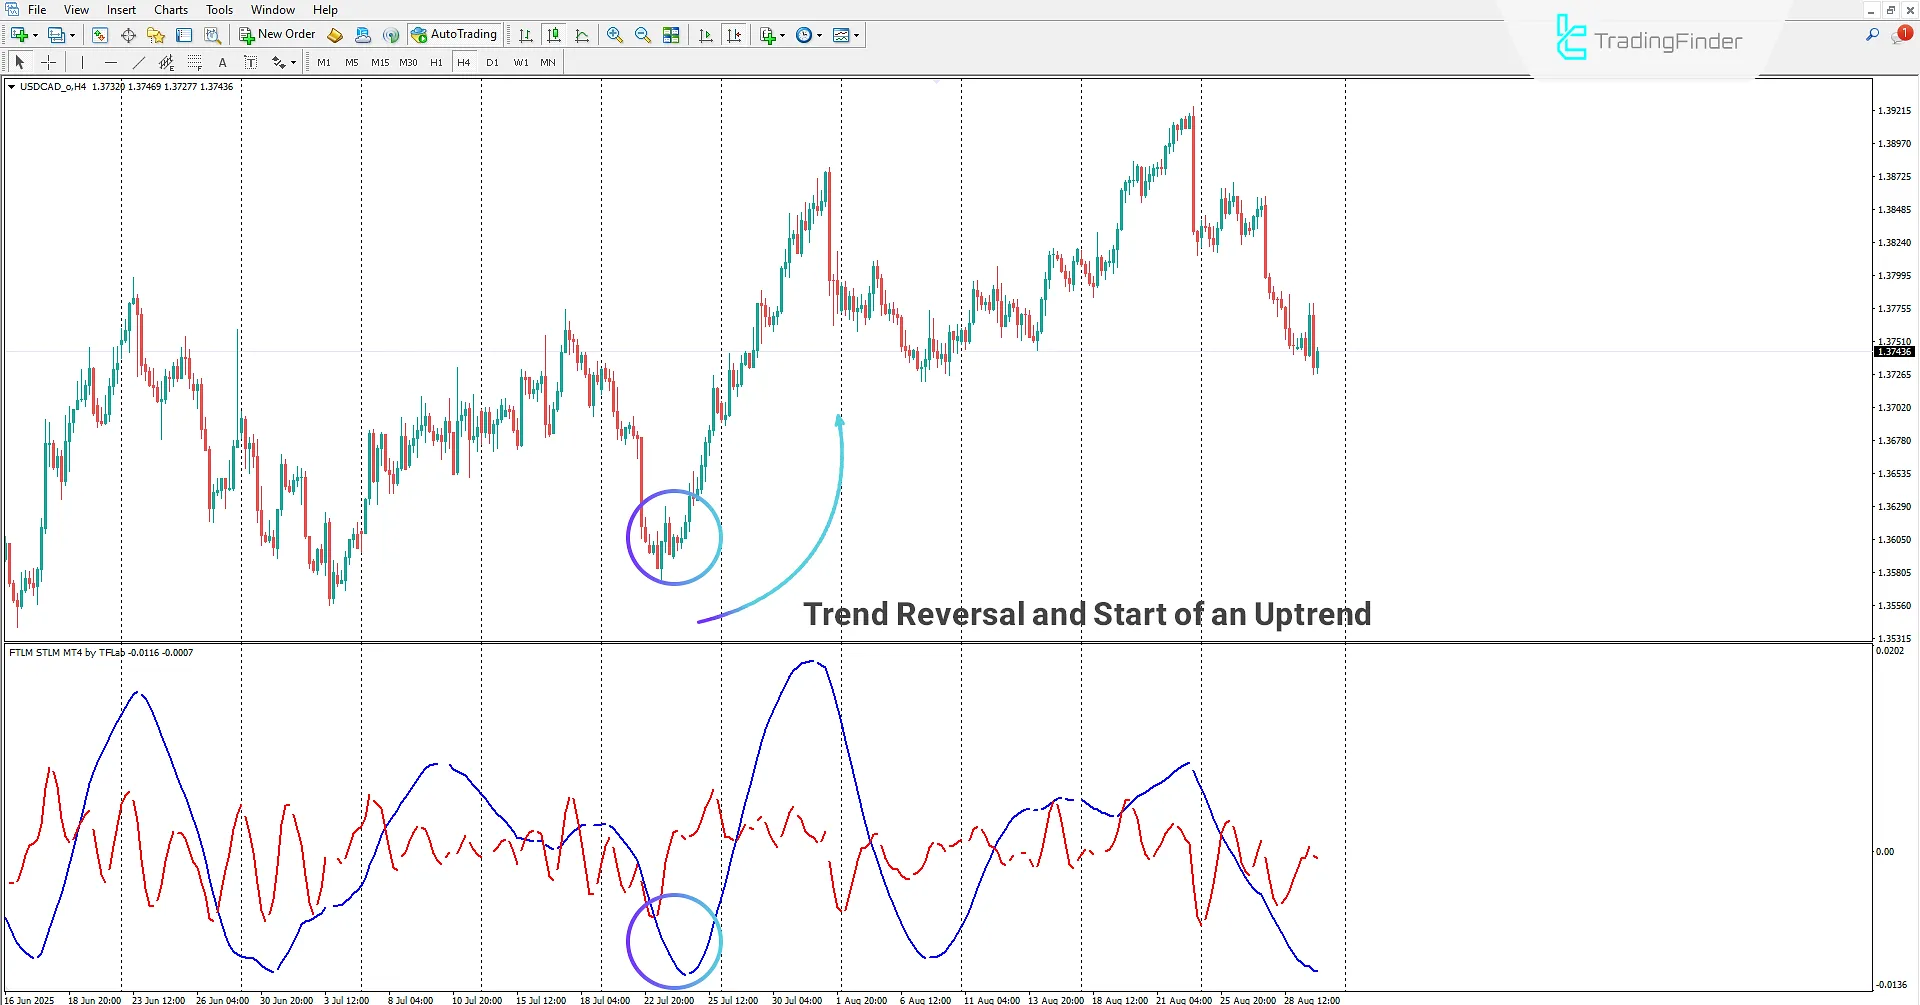
On the 4-hour USD/CAD chart, traders can use the FTLM STLM indicator to detect the end of corrective movements.
In this chart, the price is in an uptrend, and when the blue oscillator line drops below the red oscillator line, it signals the entry of the market into the oversold zone.
When the blue line resumes the upward trend, it indicates the end of the corrective move, and the start of the oscillator’s uptrend can be used as a signal for continued bullish momentum and entry into a buy position.

Downtrend in the FTLM STLM Indicator
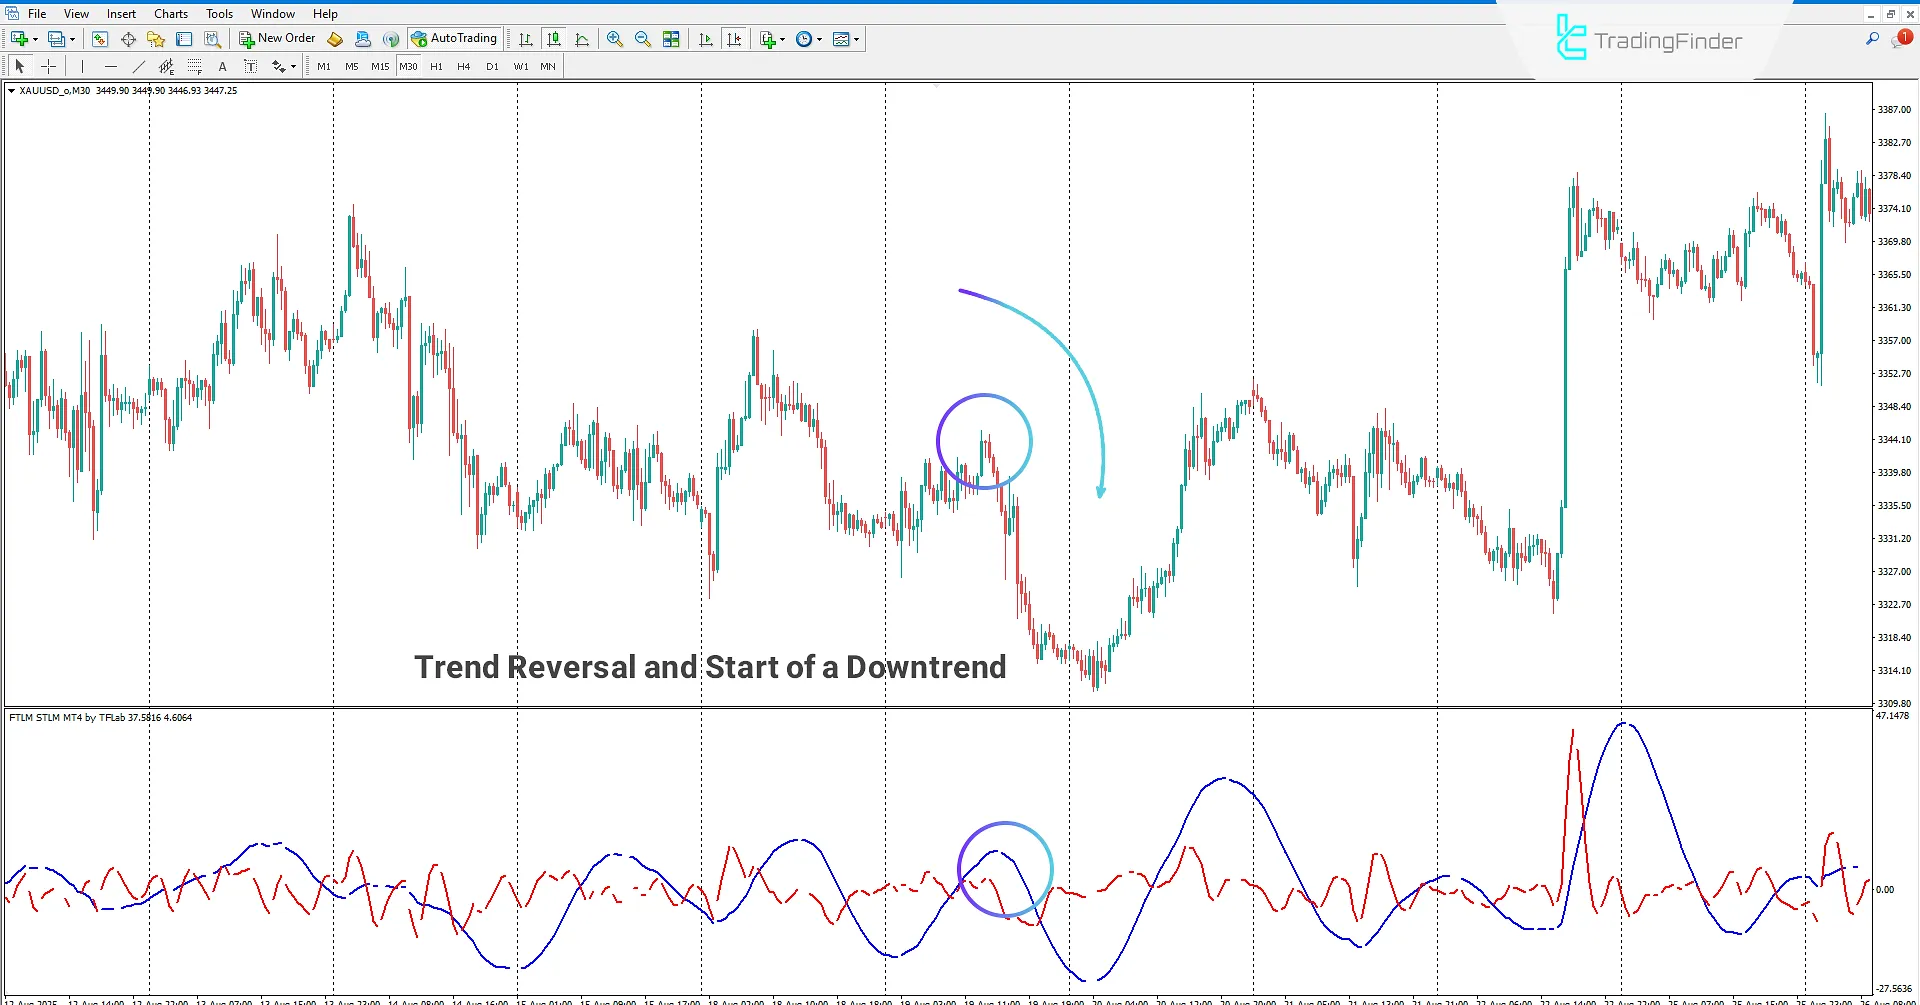
On the 30-minute Gold chart, the FTLM STLM indicator is applied, showing the end of the bullish corrective move.
Traders can, by identifying the main market trend and during corrective price movements, detect the end of the correction with this indicator and enter trades accordingly.
In this chart, the price is in a downtrend and has entered a corrective bullish move.
When the blue oscillator line is above the red oscillator line, it indicates that the market has entered the overbought zone.
When the blue line resumes the downward trend, it signals the end of the corrective move, which can be used as an opportunity to enter a sell position.

FTLM STLM Indicator Settings
Below are the settings for the FTLM STLM Indicator:

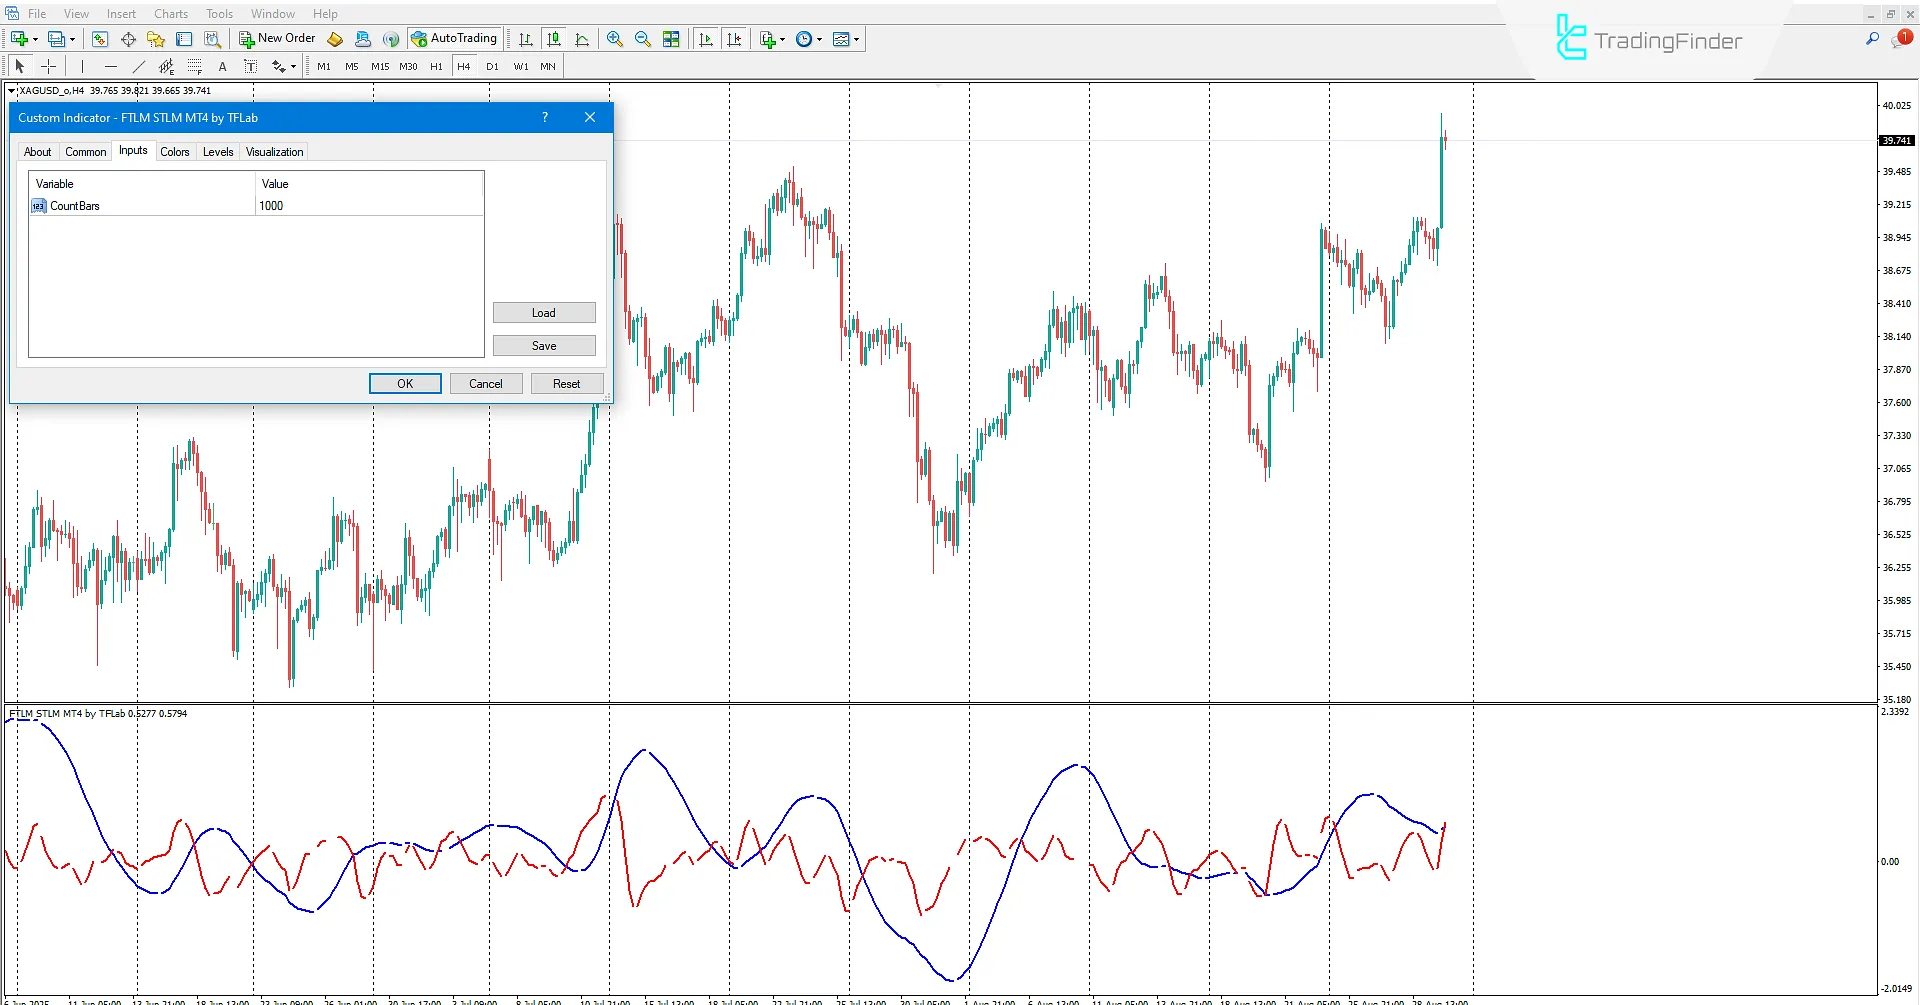
- Count Bars: Maximum number of candlesticks for displaying the histogram on the chart.
Conclusion
The FTLM STLM indicator is a specialized tool for traders who seek to identify the end of corrective trends in the market using their trading strategies.
By displaying overbought and oversold zones, this indicator highlights the end of corrective price phases.
Traders can, by recognizing the main market trend and analyzing the two oscillator lines (blue and red), determine the end of corrections and prepare to enter trades.
FTLM STLM Indicator in MetaTrader 4 PDF
FTLM STLM Indicator in MetaTrader 4 PDF
Click to download FTLM STLM Indicator in MetaTrader 4 PDFWhat is the FTLM STLM Indicator?
It is a practical oscillator for traders who want to identify trend reversals during corrective price phases.
How does the FTLM STLM Indicator help in identifying the end of corrections?
By displaying overbought and oversold zones and analyzing the two oscillator lines, traders can determine the end of corrective price moves and get ready for trade entries.


