


The FTLM STLM Histogram Indicator is a practical tool for traders who rely on indicators to identify market trend reversals.
This indicator is designed as a histogram and, with the help of a trading strategy using an oscillator line, it visually displays market direction changes from bullish to bearish and vice versa, through color changes.
This tool is available to users on the MetaTrader 4 platform.
FTLM STLM Histogram Indicator Table
Below are the details of the FTLM STLM Histogram Indicator:
Indicator Categories: | Oscillators MT4 Indicators Currency Strength MT4 Indicators Trading Assist MT4 Indicators |
Platforms: | MetaTrader 4 Indicators |
Trading Skills: | Elementary |
Indicator Types: | Trend MT4 Indicators Lagging MT4 Indicators |
Timeframe: | Multi-Timeframe MT4 Indicators |
Trading Style: | Day Trading MT4 Indicators Intraday MT4 Indicators Scalper MT4 Indicators |
Trading Instruments: | Share Stocks MT4 Indicators Indices Market MT4 Indicators Cryptocurrency MT4 Indicators Forex MT4 Indicators |
Indicator at a glance
The FTLM STLM Histogram Indicator is a specialized tool for traders who aim to identify reversals based on the main market direction.
With this indicator and technical analysis, traders can first identify the dominant trend of the market, and when the price enters a corrective phase, they can predict its return to the main trend.
By using a color-changing oscillator line, the indicator displays trend reversals. When the price shifts from bearish to bullish, the line turns green, and when it shifts from bullish to bearish, the line turns red.
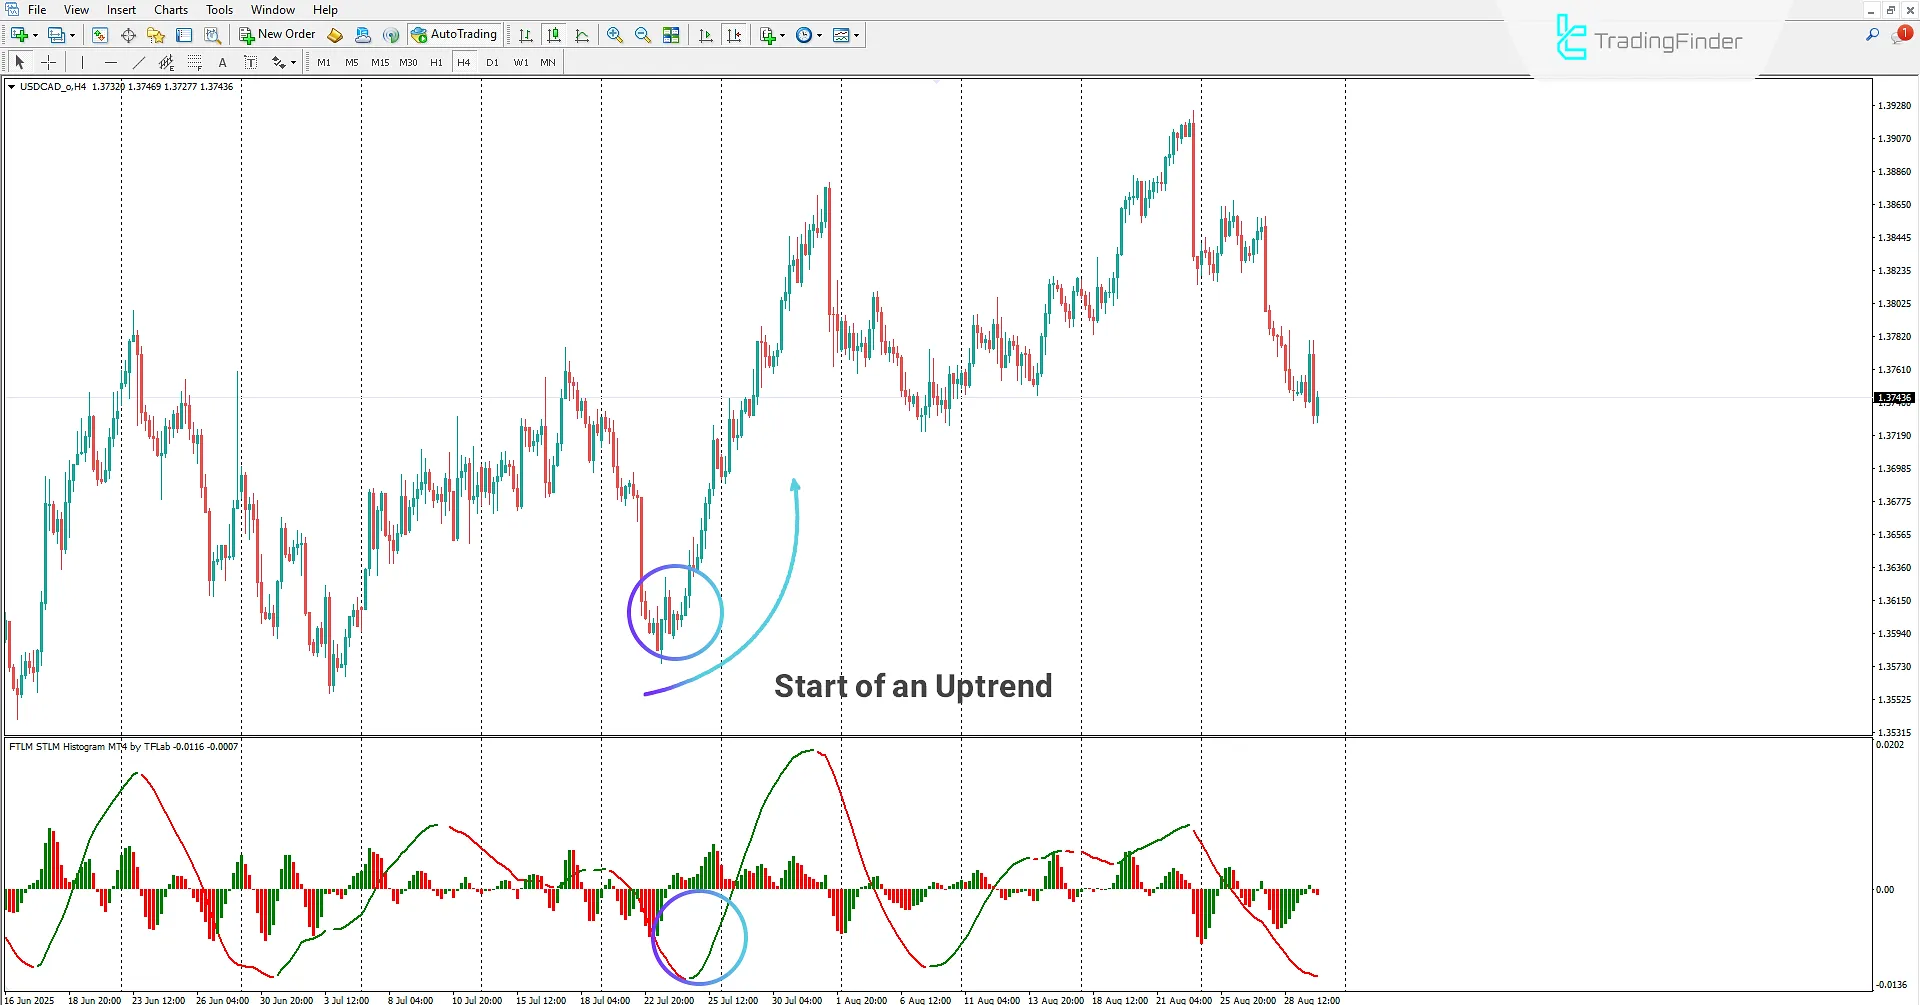
Bullish Trend
On the 4-hour chart of the USDCAD pair, traders can use the FTLM STLM Histogram Indicator to identify when the price enters a corrective phase during a bullish move and anticipate its return to the main trend, entering buy positions accordingly.
Traders may interpret the histogram color change from red to green during a bullish market as a buy signal to enter trades.
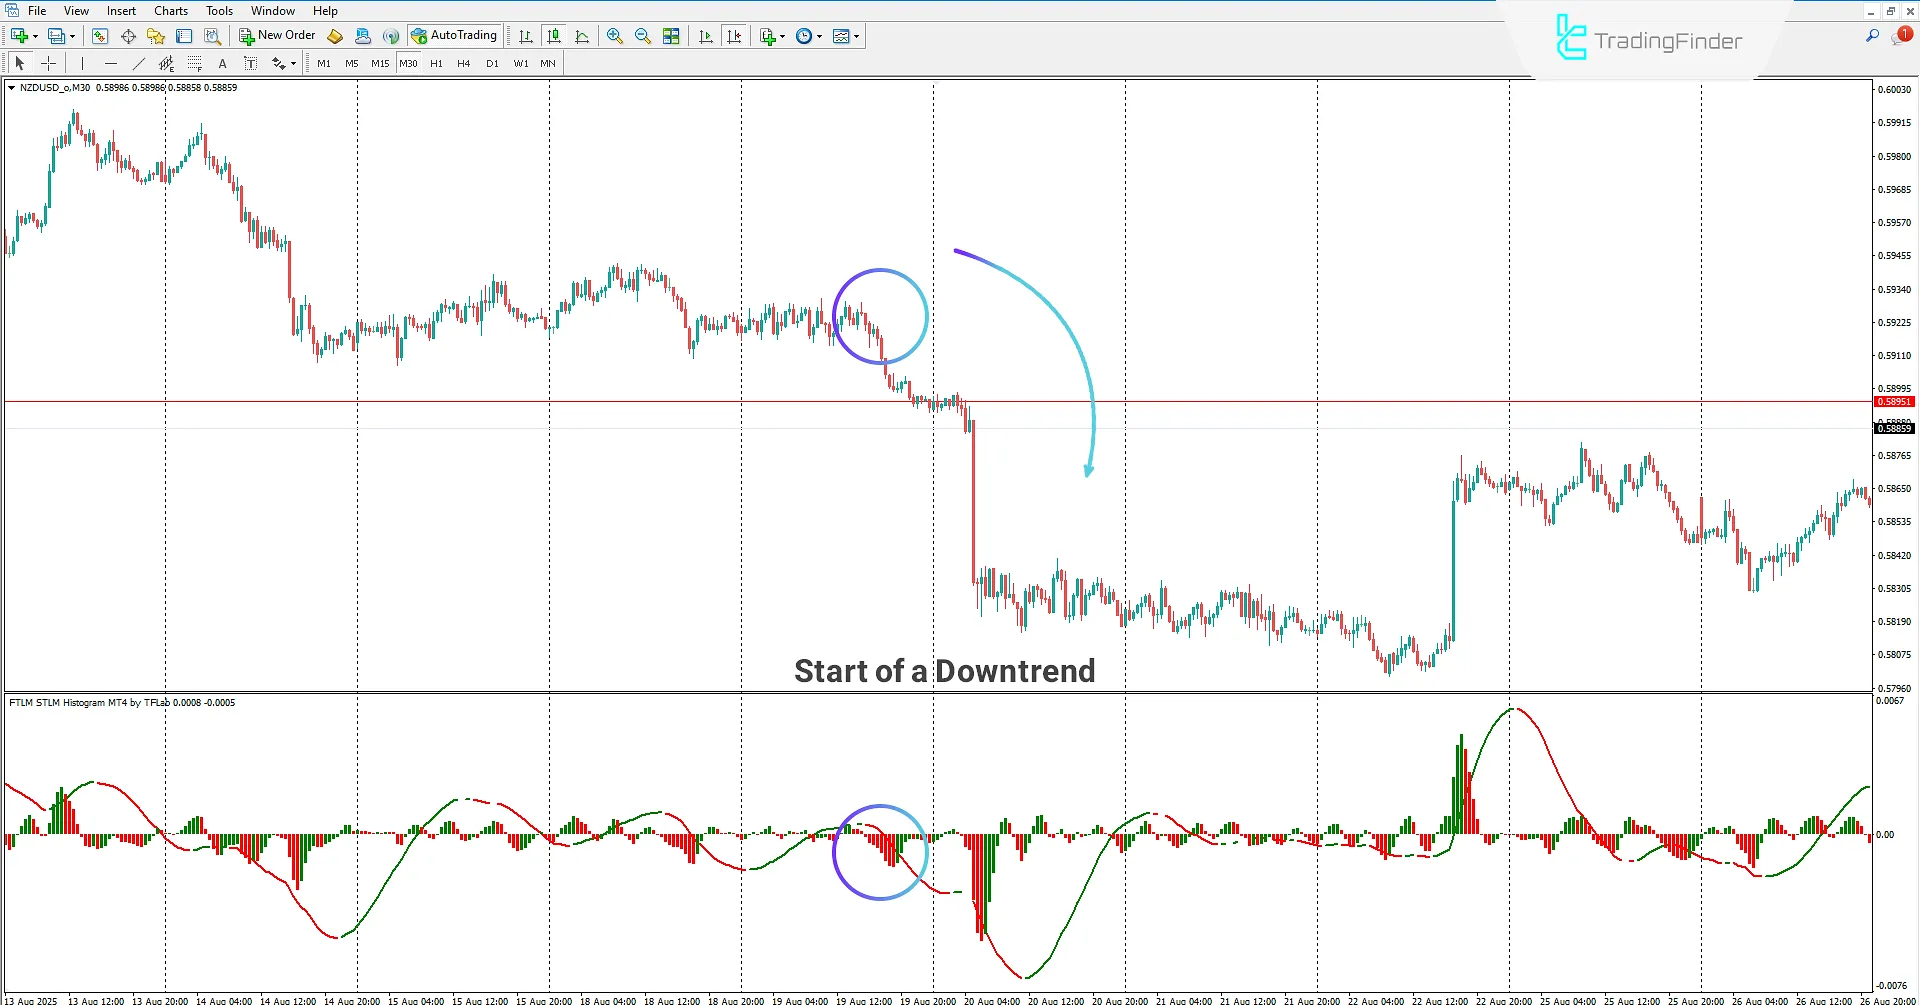
Bearish Trend
On the 30-minute chart of the NZDUSD pair, the FTLM STLM Histogram Indicator is applied to the chart. This indicator provides traders with reversal signals by displaying the end of corrective phases.
In this chart, the price is in a bearish trend, and after entering a corrective phase, traders can monitor the oscillator line. If the color changes from green to red, this can be considered as a sign of the market resuming its main bearish trend, signaling a sell opportunity.
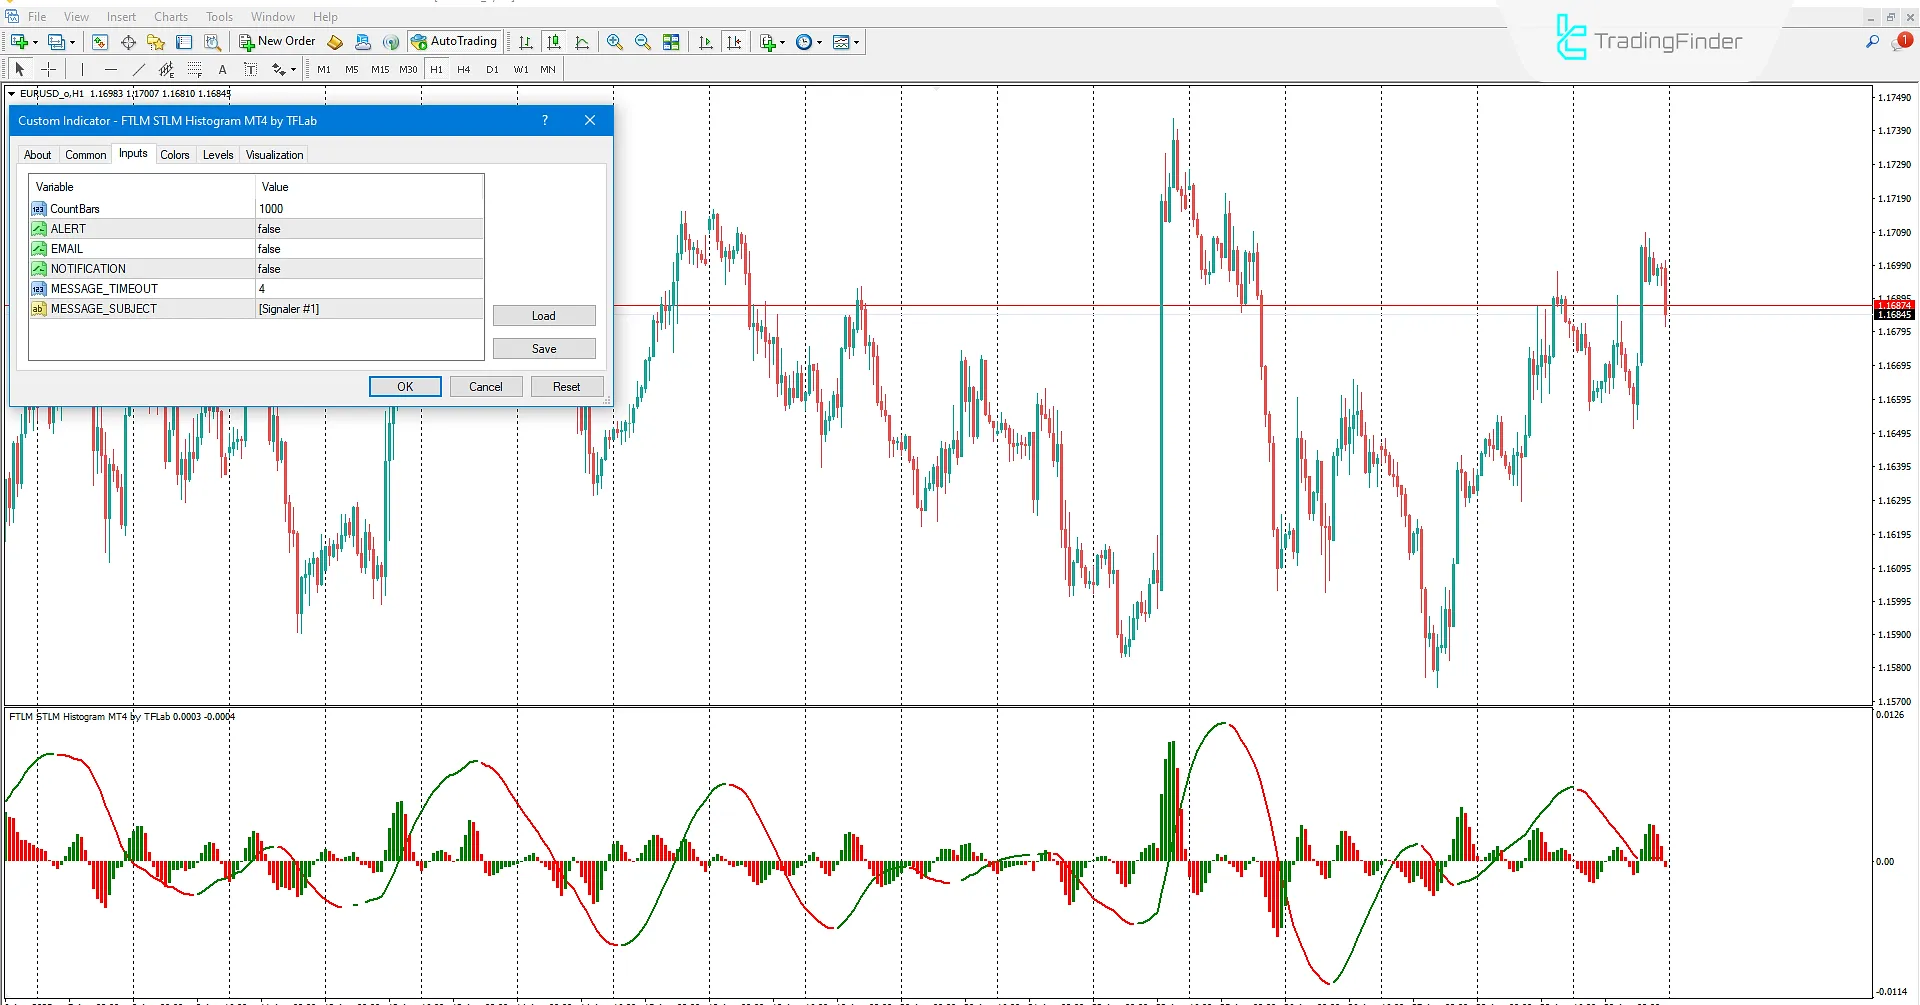
FTLM STLM Histogram Indicator Settings
Below are the FTLM STLM Histogram Indicator settings:
- Count Bars: Maximum number of candles to display the histogram on the chart;
- ALERT: Enable/disable alerts when the oscillator line changes trend;
- EMAIL: Enable/disable sending alerts to the mailbox when the oscillator line changes trend;
- NOTIFICATION: Enable/disable sending alerts as notifications to mobile devices when the oscillator line changes trend;
- MESSAGE_TIMEOUT: Set the time interval between alert messages;
- MESSAGE_SUBJECT: Alert subject or custom message.
Conclusion
The FTLM STLM Histogram Indicator is a practical tool for traders looking to identify price movement shifts from corrective phases back to the main market trend.
This indicator creates a histogram window to display trend momentum and uses an oscillator line to mark market phase transitions.
When the trend shifts from bearish to bullish, the oscillator color changes from red to green, and when the trend shifts from bullish to bearish, it changes from green to red.
FTLM STLM Histogram Indicator in MetaTrader 4 PDF
FTLM STLM Histogram Indicator in MetaTrader 4 PDF
Click to download FTLM STLM Histogram Indicator in MetaTrader 4 PDFWhat is the FTLM STLM Histogram Indicator?
A practical tool in MetaTrader 4 for traders who use indicators to identify market trend reversals.
How is the FTLM STLM Histogram Indicator designed?
It is designed as a histogram and, with the help of an oscillator line, displays market direction changes.


