![FTLM STLM Momentum Indicator for MT4 – Free – [Trading Finder]](https://cdn.tradingfinder.com/image/405708/2-75-en-ftlm-stlm-mt4-1.webp)
![FTLM STLM Momentum Indicator for MT4 – Free – [Trading Finder] 0](https://cdn.tradingfinder.com/image/405708/2-75-en-ftlm-stlm-mt4-1.webp)
![FTLM STLM Momentum Indicator for MT4 – Free – [Trading Finder] 1](https://cdn.tradingfinder.com/image/405707/2-75-en-ftlm-stlm-mt4-2.webp)
![FTLM STLM Momentum Indicator for MT4 – Free – [Trading Finder] 2](https://cdn.tradingfinder.com/image/405705/2-75-en-ftlm-stlm-mt4-3.webp)
![FTLM STLM Momentum Indicator for MT4 – Free – [Trading Finder] 3](https://cdn.tradingfinder.com/image/405706/2-75-en-ftlm-stlm-mt4-4.webp)
The FTLM STLM indicator, a momentum-based analytical tool, is designed to detect trend strength and potential market reversals. It consists of two key components:
- Slow Trend Line Momentum (STLM), displayed as blue histogram bars;
- Fast Trend Line Momentum (FTLM), shown as red oscillating lines plotted over the indicator window.
FTLM STLM Composite Momentum Indicator Table
The general specifications of the FTLM STLM Composite Momentum Indicator are presented in the following table.
Indicator Categories: | Oscillators MT4 Indicators Volatility MT4 Indicators Currency Strength MT4 Indicators |
Platforms: | MetaTrader 4 Indicators |
Trading Skills: | Intermediate |
Indicator Types: | Reversal MT4 Indicators |
Timeframe: | Multi-Timeframe MT4 Indicators |
Trading Style: | Intraday MT4 Indicators |
Trading Instruments: | Forward Market MT4 Indicators Stock Market MT4 Indicators Cryptocurrency MT4 Indicators Forex MT4 Indicators |
Indicator Overview
The FTLM STLM Momentum Indicator generates entry and exit signals based on the interaction between FTLM and STLM:
- When the FTLM line moves above the STLM, it indicates increasing bullish momentum and a possible buy signal
- Conversely, when FTLM is below STLM, it signals bearish momentum and a potential sell opportunity
Uptrend Conditions
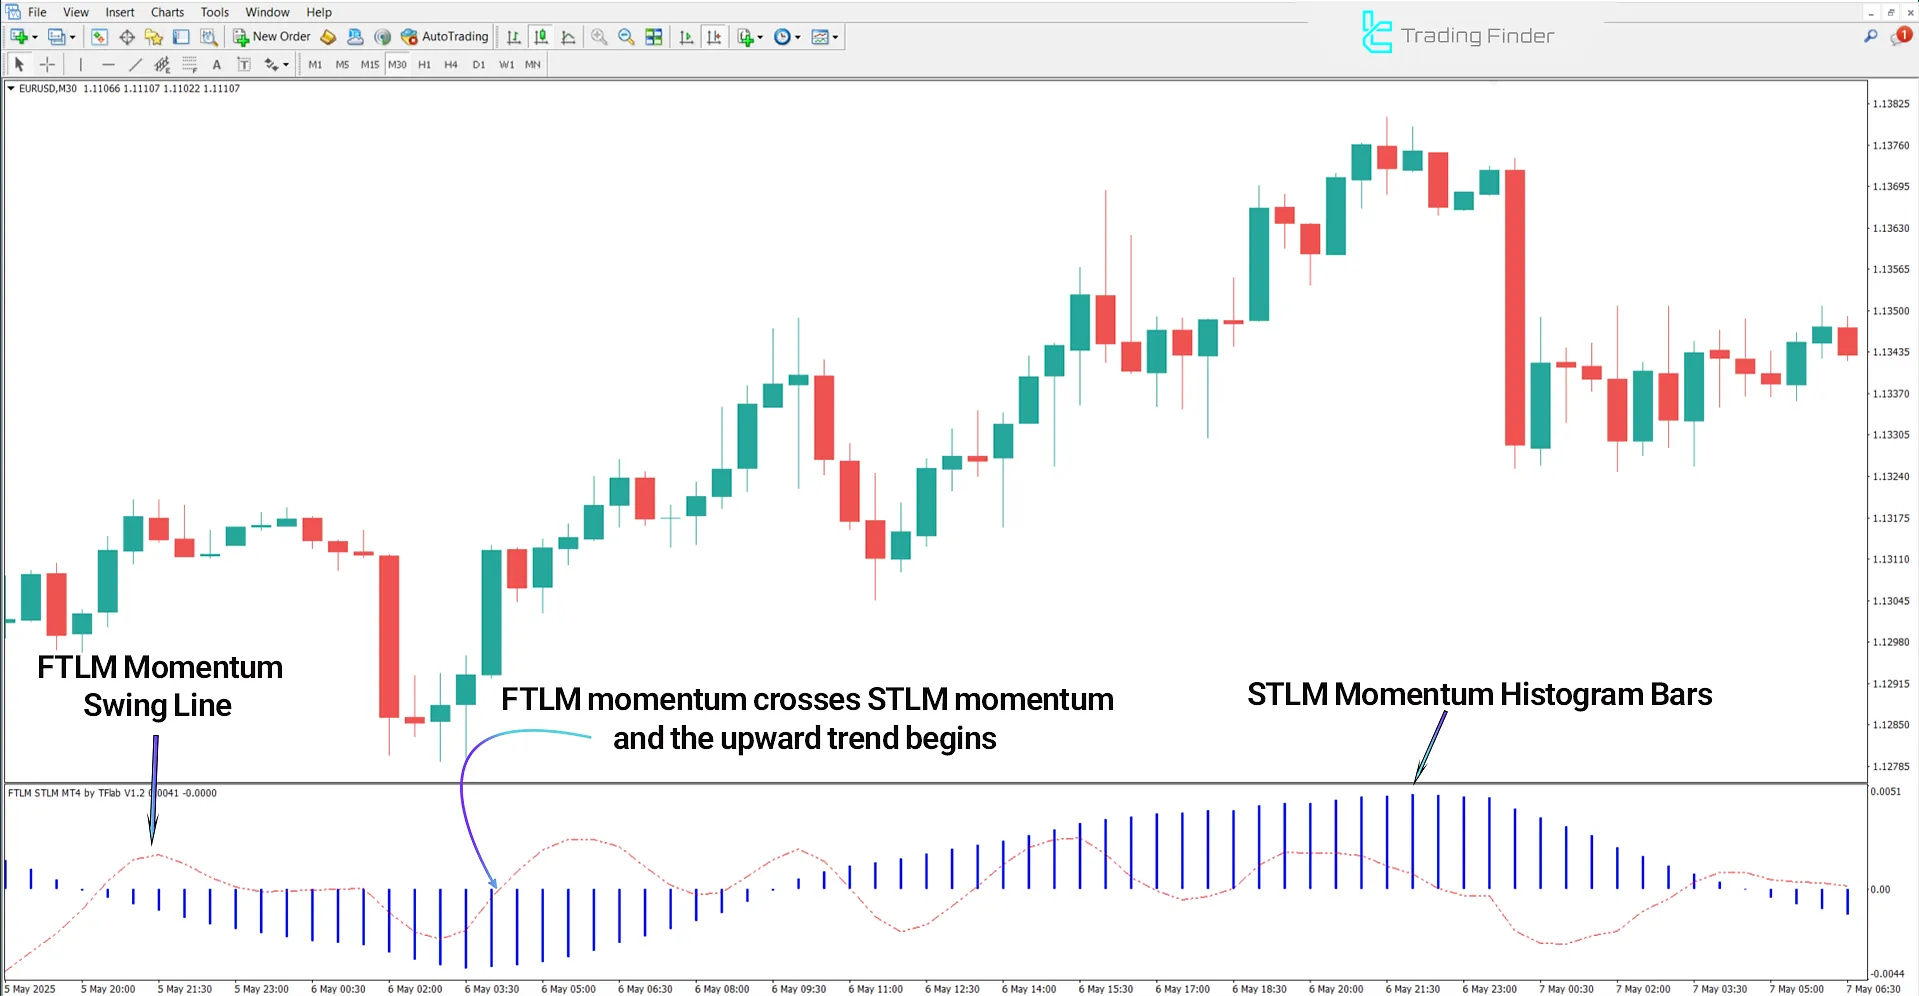
In the EUR/USD currency pair chart, a bullish crossover occurs when the FTLM crosses above the STLM from below. Simultaneously, the first blue bar appears on the histogram, which triggers a buy entry signal.

Downtrend Conditions
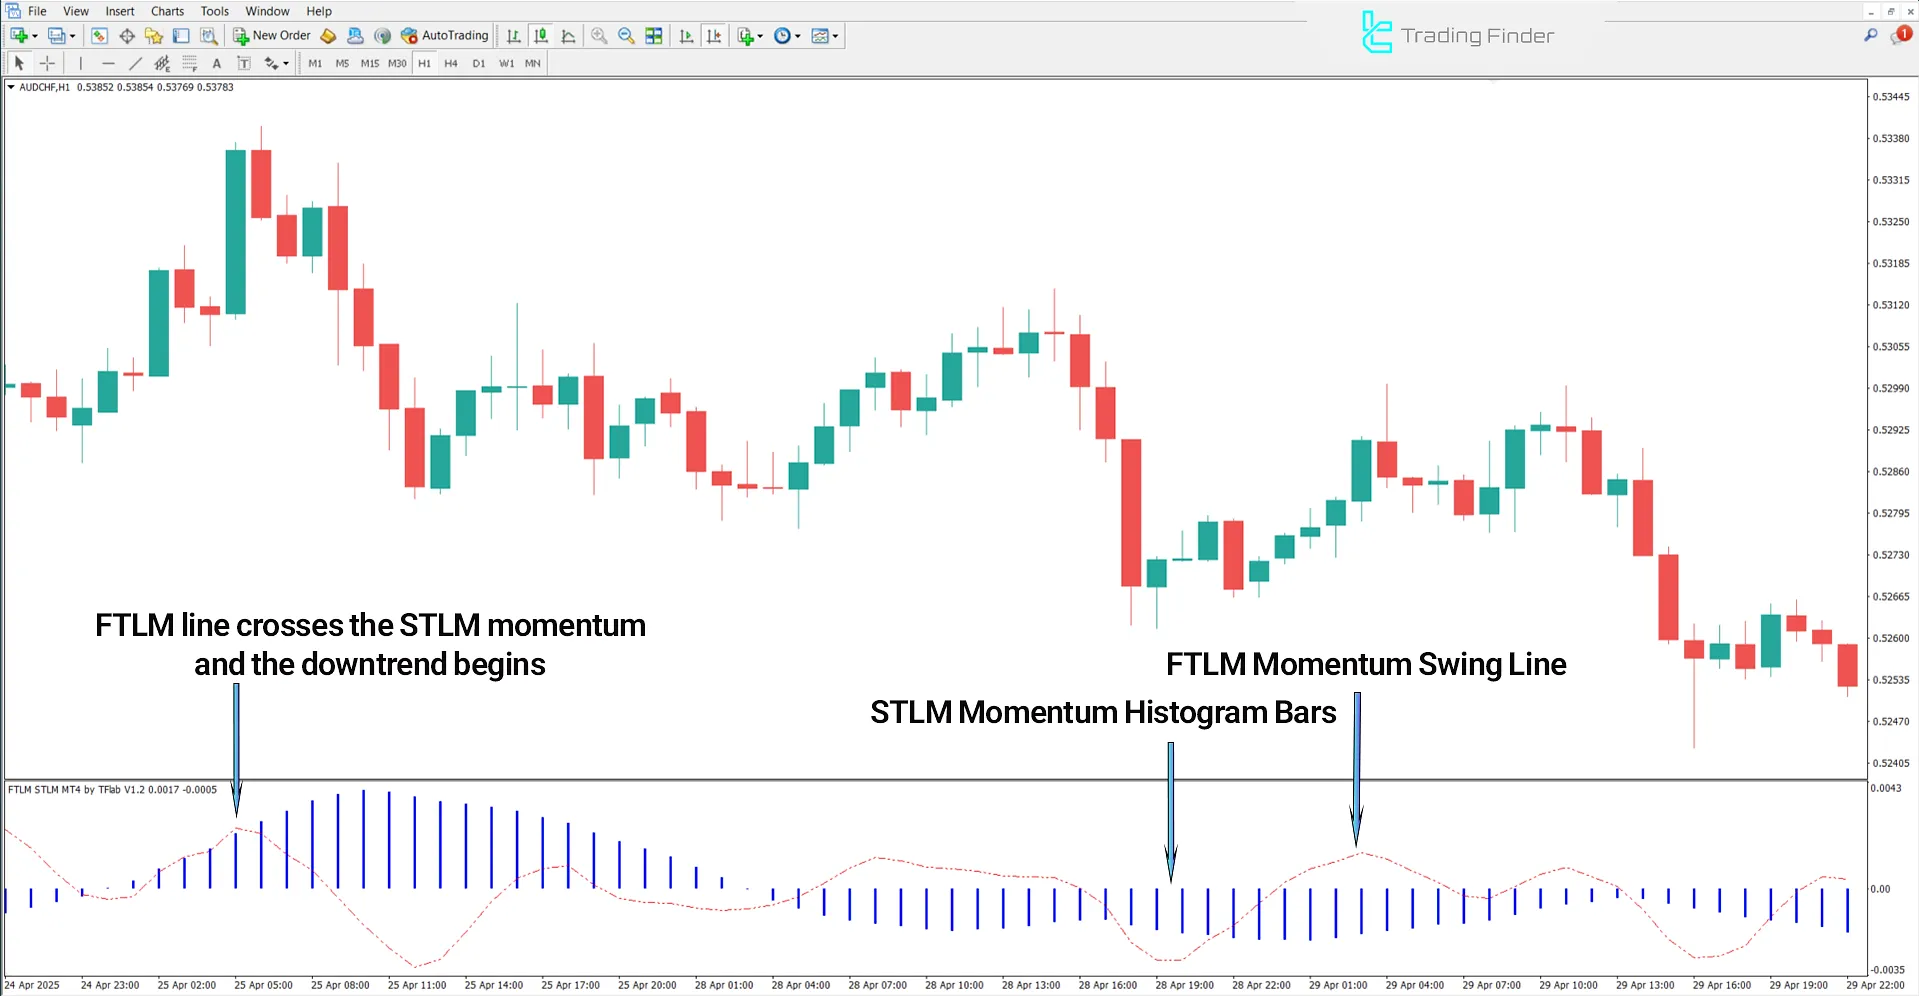
The following price chart shows the AUD/CHF currency pair on a 1-hour timeframe. When the FTLM line moves downward toward the STLM from the upper zone, this convergence of price and oscillator may signal momentum shift and provide a sell entry area.

FTLM STLM Indicator Settings
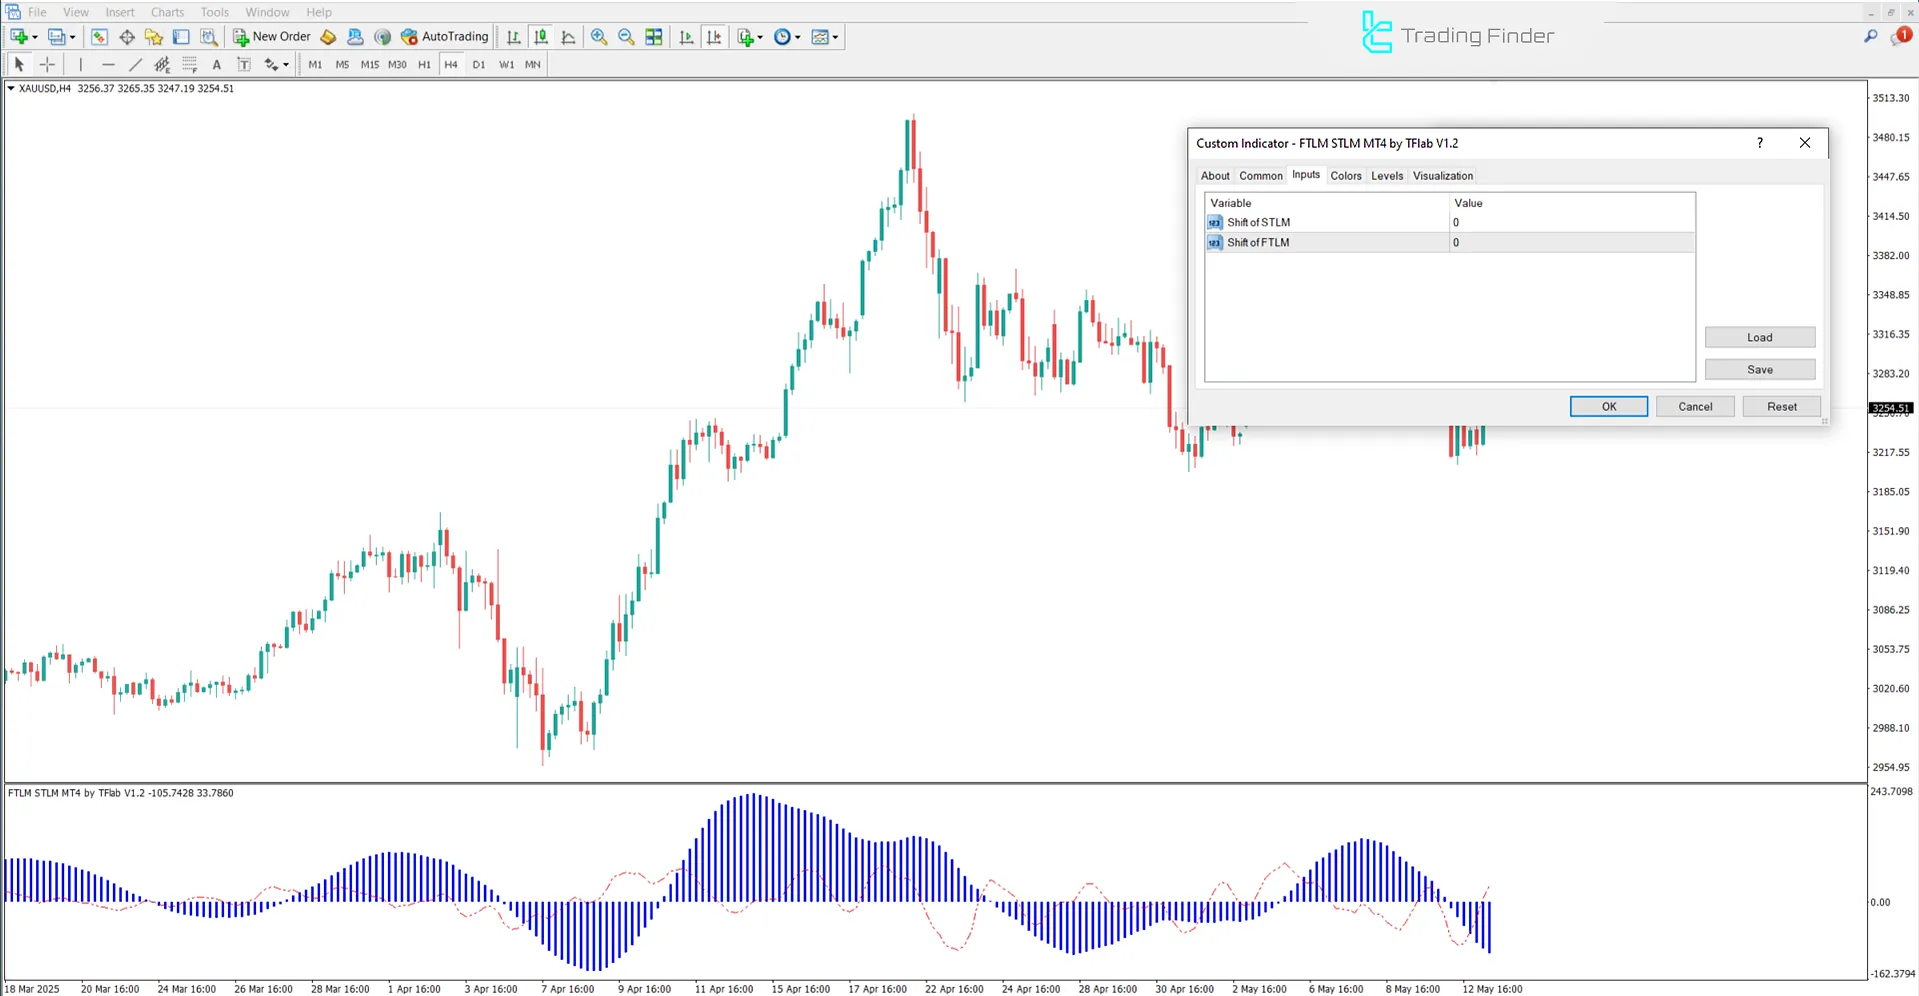
The settings panel for the FTLM STLM Momentum Indicator is shown in the image below:

- Shift of STLM: STLM displacement
- Shift of FTLM: FTLM displacement
Conclusion
The FTLM STLM indicator is a technical analysis tool based on price momentum. By combining two key momentum components FTLM (Fast Trend Line Momentum) and STLM (Slow Trend Line Momentum) it helps identify trend reversal points and measure the strength of price movements.
FTLM STLM Momentum MT4 PDF
FTLM STLM Momentum MT4 PDF
Click to download FTLM STLM Momentum MT4 PDFCan the FTLM STLM indicator be used on all timeframes?
Yes; this indicator is compatible with all timeframes, from 1-minute to daily charts.
Which financial markets can benefit from the FTLM STLM Momentum Indicator?
The FTLM STLM indicator can be used in markets such as gold, indices, stocks, and cryptocurrencies.


