![FVG Positioning Average Indicator MT4 Download – Free – [TradingFinder]](https://cdn.tradingfinder.com/image/476931/13-179-en-fvg-positioning-average-mt4-01.webp)
![FVG Positioning Average Indicator MT4 Download – Free – [TradingFinder] 0](https://cdn.tradingfinder.com/image/476931/13-179-en-fvg-positioning-average-mt4-01.webp)
![FVG Positioning Average Indicator MT4 Download – Free – [TradingFinder] 1](https://cdn.tradingfinder.com/image/476930/13-179-en-fvg-positioning-average-mt4-02.webp)
![FVG Positioning Average Indicator MT4 Download – Free – [TradingFinder] 2](https://cdn.tradingfinder.com/image/476935/13-179-en-fvg-positioning-average-mt4-03.webp)
![FVG Positioning Average Indicator MT4 Download – Free – [TradingFinder] 3](https://cdn.tradingfinder.com/image/476934/13-179-en-fvg-positioning-average-mt4-04.webp)
The Fair Value Gap Positioning Average Indicator is designed based on the concepts of Smart Money. This indicator plots dynamic zones for bullish and bearish trends based on the average of Fair Value Gaps.
The plotted zones represent key areas of price reaction, creating optimal trading positions.
FVG Positioning Average Indicator Specifications Table
The table below outlines the specifications of the FVG Positioning Average Indicator:
Indicator Categories: | ICT MT4 Indicators Smart Money MT4 Indicators Levels MT4 Indicators |
Platforms: | MetaTrader 4 Indicators |
Trading Skills: | Intermediate |
Indicator Types: | Reversal MT4 Indicators |
Timeframe: | Multi-Timeframe MT4 Indicators |
Trading Style: | Day Trading MT4 Indicators Scalper MT4 Indicators Swing Trading MT4 Indicators |
Trading Instruments: | Stock Market MT4 Indicators Cryptocurrency MT4 Indicators Forex MT4 Indicators |
FVG Positioning Average Indicator at a Glance
The FVG Positioning Average Indicator automatically identifies and draws the following zones:
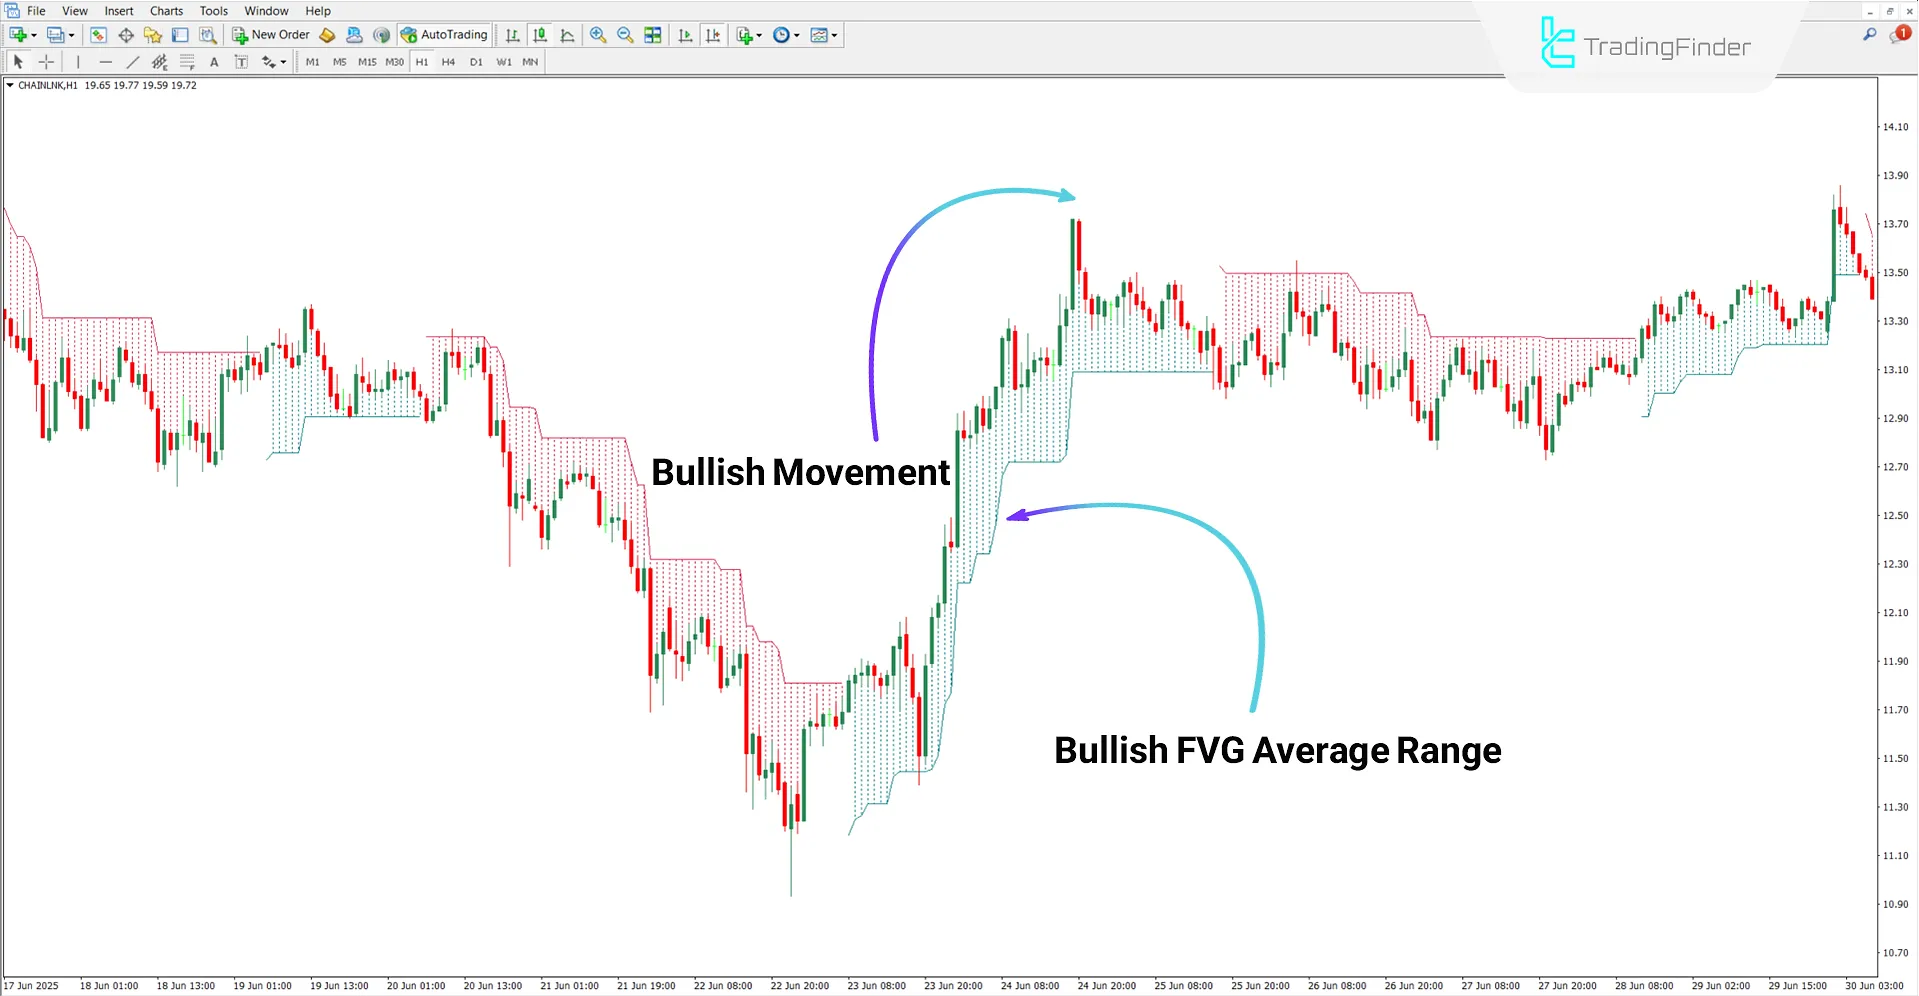
- Bullish FVG Average Zones: These zones, indicated in green, represent potential areas of positive price reaction
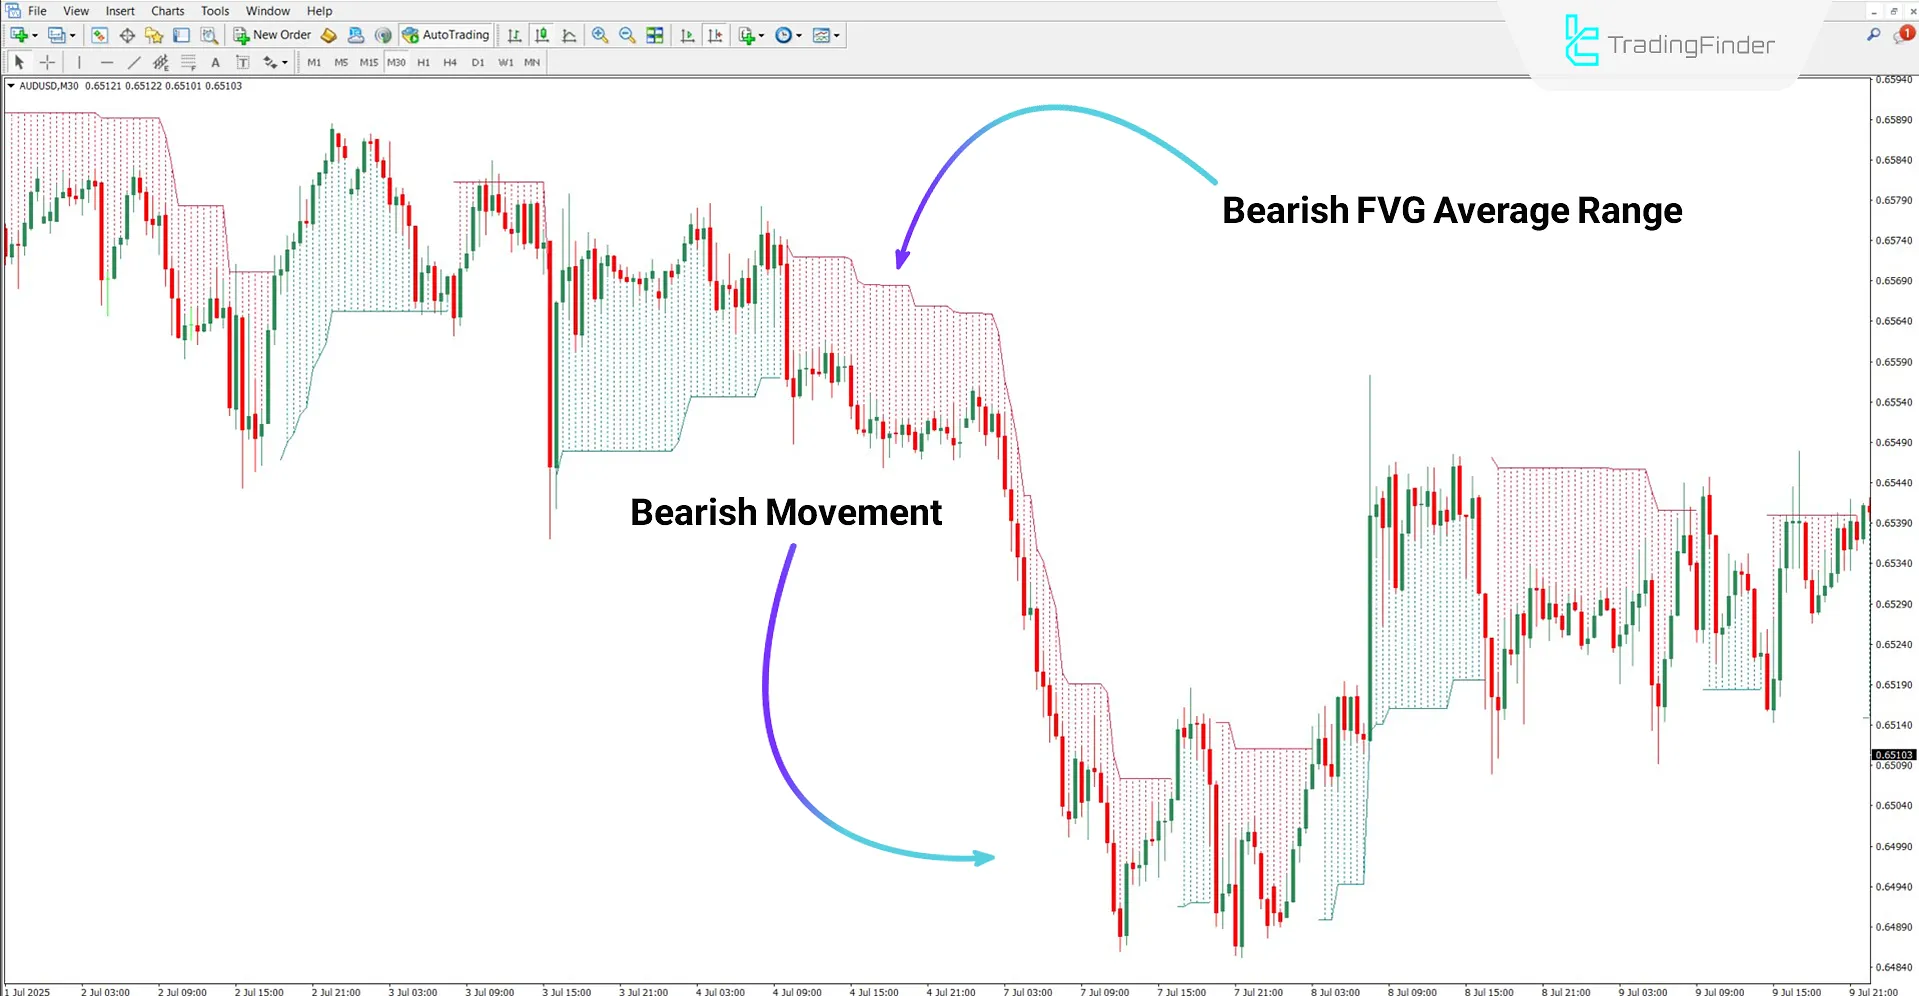
- Bearish FVG Average Zones: Displayed in red, indicating potential negative reactions or downward trend movements
Buy Trades
According to the ChainLink cryptocurrency chart on the 1-hour timeframe, the beginning of the green zone (Bullish FVG Average) can be considered as the entry point for buy trades.
Additionally, areas below the green zone are suitable for placing stop-loss orders.

Sell Trades
Based on the AUD/USD (Australian Dollar to US Dollar) chart on the 30-minute timeframe, the start of the Bearish FVG Average (red zone) can be used as the entry point for sell trades.
Furthermore, revisits to the red zone offer new selling opportunities.

Fair Value Gap Positioning Average Indicator Settings
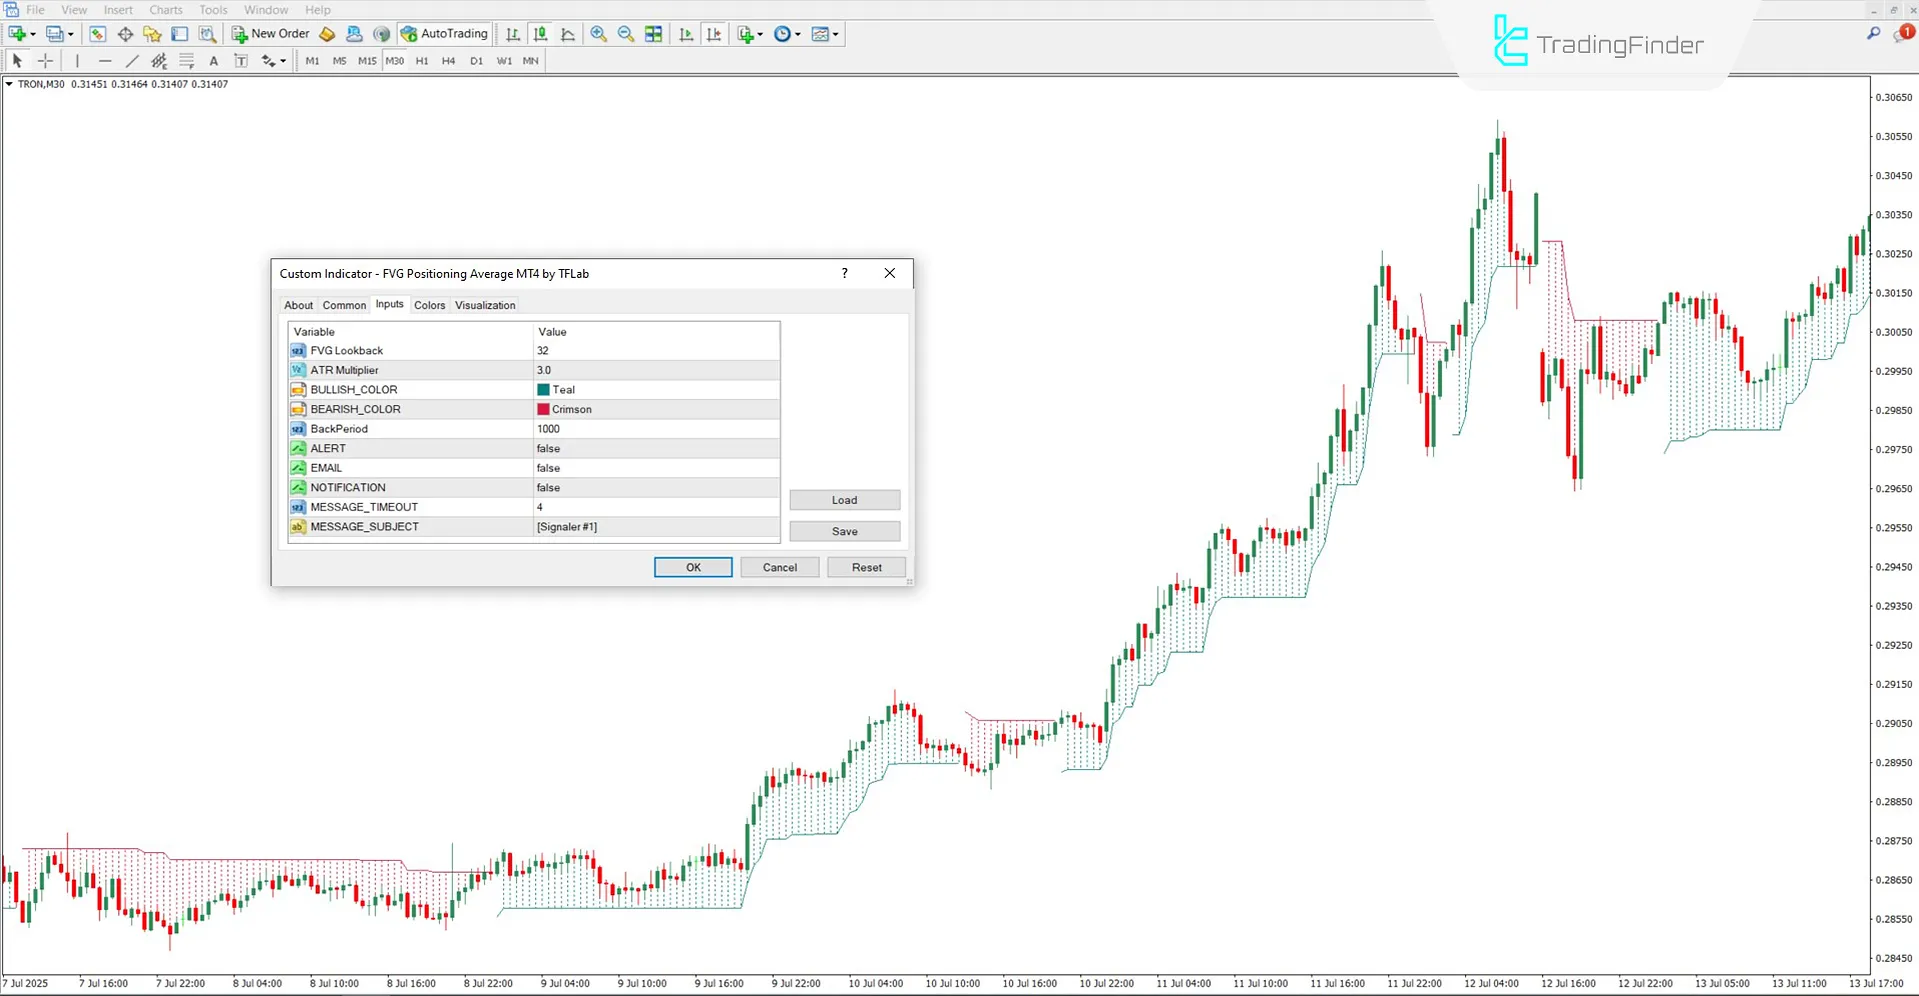
The FVG Positioning Average Indicator settings include the following:

- FVG Lookback: Number of candles for calculating Fair Value Gap zones
- ATR Multiplier: Amplification factor based on the ATR indicator
- BULLISH_COLOR: Color for displaying bullish zones
- BEARISH_COLOR: Color for displaying bearish zones
- BackPeriod: Number of past candles used for averaging
- ALERT: Enable alert
- EMAIL: Send alert via email
- NOTIFICATION: Send internal notification
- MESSAGE_TIMEOUT: Duration of the alert message display
- MESSAGE_SUBJECT: Subject of the alert message
Conclusion
The FVG Positioning Average Indicator is designed for traders seeking statistically and logically defined areas for entry and exit points.
This tool plots zones on the chart using averages based on Fair Value Gaps, indicating areas where price is highly likely to reverse upon interaction.
FVG Positioning Average Indicator MT4 PDF
FVG Positioning Average Indicator MT4 PDF
Click to download FVG Positioning Average Indicator MT4 PDFDoes this indicator provide trade entry signals?
The FVG Positioning Average Indicator does not explicitly generate signals, but the beginning of FVG average zones can be considered as signals.
Can this tool be used on lower timeframes?
Yes, this indicator is multi-timeframe and can be used across all timeframes.


